Rep:Mod:taromatichemistry2013
3rd Year Computational Chemistry Laboratory (Part Two): Aromaticity
Name: Yong Ren Tan (CID:00703262)
Introduction
In 1865, Kekule has came out with the idea of aromaticity for unsually stable organic compounds (i.e. benzene). [1] He also came out with the 4n+2 aromaticity rule to verify the aromaticity of a cyclic system, where n = 0, 1, 2, 3... and the number obtained would be the number of electrons for the aromaticity to be persent in the system. This rule came out to be very useful as a benchmark to determine whether a system is aromatic or not as aromaticity can't be directly observed via experiment nor quantified.
Thus, various methods have been devised to 'measure' aromaticity. For this project, the aromaticity of four isoelectronic systems were computed with their MO diagrams being analyzed to examine on their aromatic character. Also, the MOs that contributed to their aromaticity were identified as well. The four isoelectronic systems examined were benzene, boratabenzene, pyrimidium, and borazine. All the four molecules have 6 delocalized electrons whizzing in the ring, which resulted in the aromaticity.
Also, all the MOs of the compounds were computed and compared. Herein the results of the experiement were reported.
Benzene
Optimisation
Computational analysis of benzene was investigated using Gaussian 09. It was optimized using the DFT B3LYP/6-31G(d,p) calculations. The log data of the calculation would be found from the link below:
OPT_benzene_DFT_B3LYP_6-31G(d,p)
The data below shows the details and the results of the calculation. The energy obtained was -232.25821387 a.u. The optimisation was complete as the RMS Gradient Norm is less than 0.001 a.u.
| File Type | .log |
| Calculation Type | FOPT |
| Calculation Method | RB3LYP |
| Basis Set | 6-31G(d,p) |
| Charge | 0 |
| Spin | Singlet |
| E(RB3LYP) | -232.25821387 a.u. |
| RMS Gradient Norm | 0.00008450 a.u. |
| Imaginary Freq | nil |
| Dipole Moment | 0.00 Debye |
| Point Group | D6h |
| Job cpu time | 37.0 seconds |
Also, the job had already converged. It was proven from the data below showing that the full convergence after the job.
 Item               Value     Threshold  Converged?
 Maximum Force            0.000199     0.000450     YES
 RMS     Force            0.000081     0.000300     YES
 Maximum Displacement     0.000847     0.001800     YES
 RMS     Displacement     0.000299     0.001200     YES
 Predicted change in Energy=-4.636830D-07
 Optimization completed.
    -- Stationary point found.
From the calculation, it was found that benzene has the following data for bond length and bond angle.
Bond length (C=C): 1.40 Å
Bond length (C-H): 1.09 Å
Bond angle (H-B-H): 120.0 deg.
The bond length agreed well with the literature value as listed below: [2]
Bond length (C=C): 1.40 Å
Bond length (C-H): 1.08 Å
Also, it is univesally well known that benzene bond angle (C-C-C)is 120.0 deg and it was well predicted by the computation work.
Frequency analysis
After the optimisation, the calculation was proceeded with the frequency calculation of benzene. The log file of the data was found form the link below:
The data below shows the details and the results of the calculation. The energy obtained was -232.25821387 a.u., which is similar to the energy obtained from the optimisation above. The frequency calculation was completed as the RMS Gradient Norm is less than 0.001 a.u.
| File Type | .log |
| Calculation Type | FREQ |
| Calculation Method | RB3LYP |
| Basis Set | 6-31G(d,p) |
| Charge | 0 |
| Spin | Singlet |
| E(RB3LYP) | -232.25821387 a.u. |
| RMS Gradient Norm | 0.00008452 a.u. |
| Imaginary Freq | nil |
| Dipole Moment | 0.00 Debye |
| Point Group | D6h |
| Job cpu time | 51.0 seconds |
Also, the job had already converged. It was proven from the data below showing that the full convergence after the job.
Item               Value     Threshold  Converged?
 Maximum Force            0.000199     0.000450     YES
 RMS     Force            0.000085     0.000300     YES
 Maximum Displacement     0.000806     0.001800     YES
 RMS     Displacement     0.000346     0.001200     YES
 Predicted change in Energy=-4.349367D-07
 Optimization completed.
    -- Stationary point found.
The two lines of frequencies found from the log file was shown below:
   Low frequencies ---   -5   -5   0   0   0    10
 Low frequencies ---  414  414  621
MO diagram
Aromaticity is a concept where lone pair orbitals, empty orbitals or filled orbitals, involved in unsaturated bond formation, forms an unexpectedly stable conjugated ring system. The electrons of the orbitals would be delocalized throughout the ring. The unexpected stabilisation would not exist with the linear conjugation version of the same compound (isoelectronic and isoatomic). The electron cloud would spread throughout the molecule, allowing it to have delocalization and hence consequent to stabilization of the molecule. As such, benzene has a conjugated ring system with ring carbon pz orbitals perpendicular to the planar ring. With all the pz orbitals being in phase with each other, it forms a totally bonding ring of pz orbitals, which was shown in the MO diagram above (energy level -0.3599887 a.u., a2u). It was observed that there are two out of phase clouds of electron density above and below of the ring which was fully delocalized encapsulating the ring.
The other energy levels that were involved in the delocalization of the MOs were also contributing to the aromaticity of benzene but the MOs were not as delocalized as the energy level -0.3599887 a.u., a2u. As such, the HOMO and LUMO levels are partially delocalized overall the ring.
Also, in the MO diagram above, the core orbitals are composed of the carbon 2s orbitals which was much lower in energy, about ten times lower. Thus the energy scale was truncated to allow easier visualization of the MO diagram. This showed that these orbitals are core-like orbitals that does not participate in the delocalization and not contributing to the aromaticity.
Other than using the MO diagrams, aromaticity of benzene could also be described using the difference in thermodynamic data. As such, the heat of hydrogenation:
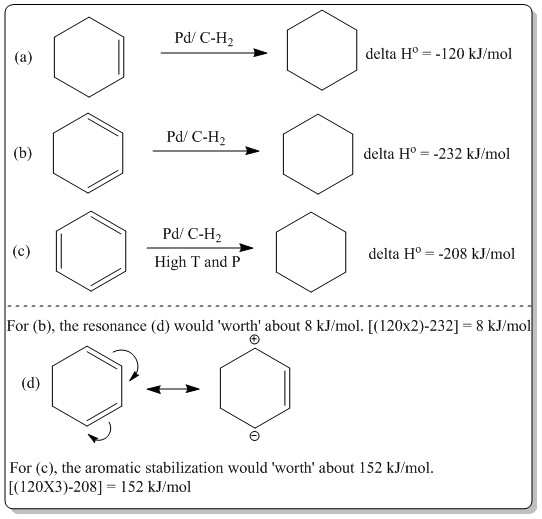
Thus, aromaticity in benzene can be defined and proved in numerous methods. The aromaticity of benzene follows Huckel's 4n+2 rule where in benzene, there are 6 pz electrons. It obeys the 4n+2 rule where n=1, 4(1)+2=6. All the 6 electron were delocalized in the MOs as shown in the MO diagram above where the mostb prominent contribution of the delocalization MO is the MO at energy level -0.3599887 a.u., a2u.
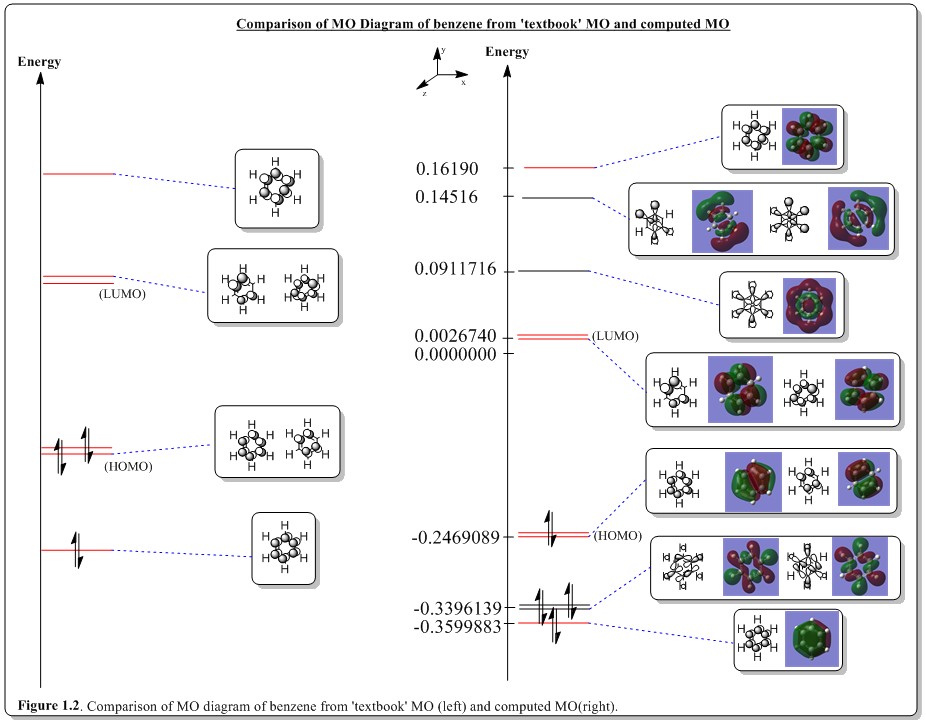
From the figure above, the MOs colored in red are the comparrable MOs between the 'textbook' MOs and computed MOs.
In common textbooks, when benzene was described, only the ring of carbon pz orbitals are discussed and considered in determining the MO at the HOMO-LUMO region. However, from the diagram above, it was shown that there are plenty of sigma orbitals interleaved with the pi MOs. The common way to predict the HOMO and LUMO using a ring carbon of pz orbitals is fairly good, in terms of qualitatively. They have the common pattern as computed from Gaussian. However the other two MOs, (i.e. LUMO+1 and HOMO-1) were not well predicted, in terms of the position; but pattern wise, it was superb. It was computed that in between HOMO/HOMO-1 and LUMO/LUMO+1, there where MOs that are not being predicted from just considering the pz orbitals only. From careful observation of the computed MOs, the gap of between HOMO/HOMO-1 and LUMO/LUMO+1 are unequal where the later case (LUMO/LUMO+1) has a larger gap. In 'textbook' MOs, the HOMO/HOMO-1 and LUMO/LUMO+1 gaps are both equal. This was because the ordinary method does not take into account of the antibonding MOs having higher energy than of the bonding MOs and which deviated in terms of the energy gap from the calculated MOs.
NBO charge analysis
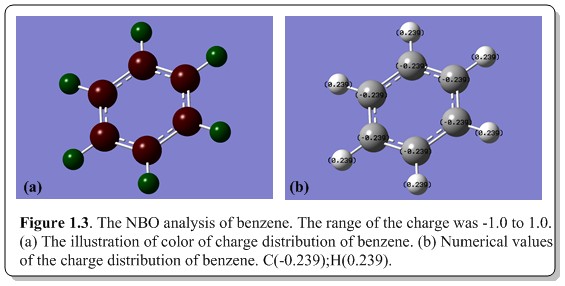
Within the range of the charge distribution of 1.0 to -1.0, the all the carbon atoms were given charge -0.239 (colored dark red) while all the hydrogen atoms were given charge 0.239 (colored dark green). This is an indication that all the carbon atoms share the same distribution of electron cloud around the ring and pull electrons away from the hydrogen atoms, forming an electron core on top and below the benzene ring, which is delocalized around the ring. It is very reasonable as carbon is more electronegative than hydrogen and thus have more affinity for electrons which resulted in such phenomena.
Boratabenzene
Optimisation
Computational analysis of Boratabenzene was investigated using Gaussian 09. It was optimized using the DFT B3LYP/6-31G(d,p) calculations. The log data of the calculation would be found from the link below:
OPT_boratabenzene_DFT_B3LYP_6-31Gdp
The data below shows the details and the results of the calculation. The energy obtained was -219.02053085 a.u. The optimisation was complete as the RMS Gradient Norm is less than 0.001 a.u.
| File Type | .log |
| Calculation Type | FOPT |
| Calculation Method | RB3LYP |
| Basis Set | 6-31G(d,p) |
| Charge | -1 |
| Spin | Singlet |
| E(RB3LYP) | -219.02053085 a.u. |
| RMS Gradient Norm | 0.00006158 a.u. |
| Imaginary Freq | nil |
| Dipole Moment | 2.8406 Debye |
| Point Group | C1 |
| Job cpu time | 53.0 seconds |
Also, the job had already converged. It was proven from the data below showing that the full convergence after the job.
 Item               Value     Threshold  Converged?
 Maximum Force            0.000099     0.000450     YES
 RMS     Force            0.000029     0.000300     YES
 Maximum Displacement     0.001111     0.001800     YES
 RMS     Displacement     0.000250     0.001200     YES
 Predicted change in Energy=-1.567935D-07
 Optimization completed.
    -- Stationary point found.
From the calculation, it was found that boratabenzene has the following data for bond length and bond angle.
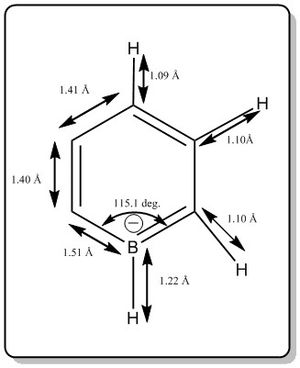
The bond angles of other C-C-C and B-C-C bonds were not shown but it is about 120.0 deg.
The literature values are as listed below:[3] [4]
Bond length(Car-B-)= 1.45-1.48 Å
Bond length(Car=Car)= 1.380 Å
Bond length (Car-H) = 1.083 Å
Bond length (Bar-H) = 0.943 Å
Bond angle range: 116 deg. to 122 deg.
The values are slightly deviated from the literature value. A better basis set should be used to get better calculation but it is good enough for the qualitative modelling of the MO diagram patterns.
Frequency analysis
After the optimisation, the calculation was proceeded with the frequency calculation of boratabenzene. The log file of the data was found form the link below:
The data below shows the details and the results of the calculation. The energy obtained was -219.02052979 a.u., which is similar to the energy obtained from the optimisation above. The frequency calculation was completed as the RMS Gradient Norm is less than 0.001 a.u.
| File Type | .log |
| Calculation Type | FREQ |
| Calculation Method | RB3LYP |
| Basis Set | 6-31G(d,p) |
| Charge | -1 |
| Spin | Singlet |
| E(RB3LYP) | -219.02052979 a.u. |
| RMS Gradient Norm | 0.00016443 a.u. |
| Imaginary Freq | nil |
| Dipole Moment | 2.8466 Debye |
| Point Group | C2v |
| Job cpu time | 37.0 seconds |
Also, the job had already converged. It was proven from the data below showing that the full convergence after the job.
Item               Value     Threshold  Converged?
 Maximum Force            0.000434     0.000450     YES
 RMS     Force            0.000164     0.000300     YES
 Maximum Displacement     0.000889     0.001800     YES
 RMS     Displacement     0.000398     0.001200     YES
 Predicted change in Energy=-7.654698D-07
 Optimization completed.
    -- Stationary point found.
The two lines of frequencies found from the log file was shown below:
   Low frequencies ---  -13   0   0    0   15   18
 Low frequencies ---  371 404  565
Pyridinium
Optimisation
Computational analysis of Pyridinium was investigated using Gaussian 09. It was optimized using the DFT B3LYP/6-31G(d,p) calculations. The log data of the calculation would be found from the link below:
OPT_pyridinium_DFT_B3LYP_6-31Gdp
The data below shows the details and the results of the calculation. The energy obtained was -248.66807396 a.u. The optimisation was complete as the RMS Gradient Norm is less than 0.001 a.u.
| File Type | .log |
| Calculation Type | FOPT |
| Calculation Method | RB3LYP |
| Basis Set | 6-31G(d,p) |
| Charge | 1 |
| Spin | Singlet |
| E(RB3LYP) | -248.66807396 a.u. |
| RMS Gradient Norm | 0.00003894 a.u. |
| Imaginary Freq | nil |
| Dipole Moment | 1.8727 Debye |
| Point Group | C1 |
| Job cpu time | 52.0 seconds |
Also, the job had already converged. It was proven from the data below showing that the full convergence after the job.
 Item               Value     Threshold  Converged?
 Maximum Force            0.000065     0.000450     YES
 RMS     Force            0.000023     0.000300     YES
 Maximum Displacement     0.000826     0.001800     YES
 RMS     Displacement     0.000176     0.001200     YES
 Predicted change in Energy=-6.972465D-08
 Optimization completed.
    -- Stationary point found.
From the calculation, it was found that pyridinium has the following data for bond length and bond angle.
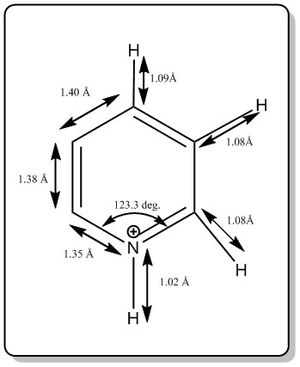
The bond angles of other C-C-C and N-C-C bonds were not shown but it is about 120.0 deg.
The literature values are as shown below:[3]
Bond length(Car-N+)= 1.335 Å
Bond length(Car=Car)= 1.380 Å
Bond length (Car-H) = 1.083 Å
Bond length (Nar-H) = 1.033 Å
The values agreed well with the literature value. A better basis set could be used to get better calculation but it is good enough for the qualitative modelling of the MO diagram patterns.
Frequency analysis
After the optimisation, the calculation was proceeded with the frequency calculation of pyridinium. The log file of the data was found form the link below:
The data below shows the details and the results of the calculation. The energy obtained was -248.66807396 a.u., which is similar to the energy obtained from the optimisation above. The frequency calculation was completed as the RMS Gradient Norm is less than 0.001 a.u.
| File Type | .log |
| Calculation Type | FREQ |
| Calculation Method | RB3LYP |
| Basis Set | 6-31G(d,p) |
| Charge | 1 |
| Spin | Singlet |
| E(RB3LYP) | -248.66807396 a.u. |
| RMS Gradient Norm | 0.00003897 a.u. |
| Imaginary Freq | nil |
| Dipole Moment | 1.8727 Debye |
| Point Group | C1 |
| Job cpu time | 74.0 seconds |
Also, the job had already converged. It was proven from the data below showing that the full convergence after the job.
 Item               Value     Threshold  Converged?
 Maximum Force            0.000156     0.000450     YES
 RMS     Force            0.000039     0.000300     YES
 Maximum Displacement     0.000778     0.001800     YES
 RMS     Displacement     0.000229     0.001200     YES
 Predicted change in Energy=-7.500740D-08
 Optimization completed.
    -- Stationary point found.
The two lines of frequencies found from the log file was shown below:
  Low frequencies ---   -7   0   0    0   17   19
 Low frequencies ---  392  404  620
Borazine
Optimisation
Computational analysis of Borazine was investigated using Gaussian 09. It was optimized using the DFT B3LYP/6-31G(d,p) calculations. The log data of the calculation would be found from the link below:
OPT_borazine_DFT_B3LYP_6-31Gdp
The data below shows the details and the results of the calculation. The energy obtained was -242.68458756 a.u. The optimisation was complete as the RMS Gradient Norm is less than 0.001 a.u.
| File Type | .log |
| Calculation Type | FOPT |
| Calculation Method | RB3LYP |
| Basis Set | 6-31G(d,p) |
| Charge | 0 |
| Spin | Singlet |
| E(RB3LYP) | -242.68458756 a.u. |
| RMS Gradient Norm | 0.00017741 a.u. |
| Imaginary Freq | nil |
| Dipole Moment | 0.0005 Debye |
| Point Group | C1 |
| Job cpu time | 42.0 seconds |
Also, the job had already converged. It was proven from the data below showing that the full convergence after the job.
 Item               Value     Threshold  Converged?
 Maximum Force            0.000202     0.000450     YES
 RMS     Force            0.000080     0.000300     YES
 Maximum Displacement     0.000900     0.001800     YES
 RMS     Displacement     0.000306     0.001200     YES
 Predicted change in Energy=-8.707270D-07
 Optimization completed.
    -- Stationary point found.
From the calculation, it was found that pyridinium has the following data for bond length and bond angle.
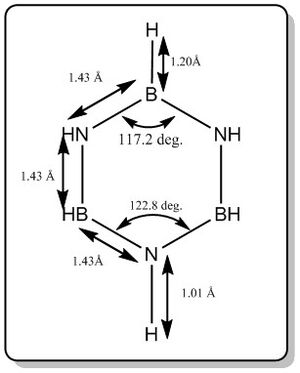
In comparrison with literature[5], the bond length and angle computed (as shown in the diagram above) was quite close with the reported literature values as shown below. To improve on the quality of the results, better basis should be used to perform the calculation.
Bond length (B-N) = 1.4355 +/- 0,0021 Å
Bond length (B-H) = 1.258 +/- 0.014 Å
Bond length (N-H) = 1.050 +/- 0.012 Å
Bond angle (N-B-N) = 117.7 +/- 1.2 deg.
Bond angle (B-N-B) = 121.1 +/- 1.2 deg.
Frequency analysis
After the optimisation, the calculation was proceeded with the frequency calculation of borazine. The log file of the data was found form the link below:
The data below shows the details and the results of the calculation. The energy obtained was -242.68458793 a.u., which is similar to the energy obtained from the optimisation above. The frequency calculation was completed as the RMS Gradient Norm is less than 0.001 a.u.
| File Type | .log |
| Calculation Type | FREQ |
| Calculation Method | RB3LYP |
| Basis Set | 6-31G(d,p) |
| Charge | 0 |
| Spin | Singlet |
| E(RB3LYP) | -242.68458793 a.u. |
| RMS Gradient Norm | 0.00017722 a.u. |
| Imaginary Freq | nil |
| Dipole Moment | 0.0006 Debye |
| Point Group | C1 |
| Job cpu time | 66.0 seconds |
Also, the job had already converged. It was proven from the data below showing that the full convergence after the job.
Item               Value     Threshold  Converged?
 Maximum Force            0.000448     0.000450     YES
 RMS     Force            0.000177     0.000300     YES
 Maximum Displacement     0.000928     0.001800     YES
 RMS     Displacement     0.000426     0.001200     YES
 Predicted change in Energy=-9.744181D-07
 Optimization completed.
    -- Stationary point found
The two lines of frequencies found from the log file was shown below:
  Low frequencies ---  -14  -12   0 0  0   7
 Low frequencies ---  289  290  404
Compare and contrast the charge distribution of benzene with those of the analogues.
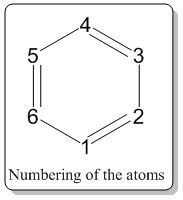
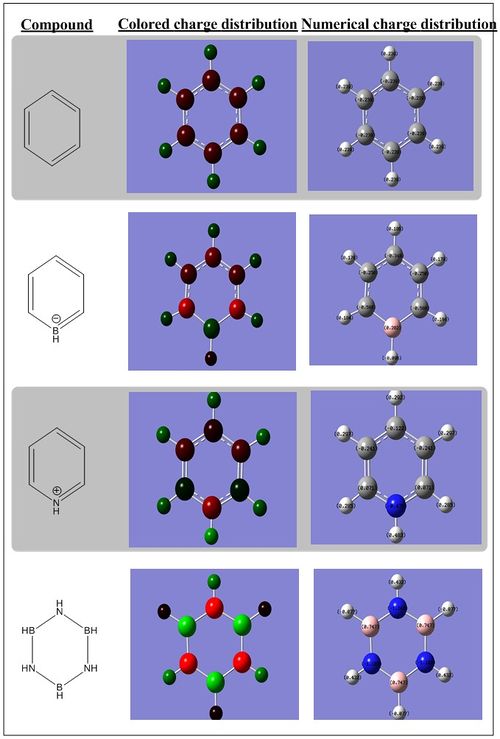
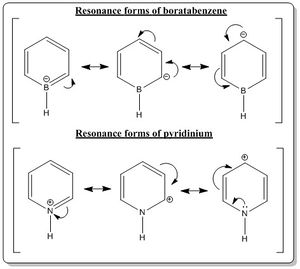
All the numerical charge distributions for all the compounds were set to have the range of -1.0 (bright red) to 1.0(bright green). Also, the description of the charge distribution would be described using the number of atoms around the ring with the numbering system adapted from Figure 1.4. Also, in the description of the electronegativity, the Pauling electronegativity scale was employed and have the following values: Hydrogen (2.20), Boron (2.04), Carbon (2.55), and Nitrogen (3.04).
As described earlier, the benzene carbon atoms have equal share of the negative charge and same goes to all the hydrogen atoms which have all the same share of positive charge. When the atom 1 (According to the numbering system in Figure 1.4) is substituted by a boron atom (boratabenzene), the boron being less electronegative than carbon and hydrogen would suffer form electron deficiency as it is less likely to have strong affinity for electrons and it was reflected in the Gaussian calculation where it has positive charge of 0.202 (colored dark green).
The carbon atoms at position 2 and 6 have the most negative charge distribution (-0.588, bright red), followed by carbon at position 4 (-0.340, moderate bright red) and lastly carbon at position 3 and 5(-0.250, dark red). It could be explained from the resonance forms as shown in the Figure 1.5. As seen from the resonance form, the negative charge is quite likely to stay on carbon 2, 4 and 6. Thus, these resonance forms could be used to rationalize the phenomena shown from the computed charge distribution. Also, from the Gaussian calculations, it was also observed that the negative charge is better stabilized at carbon 2 and 6 compared to carbon 4. It could be rationalized from the carbon 2 and 6 being bonded to the boron atom directly and boron dislikes having the negative charge on itself as it is less electronegative, thus, the electron density is more attracted to the carbon and consequently the carbon 2 and 6 have more negative charge distribution.
Also, it is worth noting that the hydrogen atom bonded directly to boron atoms has different charge distribution than other hydrogen atoms that are bonded to carbon atoms. The hydrogen atom that is bonded directly to the boron atom has more share of electrons than of the hydrogen atoms that are bonded to the carbon atoms because boron atom is less electronegative than hydrogen atom. The hydrogen atom bonded to the boron has charge distribution of -0.096 (very dark red) while the hydrogen atoms bonded to the carbon atoms have positive charge distribution of 0.184 (carbon 2 and carbon 6), 0.179 (carbon 3 and carbon 5) and 0.186 (carbon 4). The positive charge distribution of the carbon atom bonded hydrogen atoms were not evenly distributed despite having all of them bonded similarly to carbon atoms. This could be attributed to the slight difference in the charge distribution of the carbon-atom-bonded to the hydrogen atoms. and thus as expected, the hydrogen bonded to carbon 2 and 6 would have a lower positive charge distribution than other hydrogen atoms.
On the other hand, when the carbon at position 1 is substituted with nitrogen (pyridinium), the charge distribution changed drastically. Nitrogen is much more electronegative than carbon adn hydrogen. Thus at first instance, the hydrogen directly bonded to the nitrogen would suffer from electron deficiency, thus having more positive charge distribution than other hydrogen atoms in the ring. From the calculation, it was verified as the hydrogen atom directly bonded to the nitrogen has charge distribution of 0.483 (bright green), whilst other hydrogen were around 0.28-0.30 with dark green color.
The carbon atoms at position 2 and 6 have the most positive charge distribution (0.071, dark green), followed by carbon at position 4 (-0.122, very dark red) and lastly carbon at position 3 and 5(-0.241, dark red). It could be explained from the resonance forms as shown in the Figure 1.5. As seen from the resonance form, the positive charge is quite likely to stay on carbon 2, 4 and 6. Thus, these resonance forms could be used to rationalize the phenomena shown from the computed charge distribution. Also, from the Gaussian calculations, it was also observed that the positive charge is better stabilized at carbon 2 and 6 compared to carbon 4. This is because nitrogen is more electronegative, thus it does not favor to have the positive charge on it. Therefore, carbon 2 and 6, being bonded to the nitorgen atom directly and having nitrogen dislikes having the positive charge on itself ,the electron density is more attracted to the nitorgen and consequently the carbon 2 and 6 have more positive charge distribution.
Also, the hydrogen atoms bonded to the carbon atoms have less positive charge distribution of around 0.285 (carbon 2 and carbon 6), 0.297 (carbon 3 and carbon 5) and 0.292 (carbon 4)compared to the hydrogen atom that is directly bonded to nitrogen. The charge distribution of the carbon-atom-bonded hydrogen atoms were not evenly distributed despite having all of them bonded similarly to carbon atoms. This could be attributed to the slight difference in the charge distribution of the carbon-atom-bonded to the hydrogen atoms. and thus as expected, the hydrogen bonded to carbon 2 and 6 would have a lower positive charge distribution than other hydrogen atoms as the carbon 2 and 6 have less electron share.
Lastly, in borazine, there is a clear reflection of the relation between electornegativity and the charge distribution. Boron in borazine has charge distribution of 0.747 while nitrogen has charge distribution of -1.103. This can be rationalized from the fact that boron is less electronegative than nitrogen, thus nitrogen has more share of the electron density (and negative charge). The charge distribution of hydrogen atoms directly bonded to the boron and nitrogen are also affected by the electronegativity of the atom it is directly bonded to. To exemplify, as nitrogen is more electronegative than hydrogen as well, it would shift the electron density away from its adjacent hydrogen, resulting in the hydrogen to have positive charge distribution of 0.432. On the other hand, the hydrogen bonded to boron has more negative charge distribution as hydrogen is more electronegative than boron thus, it would get more share of the electron density, thus having charge distribution of -0.077.
| Compound | H4 | H1 | Atom 4 | Atom 1 |
| Benzene | 0.239 | 0.239 | -0.239 | -0.239 |
| Boratabenzene | 0.186 | -0.095 | -0.340 | 0.202 |
| Pyrimidine | 0.292 | 0.483 | -0.122 | -0.476 |
| Borazine | 0.432 | -0.077 | -1.103 | 0.747 |
From the table above, it can be seen that with addition of electronegative atom (in pyrimidine), H1 atom, which is not directly bonded to the electronegative atom (except for borazine) would have a more positive charge distribution comparred to benzene, for the reason of the electronegative atom pulling the electron density away, towards itself. In substitution of less electronegative atom (in boratabenzene), the value decreased as the hydrogen atom has more share of electrons. Meanwhile, when hydrogen is directly bonded to nitrogen atom, it would suffer from more drastic increase in positive charge distribution as shown in H4 of borazine and H1 of pyrimidine. The trend repeats itself which is a strong reflection of electronegativity in Atom 4 and Atom 1.
In short, substitution of more electronegative atom compared to carbon will result in all the other carbon atoms and hydrogen atoms that are not bonded directly to the electronegative atom to increase in positive charge distribution, relative to benzene. The addition of less electronegative atom compared to carbon will result in all the other carbon atoms and hydrogen atoms that are not bonded directly to the substituted atom to decrease charge distribution. The charge distribution of the substituted atom would follow its electronegativity, having more positive charge distribution when it is less electronegative than carbon and vice versa.
Compare and contrast the MOs of benzene with those of the analogues.
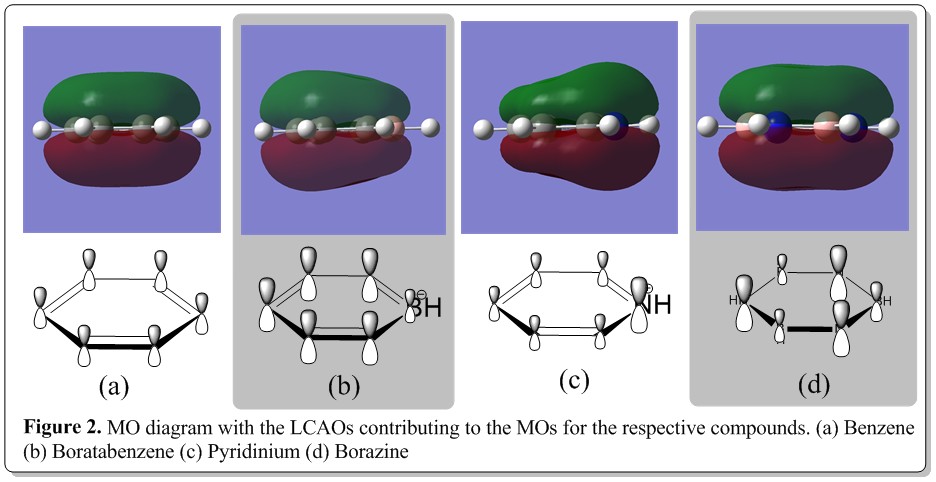
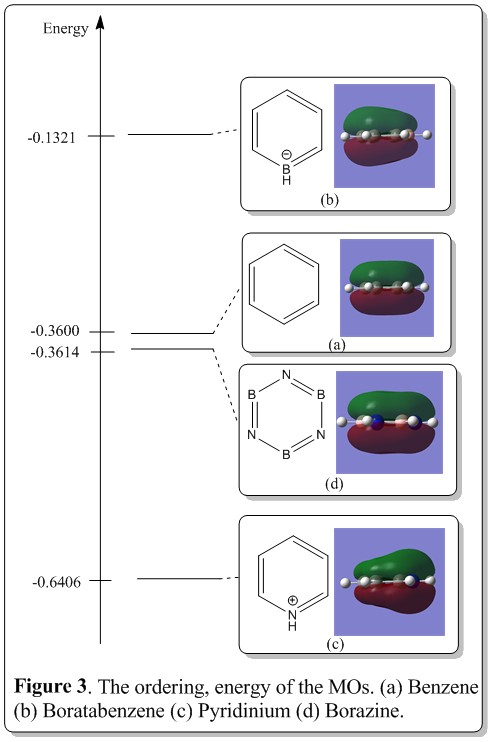
Benzene, boratazine, pyridinium and borazine are isoelectronic molecules, having 12 atoms with 42 electrons. A comparison was performed with three of the computed MOs. and the results where presented as shown below. Also, a summarized, coarse MO diagram of the molecules is as shown below (note that the MO diagram does not show the core orbitals which is deep down in the MO diagram which contains 12 electrons:
MO level 17
Discussion of LCAOs and comparison between these MOs.
From Figure 2 and Figure 3, the MO (generated from Gaussian calculation) comparison of benzene, boratabenzene, pyridinium and borazine was depicted. From Figure 2, it was illustrated with the MO diagram of each compound with their respective LCAOs being postulated, contributing to the overall MO. In general trend, the MO are made up of the pz orbitals of the ring skeletal atoms, without any contribution from the hydrogen atoms. Also, the pz orbitals are totally bonding around the ring, making the MO of that level having two out of phase, delocalised electron cloud system above and below the ring. From the LCAOs being postulated, in benzene, the pz orbitals of the carbons have the same coefficient and thus bearing the same size and contribution to the MO around the ring. It can be described as an even cloud of electron density, with the top and bottom side of the ring having a flat surface. On the other hand, comparing with MO of borazine, it has almost similar characteristics, which was being made out of pz orbitals of the skeletal ring atoms but there was a slight difference other than that being pz orbitals of different atoms. As being illustrated, there was a dent in the middle of the top and bottom electron cloud, instead of a flat surface of the MO (electron density) The observation could be rationalized from the reason where there was more affinity of the electron cloud towards the ring atoms instead of it being evenly spread across the surface of ring. This was due to the benzene skeletal ring atoms have the same electronegativity atoms around the ring but the borazine has alternate boron and nitrogen atoms around the ring, making the ring having alternate high and low electronegativity points or sections which distorted the evenly spread electron cloud in benzene. Also, from the LCAO, the electronegativity effect of boron and nitrogen that resulted in the uneven electron cloud was taken into account in proposing the LCAO of the borazine where the more electronegative nitrogen has more contribution (larger pz orbital) than of boron.
On the other hand, the electronegativity effect of the boron and nitrogen could be shown explicitly from the MO of boratabenzene and pyridinium. As expected, the top and bottom surface of the MOs are not flat. There was a glaringly obvious electronegativity effect as exemplified by the nitrogen and boron. In case of the pyridinium, the electron cloud was shown to be being pulled towards the side of the ring with the nitrogen while in the case of the boratabenzene, the electron density was shown to be pulled away from the side of the ring with boron atom, resulting in a dented part at the side of ring with boron atom. Meanwhile, the LCAOs postulation of the pyridinium and boratabenzene was shown in Figure 2 and having the electronegativity being taken into account and fitted well with the result of the computational experiment. All the pz orbitals are bonding around the ring, forming the fully bonding MO for the molecules.
Discussion of energy and ordering of the MOs.
As shown in Figure 3, the relative energy and ordering of the MOs were illustrated. Boratazine has the highest energy, followed by benzene, borazine and lastly boratazine. This, again can be explained from the perspective of electronegativity. Boron, compared to carbon and nitrogen has the lowest electronegativity, thus its 2s and 2p orbitals are in general higher in energy than of carbon and nitrogen. Thus, in the boratabenzene, the MO energy level is higher in energy than of benzene, and pyridinium. The trend follows on with the benzene MO energy level lower than of boratabenzene and the pyridinium having the lowest MO energy overall.
Besides that, the borazine and benzene has almost the same energy level, with borazine having 0.0014 a.u. lower than of the benzene which suggested that in this bonding state, borazine is slightly more stable (or aromatic) than of benzene.
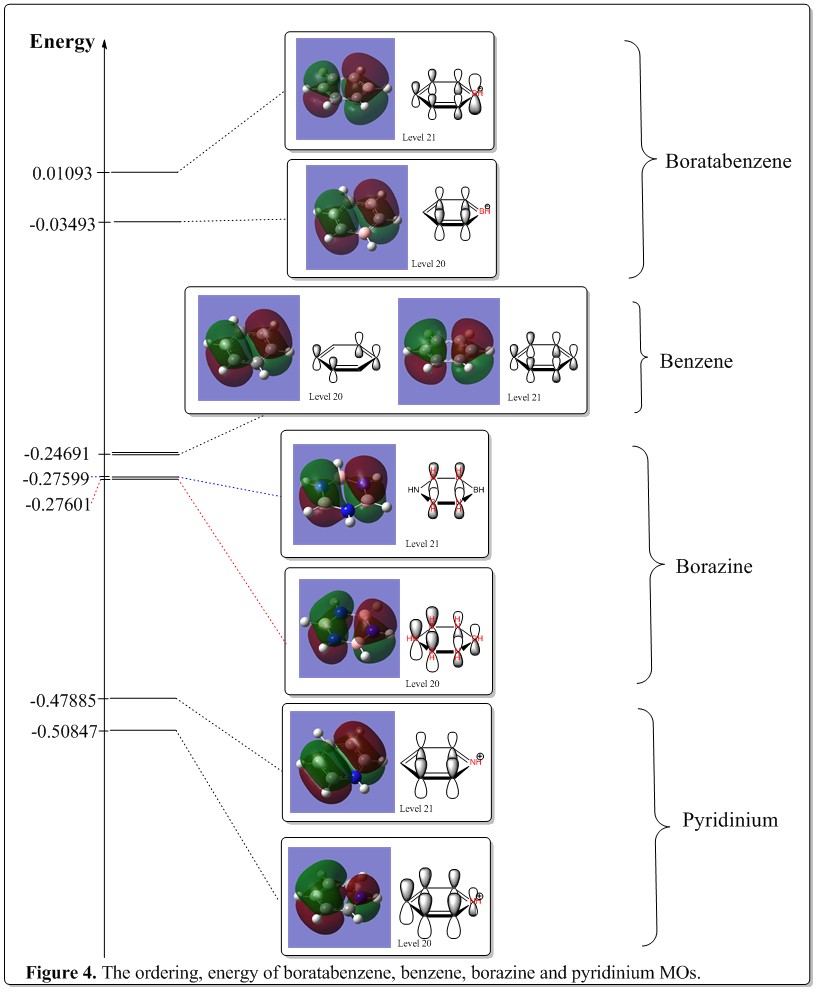
MO level 20 and 21
Discussion of LCAOs and comparison between these MOs.
The chosen MOs are composed of pz orbitals as well. In benzene, they are assigned as e1g symmetry labels. One of the MOs is actually made up of four pz orbitals, situated at position 2, 3, 5, and 6. The orbitals adjacent to each other forms bonding interaction, where the pair that is opposite of the them would be having antibonding interactions. In overall, it has antibonding character.
It has its degenerate pair, which is composed of six pz orbitals as well. Three adjacent in phase pz orbitals would form bonding interactions with each other with the opposite three pz orbitals having antibonding interactions. This forns a partially delocalized electron system.
The patterm of the LCAOs are the same for borazine, pyridinium, boratabenzene and benzene. However, there was quite a prominent difference in the coefficient of each of the pz orbitals. As metioned earlier, in these MOs, the basic concept was that there would be two equal out of phase electron densities opposite of each other. Yet, this appiles to benzene solely. This is because when substituted with boron or nitrogen, the side with boron would appear larger whilst the side with nitrogen would be smaller. This could be explained with the electronegative argument again. As this is considered as an antibonding orbital, the electron density would then have larger density at the side with less electronegative atoms, which is totally opposite of the bonding orbital discussed earlier.
Discussion of energy, degeneracy and ordering of the MOs.
The chosen MOs are a pair of degenerate MOs, which make up of the HOMO of benzene. They have the energy of -0.24691 a.u. When it comes to borazine, the orbitals with similar phase pattern and having the role of HOMO started to lose slightly of its degeneracy, primarily due to it being less symmetrical than of benzene. The overall energy of the orbitals were much lower than of benzene, i.e. -0.27599 a.u. and -0.27601 a.u. This could be rationalized from the fact that the electronegativity effect of nitrogen was so great that its orbitals are mostly very deep down in energy. Thus, despite boron being less electronegative, the effect brought about by nitrogen dominate the energy levels and this pulling the overall HOMO lower than of benzene.
When one of the carbon atoms in benzene is substituted with boron or nitrogen, the degeneracy of the MOs collapses. They become non-degenerate, and the energies hae significant increase for the boratabenzene, and significant decrease for the pyridinium, which was the same trend in the level 17 MOs and could be rationalized from the similar argument that more electronegative atoms would have their AOs lower and thus result in lower overall MOs formed.
From careful observation, it was seen that after the degeneracy was broken, there would be one MO becoming higher in energy than the other. As from the diagram above, there was no obvious trend of favoring of either MOs, but there was a clear cut that those benerath of benzene have the MOs with four pz orbitals at higher energy. However, for the one above of the benzene MO energy level, the inverse phenomena was observed where the MO made up of four pz orbitals would be lower in energy when the degeneracy collapsed. The reasoning was still unclear and it was most likely due to the electronegativity effect on the electron density in MOs and thus resulted in the difference in energy.
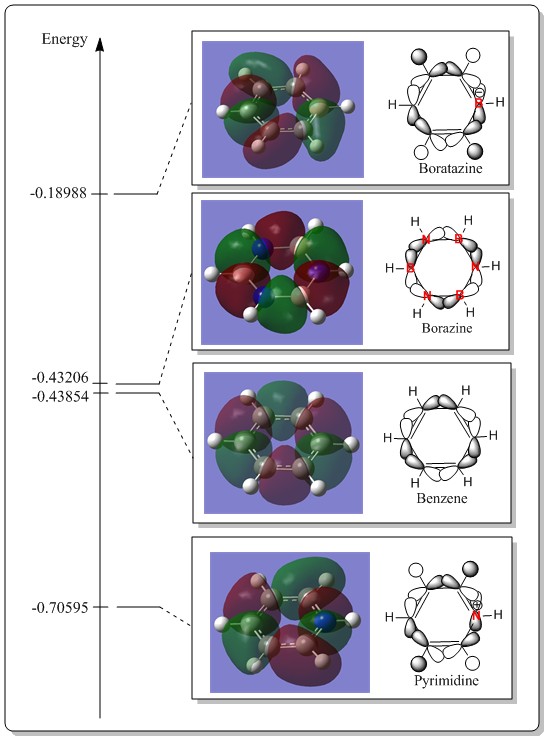
MO level 15
Discussion of LCAOs and comparison between these MOs.
For benzene, the LCAOs composition is made up of six equivalent carbon px or py orbitals, forming a ring, which is parallel with the plane of the ring. The p orbital phases on each carbon is alternating from one to the next, forming bonding interaction in between two carbon atoms and having a node on the carbon itself. It is a sigma interaction of the p orbitals.
In borazine, the pattern is similar. However, due to nitrogen being more electronegative, the nitrogen p orbital would be slightly larger than of the boron p orbital. Despite having difference in the p orbitals, the lobes are quite even in sizes as each of the sigma bonds have contribution from nitrogen and thus are all quite equally in size. The only slight difference would be a slight skew of the electron density towards the nitrogen atom.
In general, the MOs of borazine and benzene are quite similar. However, for the case of pyrimidine and boratazine, there was a significant hydrogen atom s orbitals contribution to the overall MOs which is non-existence in benzene and borazine. From the LCAOs being postulated, four hydrogen s orbitals are involved in the formation of the overall MO. The ability of such interaction could be manifested from the fact that the decrease in the symmetry of boratazine and pyrimidine than benzene and borazine. Coincidentally, the four H s orbital group have the same symmetry to form the overall MO and yielded MO different from benzene and borazine.
Thus, from this MO example, it exhibited that by changing the symmetry of a molecule with different atoms, it would consequent to different symmetry orbitals and thus different MOs of a molecule. For benzene and borazine, they are quite similar in symmetry thus have the same contribution or orbitals in LCAO. However, in boratazine and pyrimidine, the symmetry significantly was lost and thus have a slight different interaction.
Discussion of energy and ordering of the MOs.
In terms of the ordering, the trend is similar. Boratazine MO is always high up in energy with the pyrimidine being at the lowest in energy. Yet, there was a slight difference in the ordering in benzene and boratazine. Benzene in this case has a slightly lower MO energy than borazine. This change in the ordering compared to the previous examples was due to the fact that these MOs have quite significant antibonding character, having six nodes in the whole system. As in general, the antibonding would have a higher rise in energy than the corresponding drop in energy of bonding orbitals. In this case, the borazine AOs interact quite strong with each other due to slight distortion to the planar ring and allow more sigma overlap. Thus would result in higher antibonding character and thus become higher in energy than of benzene.
Comparison of bond lengths and bond angles of boratabenzene, benzene, and pyrimidium.
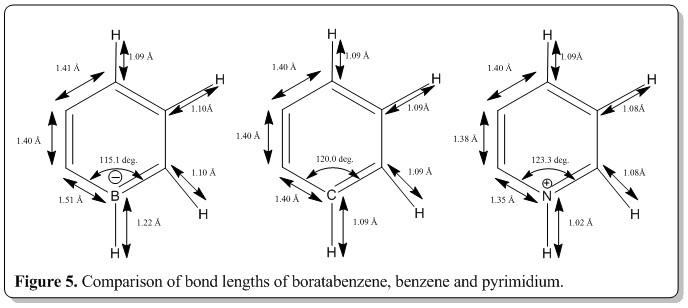
To ease the discussion, the atom at position 1 is given as symbol X, where X=boron, carbon or nitrogen.
From Figure 5, the C-X-C bond length increases, from (X = boron) to (X = carbon) then lastly (X = nitrogen). This was because of the increase in the electron density around the atom X due to the increasing electronegativity effect of atom X when going from left to right of the series. This would then favor the distortion and accept the strain to be in larger bond angle. Also, from going from boron to nitrogen, there's a increase in a proton number which resulted in the side with the larger atom to exist in a larger bond angle configuration to accommodate the increase in nucleus size of the atom. The other bond angles were about 120 deg. and the only structure with equal bond angles throughout the ring was benzene as all the atoms are the same in the ring.
Also, from Figure 5, the X-H bond lengths and X-C bond lengths decrease from (X= boron) to (X= carbon) then to (X= nitrogen). This is an indication of strengthening of the bonds by substitution of more electronegative atom for atom X. This was reflected as well in the MO energy diagram where the pyrimidium MOs are all in very low energies whilst the boratabenzene MOs are mostly at high in energy. Therefore, a conclusion that could be made was that pyrimidium has better delocalization of electron within the whole structure than benzene and boratabenzene. Thus, when substituted with a more electronegative atom at position X, the overall energy of the molecule would be lower because of the increase in the aromaticity, despite all
Lastly, the other bond lengths did not change much.
Conclusion
In short, the ordering of the energies of optimized structure in the series were E(boratabenzene)>E(benzene)>E(borazine)>E(pyridinium).
| Compound | Energy (a.u.) |
| Boratabenzene | -219.0205308 |
| Benzene | -232.2582138 |
| Borazine | -248.6680729 |
| Pyrimidium | -242.6845756 |
From the table above, as the computed with the same basis set and method, we could perform the comparison of the energies.
Furthermore, substitution of one of the carbon atoms in benzene with other atoms of different electronegativity would result in change of the overall energy and aromaticity. Replacing one of the carbon atoms with a less eletronegative atom would increase the overall energy and substituting with more electronegative atom would decrease the overall energy of the compound. Also, the compound would lose its highly symmetrical structure in benzene and result in distortion of the bond lengths and bond angles compared to benzene. The distortion of the electron cloud of the molecules were observed in the MOs being generated which is quite prominent. The computed values matched well, with the literature which is a good indication that the calculation was acceptable and fall within the ballpark of expected values. However, there's some values that did not make it well enough and it is suggested that better basis sets should be used to improve on the quality of the computed values.
Other than that, it was demonstrated that the borazine and benzene have almost the similar energies, especially in the MO diagrams. However, the borazine MOs are in general much more lower in energy than of benzene. This was due to the strong electronegative effect of the three nitrogen atoms in borazine, pulling its atomic orbitals down in energy. Upon forming the MOs, the energy levels would become much lower in energy as whole. From this, it could be anticipate that the aromatic character of borazine would be slightly more than of benzene and this should be verified using thermodynamic measurements of the compounds experimentally.
Besides that, from the examination of the MO diagrams, there was significant delocalization of the electron in the overall structure and it is not solely restricted to the totally bonding MO(made up of all in phase pz orbitals) that are contributing to the delocalization but other MOs too contributed to the delocalization.
Therefore, computed values are quite a good means in evaluating and examining the aromaticity of a compound.
References
- ↑ Kekule, A. Bull. SOC. Chim. Fr. 1865, 3, 98.
- ↑ Glendening, E.D., Faust, R., Streitwieser, A., Vollhardt, K.P.C., Weinhlold, F., J. Am. Chem. Soc., 1993, 115, 10952-10957.
- ↑ 3.0 3.1 Allen, F.H., Watson, D.G., Brammer, L., Orpen, A.G., Taylor, R., International Tables for Crystallography, 2006, Vol. C(9.5), 790-811.
- ↑ Hoic, D.A., Davis, W.M., fu, G.C., J. Am. Chem. Soc., 1995, 117, 8480-8481.
- ↑ Harshbarger, W., Lee, G., Porter, R.F., Bauer, S.H., J. Am. Chem. Soc., 1969, 8(8) 1683-1689.

