Rep:Mod:taarabt
Introduction
The purpose of this project is to use the input files created in Gaussview to run calculations in Gaussian. Orbitals, optimisations and vibrational frequencies are calculatd for small molecules and metal complexes. The skills learn using these molecules for calculations were put to the test a selected mini project and setting my own aim and method to complete it.
A Comment on Accuracy
There is an error associated with every value calculated by any method. For energy this error is approximately 10 kJ/mol, but the value given from the calculation is in Hartrees. If we convert 10 kJ/mol into Hartrees, the value is 0.00381, so we can say that the energy is only accurate to 2 decimal places if given in Hartrees. The dipole is accurate, also, to 2 decimal places. Frequencies tend to have a large error of about 10%, which is due to harmonic approximation being used when in reality, the vibrations are aharmonic. Intensity are generally rounded to the nearest integer. Bond angles are accurate to 0.1° and bond lengths are accurate to 0.01 Å. Value have been consistently recorded to the same accuracy (unless been specified otherwise).
BH3
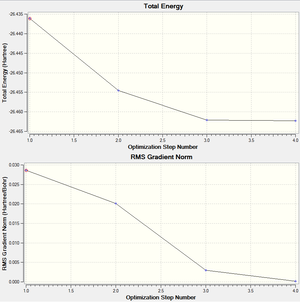
A BH3 molecule was created in Gaussview and was optimised using the method B3LYP with the basis set 3-21G. The output file produced is a text file and contains all the information calculated, such as position of the atoms, energy, etc. The final energy is in given atomic units (Hartrees) which can be converted to kcal/mol. The final energy of BH3 was -26.46 Hartrees. The gradient is the gradient of the total energy graph, when this value is close to zero the optimisation is complete. Ideally, the value should be below 0.001 and from looking at the graphs on the right, we can see that it is 0.00016. The dipole and point group is also given, it was 0.002 Debyes and C2V for this molecule.
Bonds are added on Gaussview based on the distance between atoms. If I could do this differently, I would base the addition of bonds on the stability gained by forming the bond, using an Molecular Orbital diagram.
When optimising a structure, the method solves the Schrödinger equation for energy and gets a value E(R), where R is the position of the atoms. When we slightly change the position, a different value for energy is obtained E'(R'). The method will continually change the position of the atoms in the direction where the energy decreases until a minimum is reached. This is essentially following a potential energy surface. The positions tested for the previous optimisation are shown in the graphs on the right. For the purposes of the optimisation, one of the B-H bonds was extended to allow for a visible change in energy when the molecule was optimised.
| BH3: Optimised | |||
|
Molecular Orbitals
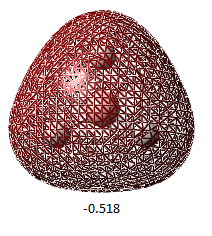
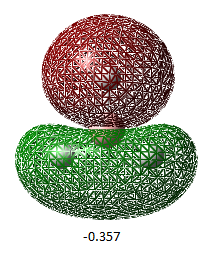
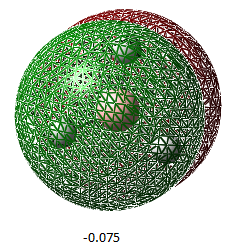
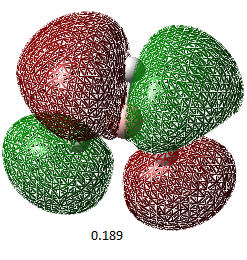
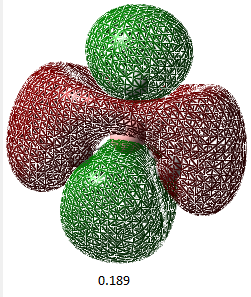
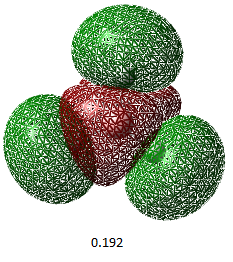
Images of the orbitals can be calculated by changing the job type to energy and under the NBO tab select full NBO's. Also, in the additional key words bar, 'pop=full' should be added. The molecular orbitals calculated were compared to the MO diagram.

| Orbital Number | 1 | 2 | 3 | 4 | 5 | 6 | 7 | 8 |
| MO image(energy/ Hartrees) | 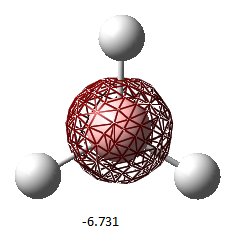 |
 |
 |
 |
 |
 |
 |
|
| Corresponding LCAO | 1a1' | 2a1' | 1e'(left) | 1e'(right) | a2 | 2e'(left) | 2e'(right) | 3a' |

The LCAO representations matches the real orbitals for the most part. Orbital 7 doesn't match completely at first glance but when looked at closely, there are some similarities. This suggests that there is some drawbacks of MO theory but is still a good representation of orbitals.
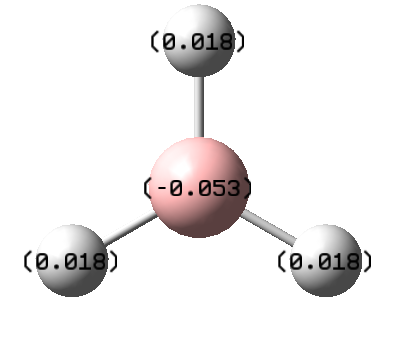
We can also show the charge distribution. The image on the right shows the charge distribution qualitatively, and the picture below shows the charge distribution numerically. The hydrogens have high electron density compared to the boron atom. This is because boron is less electronegative than hydrogen, so by comparison hydrogen is more electronegative so has more of the electron density on it.
Vibrational Frequency
Vibrational analysis confirms whether the minimum calculated actually is a minimum and not a maximum. The first derivative of a slope does not tell us if we are at a maximum or minimum, the second derivative tells us that. If the second derivative is a positive value, we have a minimum and if the second derivative is negative we have a maximum. A frequency analysis is in essence the second derivative of the potential energy surface. If the analysis produces all positive values, we have found a minimum. If there is one negative value and the rest positive, a transition state has been found and if all the values are negative, a maximum has been found and the optimisation was not successful and should be attempted again.
| Filename | tlbr3 opt |
| File Type | .log |
| Calculation Type | FOPT |
| Calculation Method | RB3LYP |
| Basis Set | LANL2DZ |
| Charge | 0 |
| Spin | Singlet |
| E(RB3LYP) | -91.21812851 a.u. |
| RMS Gradient Norm | 0.00000090 a.u. |
| Imaginary Freq | |
| Dipole Moment | 0.0000 Debye |
| Point Group | D3H |
| Job cpu time | 0 days 0 hours 2 minutes 38.0 seconds |
Media:DANIELMORGAN_BH3_FREQ.LOG
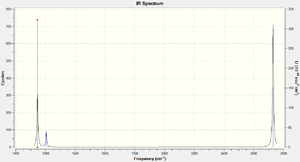
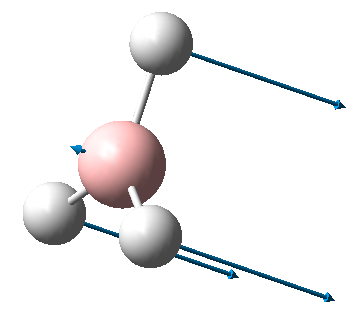
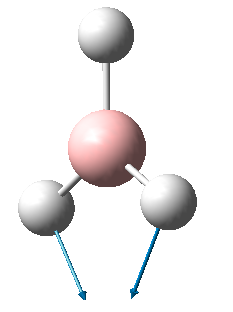
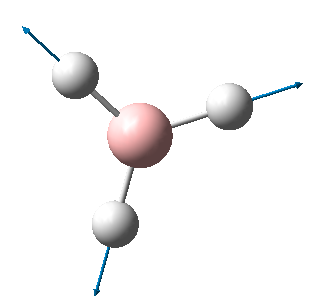
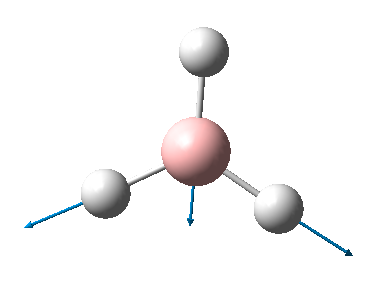
BH3 is a non-linear molecule, so we use the 3N-6 rule to calculate how many vibrational frequencies there should be. In this case N=4 so the total number of frequencies should be 6, which is true. However, there are 2 sets of degenerate vibrational frequencies so the IR spectrum only shows 4 peaks, but one peak has a negligible intensity so only 3 peaks are clearly visible.
TlBr3 and Pseudo Potentials
Thallium has 81 electrons and bromine has 35 electrons, this is too large for the Schrödinger equation calculate. Instead, pseudo potential function is used, which have been used for a long time and does produce accurate results. As we are using elements with atomic number greater than the second row, a larger basis set is needed to describe the electronic structure accurately. before running the optimisation, the point group was fixed as D3h and a very tight tolerance was set. The optimisation was ran using the B3LYP method but a different basis set was used. The basis set used was LanL2DZ, which uses the D95V basis set on first row atoms and the Los Alamos ECP basis set on heavier ones, since there is noe D95V basis set for the heavier atoms. These basis sets are considered to be of medium level complexity.
Here is a summary of the results:
| Filename | tlbr3 opt |
| File Type | .log |
| Calculation Type | FOPT |
| Calculation Method | RB3LYP |
| Basis Set | LANL2DZ |
| Charge | 0 |
| Spin | Singlet |
| E(RB3LYP) | -91.21812851 a.u. |
| RMS Gradient Norm | 0.00000090 a.u. |
| Imaginary Freq | |
| Dipole Moment | 0.0000 Debye |
| Point Group | D3H |
| Job cpu time | 0 days 0 hours 2 minutes 38.0 seconds |
Link to files: Media:TLBR3_OPT.LOG and Media:DANIELMORGAN_TLBR3_FREQ.LOG
| Tl-Br bond distance | Br-Tl-Br bond angle |
|---|---|
| 2.65 Å | 120.0 o |
The same method and basis set that was used to calculate the optimisation frequency was also used to calculate the frequency so that they can be compared. A frequency analysis is fundamentally the second derivative of the potential energy curve. The optimised structure should be at the bottom of this curve, hence the frequency values should all be positive if the molecule has been optimised to the ground state. If there are multiple negative values then the optimisation has not been successful and that a transition state has been found instead.
There are two lines in the output file called ‘Low Frequencies’. These values come from the movement of the centre of mass and are close to zero or positive. The lowest real mode here is 46.43, confirming that a ground state was found and not a transition state. The literature value for Th-Br bond length is 2.41 Å [1], which is shorter than the calculated value. However, both values are of similar size so it can be concluded that the optimisation was successful. Gaussview does not always draw bonds in the expected position, this is due to the fact that Gaussview draws bonds on the principle that the nuclei must be close enough to form a bond, i.e. it adds bonds based on distance. The reason why some bonds do not appear is because the atoms are not close enough to forma a bond. This, of course, is to Gaussview’s discretion. This doesn’t necessarily mean the bond isn’t there, just that Gaussview doesn’t deem it necessary to draw it.
A chemical bond is formed by the attraction of two atoms due to an electromagnetic force. The electromagnetic force originates from the attraction of two opposite charges, such as electrons and nuclei. The strength of the bond varies massively, depending on the type of bond formed. The bond formed results in a more stable configuration of the atoms than if there was no bond present.
Isomers of Mo(CO)4L2
In the laboratory, Mo(CO)4L2 where L=PPh3 was prepared. There are two possible isomer, cis or tran, and can be differentiated by different vibrational frequencies of the CO ligand. The cis conformer is expected to have 4 peaks for the CO ligands and the trans conformer only has 1 peak. This is because in the trans complex, all the CO ligands are equivalent but in the cis complex they are not.
To optimise Mo(CO)4L2 correctly, there are three stages that must be carried out. To start, both isomers were optimised using the B3LYP method with LANL2MB, a low level basis set. The optimisation was set to ‘loose’ to speed up the calculation process as there is more manipulating after this is complete. Once completed, the P-Cl bonds disappeared, this isn’t because they no longer exist, just that Gaussview hasn’t drawn them in because the bond length maybe long and Gaussview is more designed for organic than inorganic compounds so may not have the required information in its database. There are likely multiple minima from different orientations of the PCl3 ligands. The next step is to rotate the Mo-P bond to produce different dihedral angles and find the minimum energy. It is already believed that for the cis conformer, the dihedral angle of Cl-P-Mo-C should be 0° for one of the PCl3 liugands and 180° for the other. The trans conformer should have both PCl3 ligands eclipsed (i.e. the P-Cl bonds overlap/have a dihedral angle of 0°). Now the final optimisation can be run. The same method was used but with the LANL2DZ basis set and ‘int=ultrafine scf=conver=9’ put in the additional keywords bar.
However, this is not the end of the optimisation, it can be improved further. Phosphorus prefers to be hypervalent and utilise its low lying d-atomic orbitals, and using the LANL2DZ basis-set only allows the minimal basis set, i.e. s- and p- orbitals . Adding ‘extrabasis’ to the additional key words bar (as well as ‘int=ultrafine scf=conver=9’) allows the calculation to utlise the d orbitals of phosphorus. Before submitting the job to be calculated, open the input file and add:
(blank line)
P 0
D 1 1.0
0.55 0.100D+01
****
(blank line)
This gives the information about the d orbital for the calculation to work correctly.
Output files: Cis-OptimisationDOI:10042/to-5925 and Trans-Optimisation DOI:10042/to-5923
| Cis-Mo(CO)4(PCl32): Optimised | Trans-Mo(CO)4(PCl3)2: Optimised | ||||||
|
|
| Bond | Cis- Complex: Calcualted/ Angstroms | Cis- Complex: Literature [2]/ Angstroms | Trans- Complex: Calcualted/ Angstroms | Trans- Complex: Literature [3]/ Angstroms |
| Mo-P | 2.48 | 2.58 | 2.42 | 2.50 |
| Mo-C: axial | 2.05 | 2.02/2.06 | 2.06 | 2.01 |
| Mo-C: equatorial | 2.02 | 1.97 | 2.06 | 2.01 |
| P-Mo-P angle | 94.29 | 104.62° | N/A |
The bond lengths are all close to the literature values, which shows the calculation was pretty accurate. There is a minor discrepancy in the P-Mo-P angle of 10 degrees, but the values are reasonably close.
The cis-complex produced a calculated energy of -623.6929 Hartrees (-1637505.834 kJ/mol) and the trans-complex had an energy of -623.6942 Hartrees (-1637509.247 kJ/mol) with a difference of 0.0013 Hartrees (3.413 kJ/mol). There is an error of approx. 10 kJ/mol after 2 decimal places so this difference could be put down to this calculation error. The literature value for the difference is -72.98 kJ/mol [4], however, the literature had PPh3 ligands instead of PCl3 which accounts for the large difference from the calculated value. Also, the literature gives the Trans-complex as the more stable. PPh3 is much more bulky than PCl3 and in a cis-complex they would sterically clash making it less stable than the trans-complex.
Frequency Analysis
Output files: Cis-Frequency DOI:10042/to-6081 and Tran-Frequency DOI:10042/to-6082
The vibration frequceny analysis was carried out with the same basis set, method and advanced keywords as above. There are two vibrations with low frequency associated with both complexes. At room temperature these would occur due to the low energy barrier to these vibrations.
| Vibration Number/Complex | Image of Vibration | Frequency/(cm-1) |
| 1/Cis | 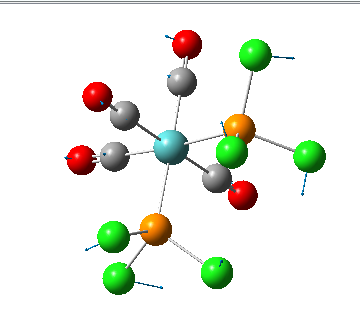 |
11.73 |
| 2/Cis |  |
20.28 |
| 1/Trans | 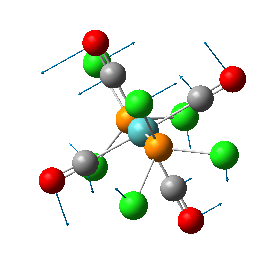 |
4.44 |
| 2/Trans | 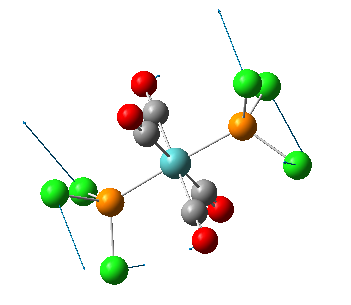 |
6.96 |
| Bond | Cis- Complex: Calcualted/(cm-1) | Cis- Complex: Literature/(cm-1)[4] | Trans- Complex: Calcualted/(cm-1) | Trans- Complex: Literature/(cm-1) [4] |
| C=O | 2019/1952/1941/1938 | 2018/1911/1898/1872 | 2025/1966/1940/1939 | 1886 |
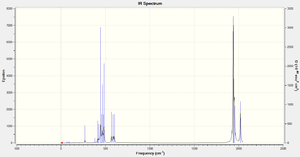
For the cis-complex, the calculated values match the prediction in the number of peaks but are of higher frequency than the literature. Obviously, there is an error associated with the calculation and this will compensate for part of the difference but also the method may not consider back-bonding from the C=O ligands as this ligand is a good π acceptor. This would result in a more rigid bond, so the vibrational frequency would be lower.
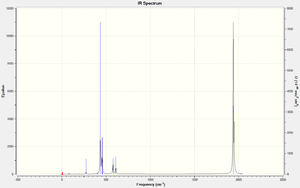
The trans-complex is more interesting. 4 vibrational frequencies are reported from the calculation and not 1. However, the 2025 and 1966 peaks have an extremely small intensity and are negligible. The other two peaks are extremely close in frequency and merge into one peak. This is due to the symmetry of the complex making the vibrations degenerate.
| Vibration Number | Diagram | Frequency/(cm-1) | Intensity |
| 42 | 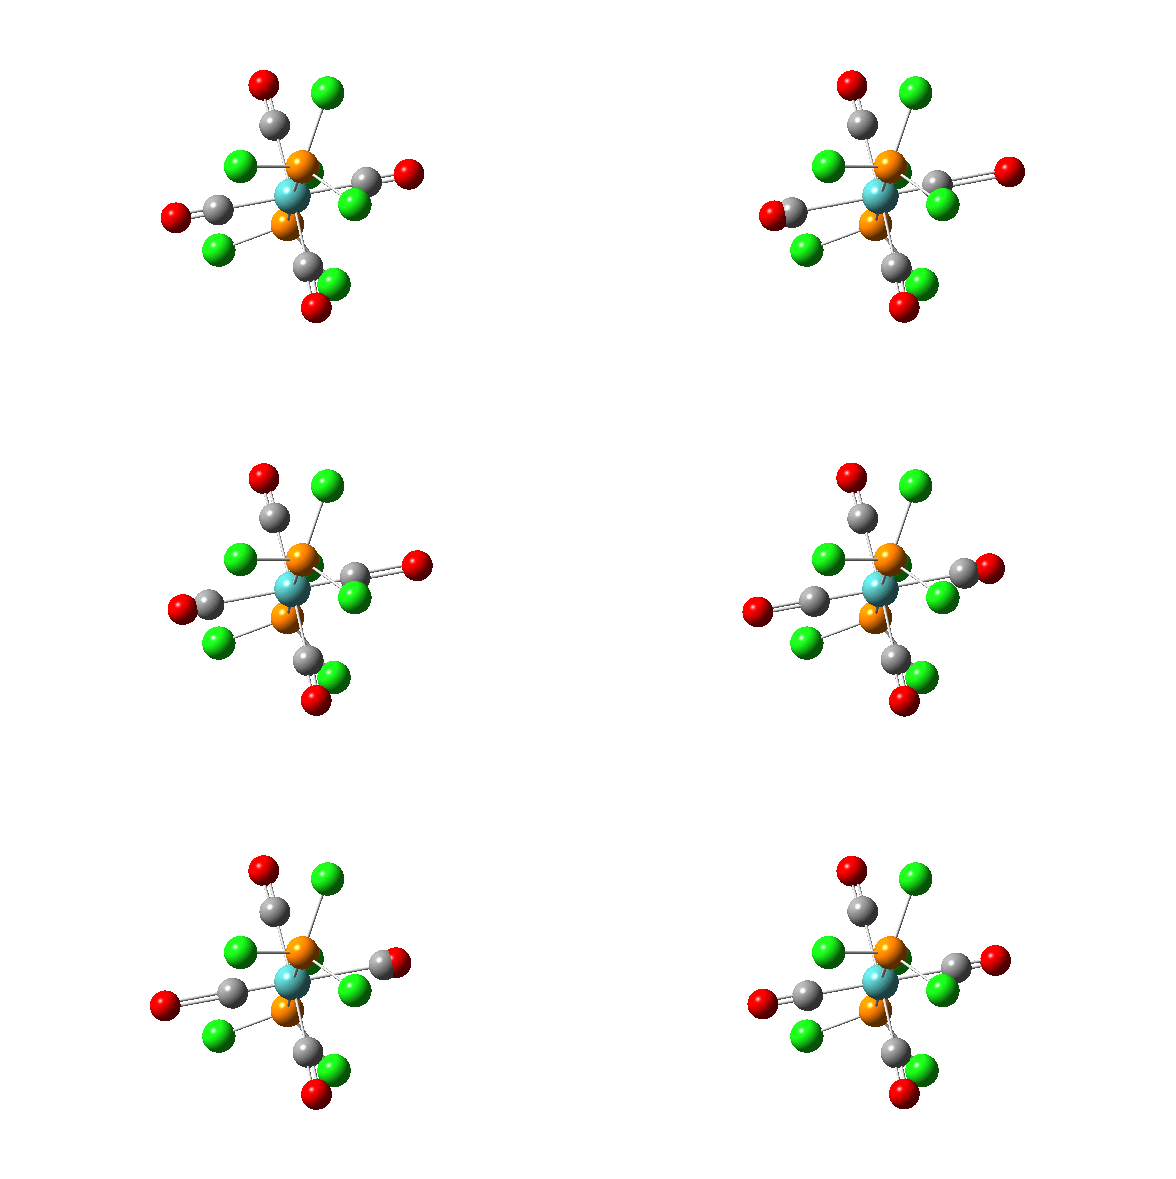 |
1939.19 | 1605.60 |
| 43 | 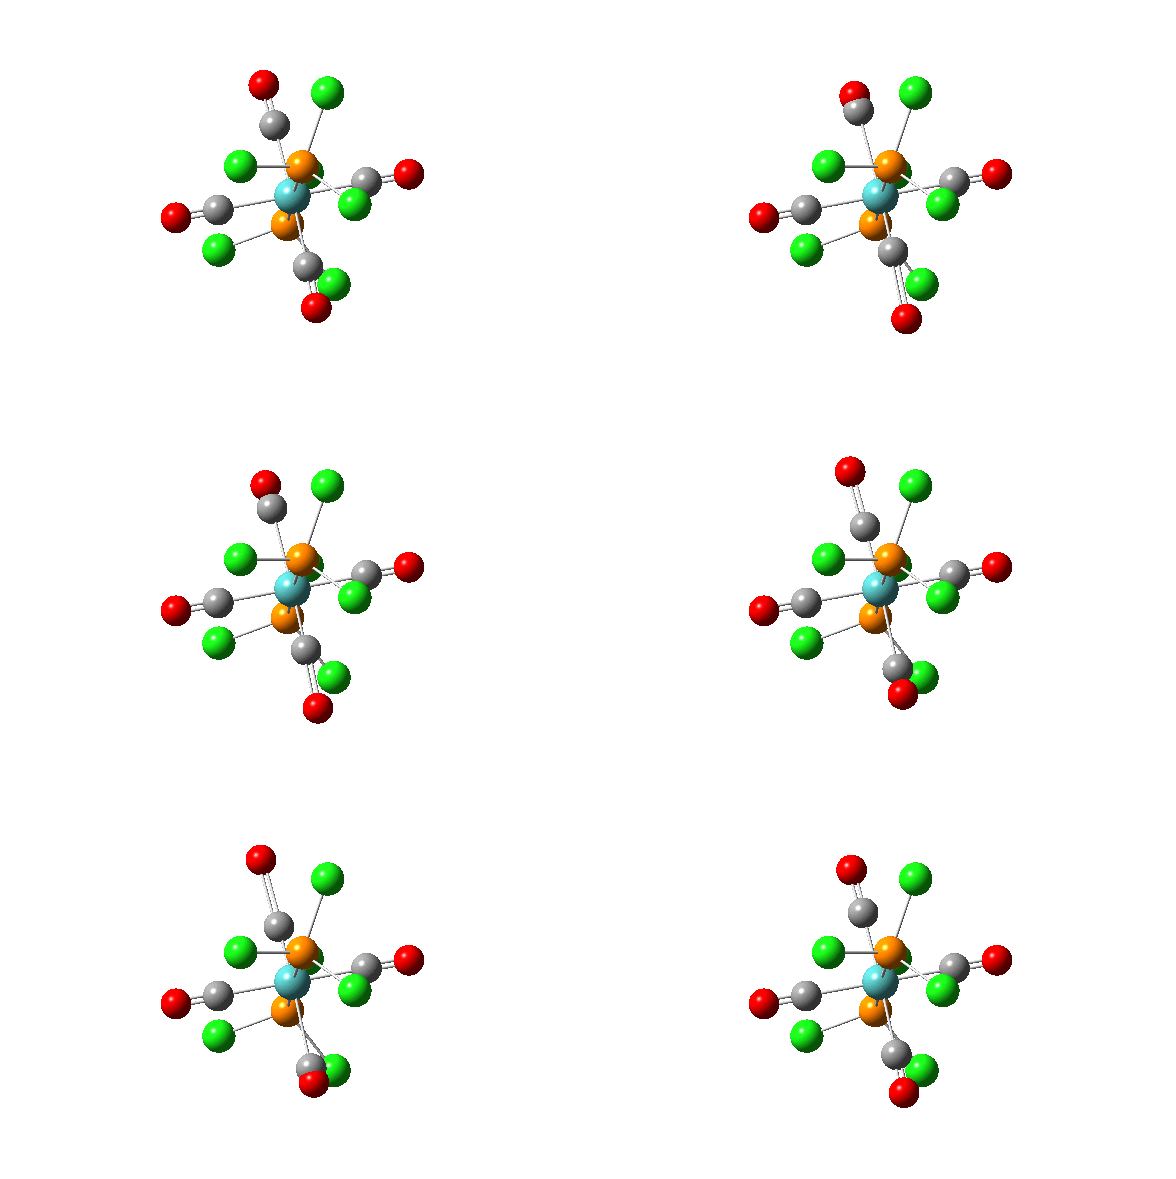 |
1939.90 | 1605.99 |
| 44 |  |
1966.85 | 5.91 |
| 45 |  |
2025.50 | 5.37 |
From the diagrams above, we can see that due to the high symmetry of the complex, the vibrations of the peaks with low intensity practically cancel each other out leading to a low intensity, hence there is only 1 visible peak on the spectrum.
Mini Project
Introduction
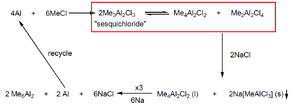
For my Mini-Project, I have selected to study the equilibrium show to the right which was taken from last years lecture notes. This reaction is part of the industrial process to make Al2Me6 and the equilibrium is a key part of the reaction. There is a step in the process which pushes the equilibrium to the favoured side of the equilibrium we want. What I want to investigate is where this equilibrium naturally lies at a range of temperatures. The optimisation with Gaussian is at 0K. Using the energies obtained from optimisation, it is possible to calculate the energy at higher temperatures by using statistical thermodynamics, more specifically, the internal energy formula obtained from partition functions. The electronic contribution is the value obtained from the optimisation, the rotational and translational contribution is facile and is obtained from the following equations:
Utrans = 3/2*kb*T
Urot = 3/2*R*T/NA
The vibrational contribution is more complex and requires a vibrational frequency analysis to get a result:
Uvib = Σ (h*w)/(exp(h*w/kb*T)–1) w is the vibrational frequency obtained from the vibrational analysis.
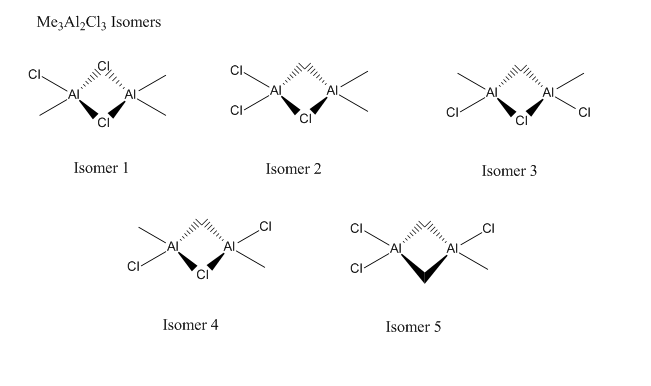
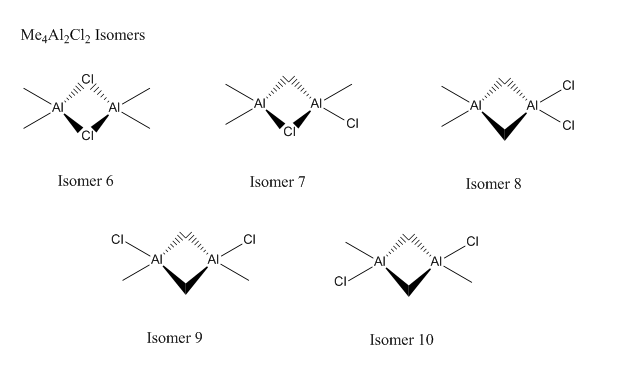
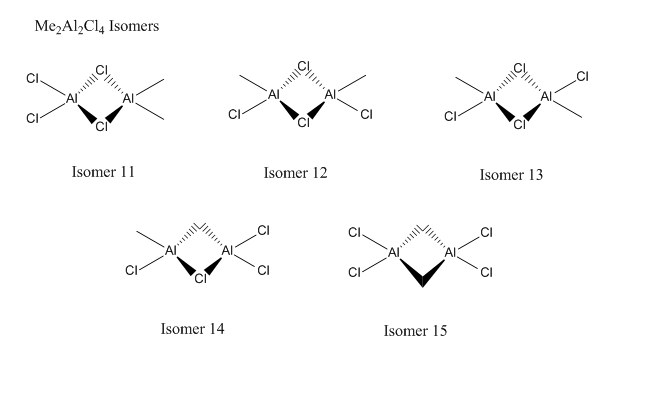
There are many isomers for each of the reactants and products, so firstly I will find the lowest energy isomer for each molecule.
The aim of this calculation is to see if the stability of the isomers change as temperature increases and a comparison of the most stable isomers to see if the equilibrium changes.
Optimisation
All the isomers were draw in ChemBio3D and then converted to Gaussview format. The optimisation was run with the following settings:
Method: B3LYP
Basis set: LANL2DZ
Additional keywords: int=ultrafine scf=conver=9
The reason the LANL2DZ basis set was chosen is because Al and Cl are not in the first two rows of elements and this basis set has the correct information to carry out this optimisation.
When viewing the results, some isomers were completely rearranged suggesting that the original isomer submitted was not stable. It is possible to fix the symmetry and try the calculation, but this would be a waste of time as the isomer would clearly not be the most stable compared to the other isomers.
| Isomer | Electronic Energy/J |
|---|---|
| Isomer 1 | -7.36007E-16 |
| Isomer 2 | -7.33038E-16 |
| Isomer 3 | -7.33065E-16 |
| Isomer 4 | -7.33073E-16 |
| Isomer 6 | -8.44618E-16 |
| Isomer 7 | -8.41664E-16 |
| Isomer 11 | -6.27345E-16 |
| Isomer 12 | -6.27377E-16 |
| Isomer 13 | -6.27384E-16 |
| Isomer 14 | -6.24426E-16 |
More decimal places shown to see difference in values
| Isomer | Image | |||
|---|---|---|---|---|
| Isomer 1 |
| |||
| Isomer 6 |
| |||
| Isomer 13 |
|
Some Cl bonds are not shown by Gaussview
As expected, the isomers with Cl bridges are the most stable, which is down to the donation of their lone pairs into the electron deficient Al atom forming a dative bond. The frequency analysis confirmed that these molecules were all optimised and not transition states.
Statistical Thermodynamics
My next thought was to investigate the equilibrium of the isomers as temperature changed. The optimisation energy is at 0K and to find the values at different temperatures, the vibrational frequency is needed. The same method, basis-set and additional keywords were used as for the optimisation but the job was changed to frequency. The electronic, vibrational, rotational and translation energy contribution were calculated using the formulas shown earlier. The frequency values are needed to calculate the vibrational contribution to the energy.
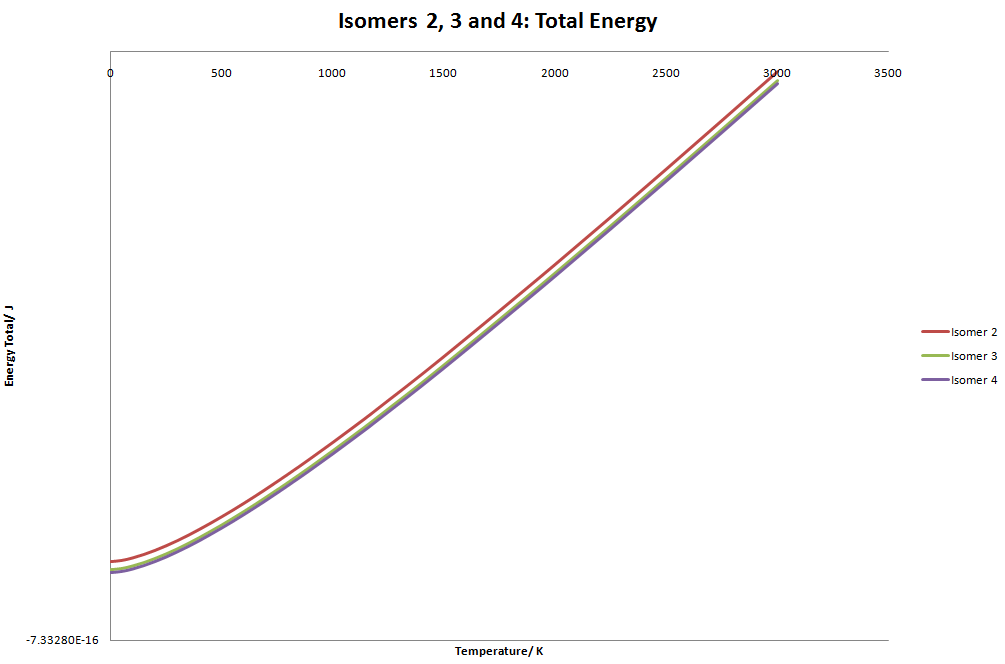
| Temperature/K | Isomer 1: Total Energy/ J | Isomer 2: Total Energy/ J | Isomer 3: Total Energy/ J | Isomer 4: Total Energy/ J |
|---|---|---|---|---|
| 0 | -7.36007E-16 | -7.33038E-16 | -7.33065E-16 | -7.33073E-16 |
| 50 | -7.36003E-16 | -7.33035E-16 | -7.33061E-16 | -7.33070E-16 |
| 100 | -7.35995E-16 | -7.33027E-16 | -7.33053E-16 | -7.33062E-16 |
| 150 | -7.35984E-16 | -7.33017E-16 | -7.33043E-16 | -7.33052E-16 |
| 200 | -7.35971E-16 | -7.33004E-16 | -7.33031E-16 | -7.33039E-16 |
| 250 | -7.35956E-16 | -7.32990E-16 | -7.33017E-16 | -7.33025E-16 |
| 300 | -7.35940E-16 | -7.32974E-16 | -7.33001E-16 | -7.33010E-16 |
| 350 | -7.35923E-16 | -7.32958E-16 | -7.32984E-16 | -7.32993E-16 |
| 400 | -7.35905E-16 | -7.32940E-16 | -7.32966E-16 | -7.32975E-16 |
| 450 | -7.35886E-16 | -7.32921E-16 | -7.32948E-16 | -7.32956E-16 |
| 500 | -7.35867E-16 | -7.32902E-16 | -7.32928E-16 | -7.32937E-16 |
| 550 | -7.35846E-16 | -7.32881E-16 | -7.32908E-16 | -7.32917E-16 |
| 600 | -7.35824E-16 | -7.32860E-16 | -7.32887E-16 | -7.32896E-16 |
| 650 | -7.35802E-16 | -7.32839E-16 | -7.32865E-16 | -7.32874E-16 |
| 700 | -7.35779E-16 | -7.32817E-16 | -7.32843E-16 | -7.32852E-16 |
| 750 | -7.35756E-16 | -7.32794E-16 | -7.32821E-16 | -7.32829E-16 |
| 800 | -7.35732E-16 | -7.32771E-16 | -7.32798E-16 | -7.32806E-16 |
| 900 | -7.35683E-16 | -7.32724E-16 | -7.32750E-16 | -7.32759E-16 |
| 1000 | -7.35632E-16 | -7.32675E-16 | -7.32701E-16 | -7.32710E-16 |
| 1100 | -7.35579E-16 | -7.32624E-16 | -7.32651E-16 | -7.32660E-16 |
| 1200 | -7.35525E-16 | -7.32573E-16 | -7.32599E-16 | -7.32608E-16 |
| 1500 | -7.35356E-16 | -7.32412E-16 | -7.32439E-16 | -7.32448E-16 |
| 2000 | -7.35059E-16 | -7.32132E-16 | -7.32158E-16 | -7.32167E-16 |
| 2500 | -7.3475E-16 | -7.31841E-16 | -7.31867E-16 | -7.31876E-16 |
| 3000 | -7.34435E-16 | -7.31544E-16 | -7.31571E-16 | -7.3158E-16 |
| 100000 | -6.71378E-16 | -6.71387E-16 |
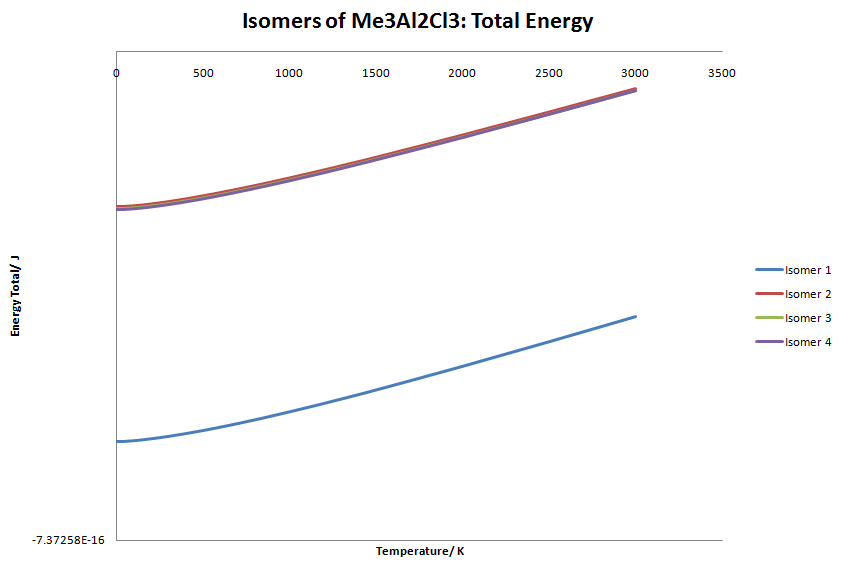
Isomer 3 and 4 seem to start to converge. However, when taken to large temperatures the graph becomes undecipherable. The graph is linear but the gradient of the graphs look as though they will eventually cross. I tested this by increasing the temperature to 100,000 K. The difference between isomer 3 and 4 is even greater than before, hence they will not cross. At low temperatures (below 200K), the graph is slightly curved, which is due to the exponential term in the the vibrational energy calculation.
I am aware than this model is inaccurate at temperatures around 1000K since electron excitation starts to occur and possible changes in structures due to overcoming of energy barriers.
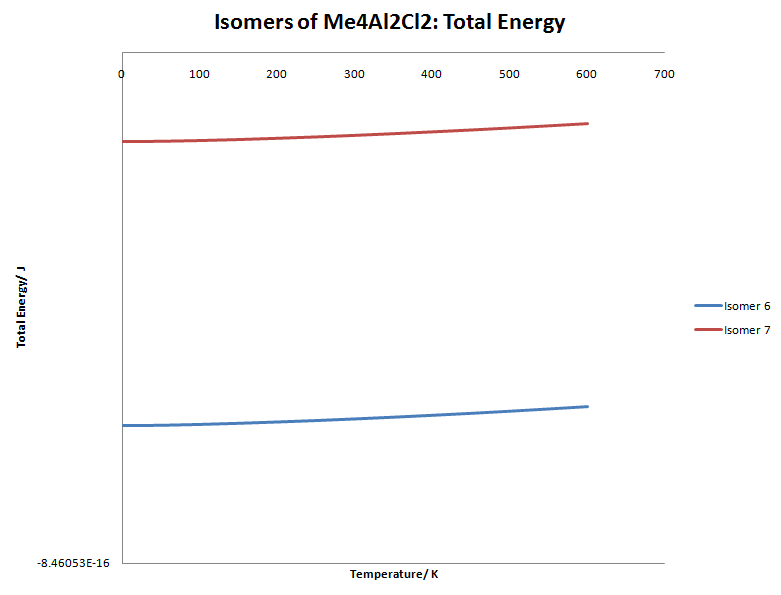
| Temperature/K | Isomer 6: Total Energy/ J | Isomer 7: Total Energy/ J |
|---|---|---|
| 0 | -8.44618E-16 | -8.41664E-16 |
| 50 | -8.44614E-16 | -8.41661E-16 |
| 100 | -8.44605E-16 | -8.41653E-16 |
| 150 | -8.44593E-16 | -8.41642E-16 |
| 200 | -8.4458E-16 | -8.41629E-16 |
| 250 | -8.44564E-16 | -8.41614E-16 |
| 300 | -8.44548E-16 | -8.41597E-16 |
| 350 | -8.44529E-16 | -8.41579E-16 |
| 400 | -8.4451E-16 | -8.41559E-16 |
| 450 | -8.44489E-16 | -8.41539E-16 |
| 500 | -8.44467E-16 | -8.41517E-16 |
| 550 | -8.44444E-16 | -8.41495E-16 |
| 600 | -8.4442E-16 | -8.41471E-16 |
This graph is fairly uninteresting as both isomers are far apart in energy and the gradient is much shallower. However, a very important point is made. Isomer 6 has 2 Cl atoms bridging and isomer 7 only has one Cl atom and a methyl group. The graph nicely shows us that Cl bridging is favoured over methyl bridging, but this is a trivial fact.
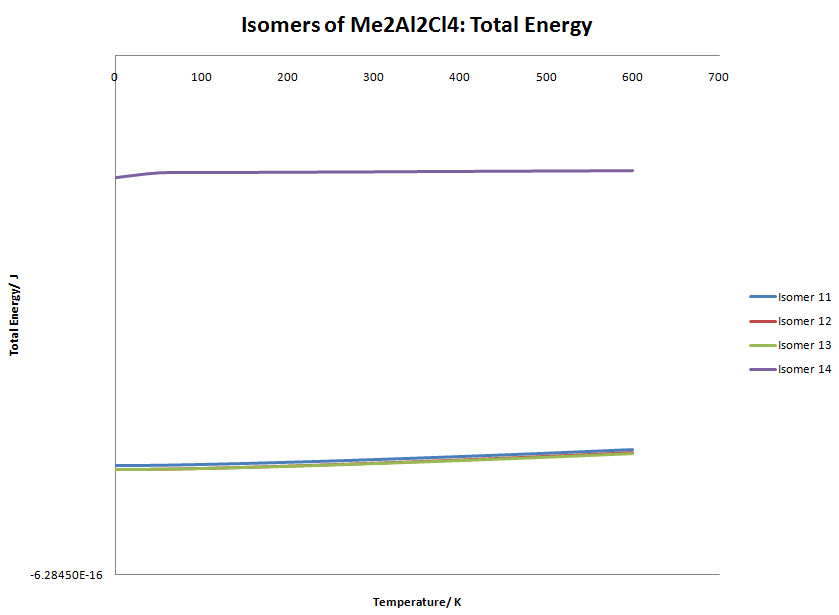
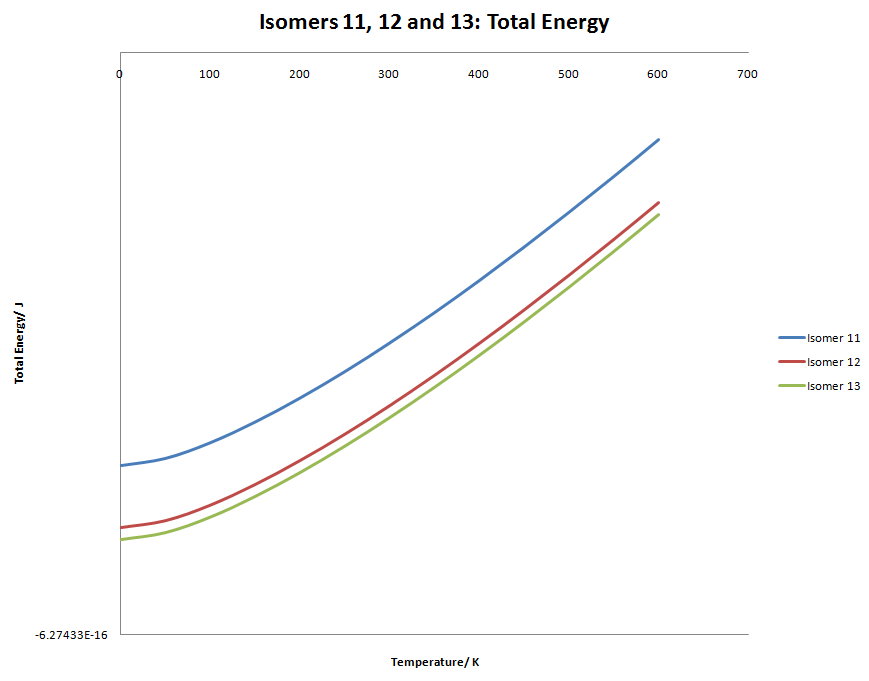
| Temperature/K | Isomer 11: Total Energy/ J | Isomer 12: Total Energy/ J | Isomer 13: Total Energy/ J | Isomer 14: Total Energy/ J |
|---|---|---|---|---|
| 0 | -6.27345E-16 | -6.27377E-16 | -6.27384E-16 | -6.24426E-16 |
| 50 | -6.27342E-16 | -6.27374E-16 | -6.27380E-16 | -6.24376E-16 |
| 100 | -6.27334E-16 | -6.27366E-16 | -6.27372E-16 | -6.24374E-16 |
| 150 | -6.27323E-16 | -6.27355E-16 | -6.27361E-16 | -6.24372E-16 |
| 200 | -6.27311E-16 | -6.27343E-16 | -6.27349E-16 | -6.24370E-16 |
| 250 | -6.27297E-16 | -6.27329E-16 | -6.27335E-16 | -6.24368E-16 |
| 300 | -6.27282E-16 | -6.27315E-16 | -6.27321E-16 | -6.24365E-16 |
| 350 | -6.27267E-16 | -6.27299E-16 | -6.27305E-16 | -6.24363E-16 |
| 400 | -6.27250E-16 | -6.27283E-16 | -6.27289E-16 | -6.24361E-16 |
| 450 | -6.27233E-16 | -6.27265E-16 | -6.27272E-16 | -6.24359E-16 |
| 500 | -6.27215E-16 | -6.27248E-16 | -6.27254E-16 | -6.24357E-16 |
| 550 | -6.27197E-16 | -6.27229E-16 | -6.27235E-16 | -6.24355E-16 |
| 600 | -6.27178E-16 | -6.27210E-16 | -6.27216E-16 | -6.24353E-16 |
| 10000 | -6.22291E-16 | -6.22325E-16 | -6.22331E-16 |
Again, these graphs are very similar to the Isomer 2, 3 and 4 graph. Even when taking the temperature to the extreme, isomer 12 and 13 energy doesn't cross.
Equilibrium
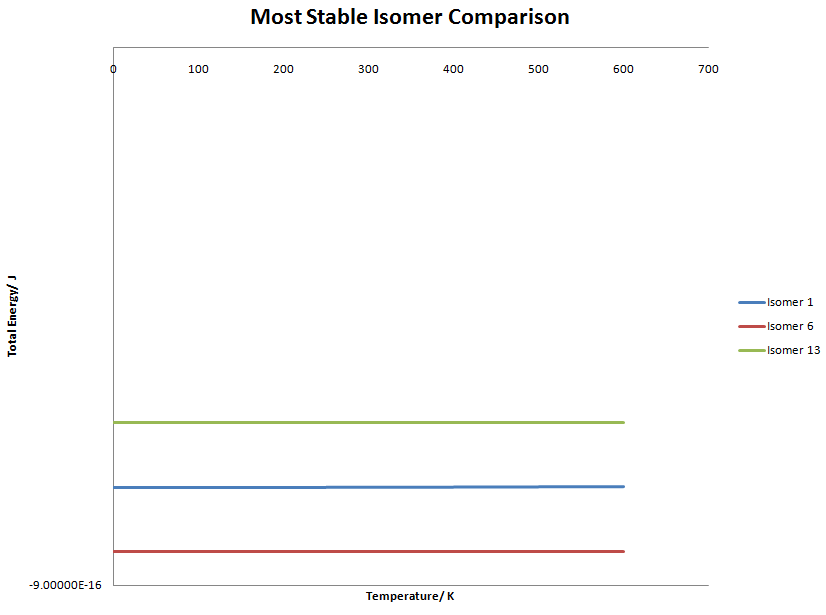
The most stable isomer of each molecule was compared to see how the equilibrium would change when just considering temperature.
Isomer 1 ↔ Isomer 6 and 13
| Temperature/K | Isomer 1: Total Energy/ J | Isomer 6: Total Energy/ J | Isomer 13: Total Energy/ J |
|---|---|---|---|
| 0 | -7.36007E-16 | -8.44618E-16 | -6.27384E-16 |
| 50 | -7.36003E-16 | -8.44614E-16 | -6.27380E-16 |
| 100 | -7.35995E-16 | -8.44605E-16 | -6.27372E-16 |
| 150 | -7.35984E-16 | -8.44593E-16 | -6.27361E-16 |
| 200 | -7.35971E-16 | -8.4458E-16 | -6.27349E-16 |
| 250 | -7.35956E-16 | -8.44564E-16 | -6.27335E-16 |
| 300 | -7.35940E-16 | -8.44548E-16 | -6.27321E-16 |
| 350 | -7.35923E-16 | -8.44529E-16 | -6.27305E-16 |
| 400 | -7.35905E-16 | -8.4451E-16 | -6.27289E-16 |
| 450 | -7.35886E-16 | -8.44489E-16 | -6.27272E-16 |
| 500 | -7.35867E-16 | -8.44467E-16 | -6.27254E-16 |
| 550 | -7.35846E-16 | -8.44444E-16 | -6.27235E-16 |
| 600 | -7.35824E-16 | -8.4442E-16 | -6.27216E-16 |
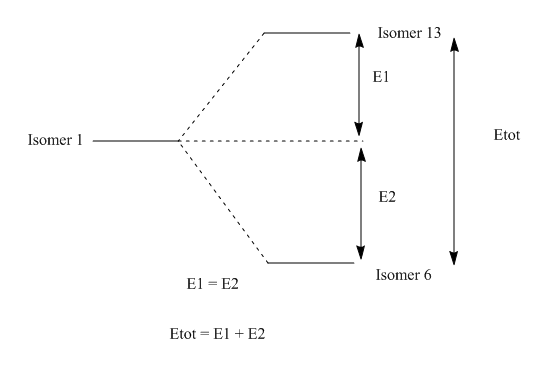
The graph is unimpressive and shows that the equilibrium does not change, hence is independent of temperature. However, if we look at the difference between the lines something quite interesting is observed.
| Difference | Isomer 1-6 | Isomer 13-1 | Isomer 13-6 | Sum of isomer 1-6 and Isomer 13-1 |
|---|---|---|---|---|
| 0 | 1.08611E-16 | 1.08623E-16 | 2.17234E-16 | 2.17234E-16 |
| 300 | 1.08607E-16 | 1.08620E-16 | 2.17227E-16 | 2.17227E-16 |
| 600 | 1.08595E-16 | 1.08608E-16 | 2.17203E-16 | 2.17203E-16 |
The difference in energy between the isomers are the same. Isomer 6 is stabilised by the same amount Isomer 13 is destabilised, which suggests that the equilibrium constant 1 when only considering temperature.
Conclusion
Overall, the mini project did not show what I would have liked but it did confirm some facts and reveal others. The isomer stabilities did not cross over as temperature increased but did confirm that Cl bridging is preferred over methyl bridges. The equilibrium constant of this reaction is 1 when only considering temperature. A further experiment that I would have liked to do would be to add different solvents into the calculation and see who they affect the equilibrium.
References
- ↑ Johan Blixt, Julius Glaser, Janos Mink, Ingmar Persson, Per Persson, Magnus Sandstroem J. Am. Chem. Soc., 1995, 117 (18), pp 5089–5104 DOI: 10.1021/ja00123a011
- ↑ J"Steric contributions to the solid-state structures of bis(phosphine) derivatives of molybdenum carbonyl. X-ray structural studies of cis-Mo(CO)4[PPh3-nMen]2 (n = 0, 1, 2)", F. Albert Cotton, Donald J. Darensbourg, Simonetta Klein, and Brian W. S. Kolthammer, Inorg. Chem., 21, (1982), p294-299
- ↑ Graeme Hogarth and Tim Norman, Inorganica Chimica Acta, Volume 254, Issue 1, 1 January 1997, Pages 167-171 doi:10.1016/S0020-1693(96)05133-X
- ↑ 4.0 4.1 4.2 Dennis W. Bennett, Tasneem A. Siddiquee, Daniel T. Haworth, Shariff E. Kabir and Farzana K. Camellia, Journal of Chemical Crystallography, Volume 34, Number 6, 353-359, DOI: 10.1023/B:JOCC.0000028667.12964.28 Cite error: Invalid
<ref>tag; name "colit" defined multiple times with different content

