Rep:Mod:syq1234
Inorganic Computational Chemistry Lab
Day 1
Optimising a Molecule of BH3
Method
A BH3 molecule was created by GaussView 5.0. The bond length of the three B-H bonds were set to 1.53 angstrom, 1.54 angstrom, 1.55 angstrom separately. The BH3 molecule was optimized using the method: B3LYP and the basis set: 3-21G.
Results
The information of calculation is summarized in the picture. 1.
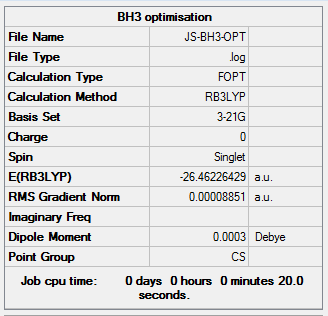
The "Item" table which includes converged forces and distances is displayed below. And It shows that the calculation was finished.
        Item               Value     Threshold  Converged?
Maximum Force            0.000220     0.000450     YES
RMS     Force            0.000106     0.000300     YES
Maximum Displacement     0.000919     0.001800     YES
RMS     Displacement     0.000447     0.001200     YES
Predicted change in Energy=-1.672480D-07
Optimization completed.
   -- Stationary point found.
                          ----------------------------
                          !   Optimized Parameters   !
                          ! (Angstroms and Degrees)  !
--------------------------                            --------------------------
! Name  Definition              Value          Derivative Info.                !
--------------------------------------------------------------------------------
! R1    R(1,2)                  1.1944         -DE/DX =   -0.0001              !
! R2    R(1,3)                  1.1947         -DE/DX =   -0.0002              !
! R3    R(1,4)                  1.1948         -DE/DX =   -0.0002              !
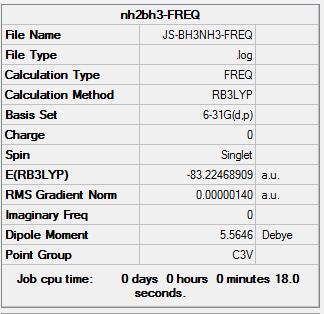
! A1    A(2,1,3)              119.9983         -DE/DX =    0.0                 !
! A2    A(2,1,4)              119.986          -DE/DX =    0.0                 !
! A3    A(3,1,4)              120.0157         -DE/DX =    0.0                 !
! D1    D(2,1,4,3)            180.0            -DE/DX =    0.0                 !
--------------------------------------------------------------------------------
GradGradGradGradGradGradGradGradGradGradGradGradGradGradGradGradGradGrad
The original output Log. file could be check through the link Optimisation
 |
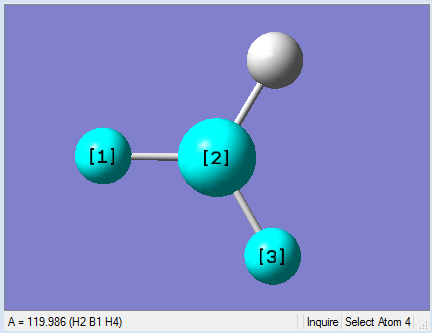 |
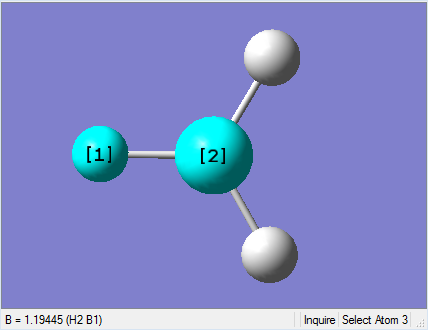
As present in Picture. 2 and Picture. 3, the B-H bond after optimize is 1.19 Å and H-B-H angel is 120 degree.
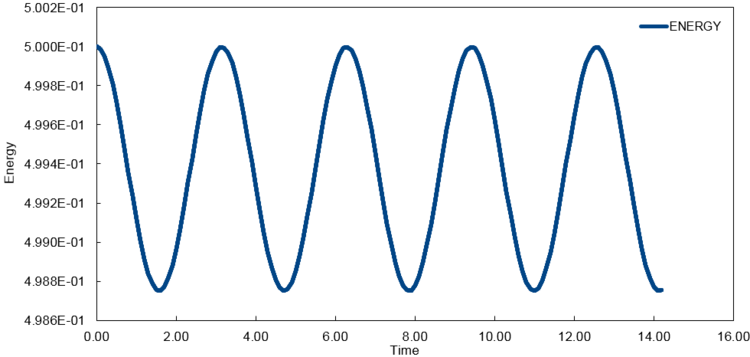
The energy of each optimization step is displayed in Picture. 4.
Day 2
Using a better basis set
Method
A a higher level basis set: 6-31G(d,p)was chose for optimization.
Results
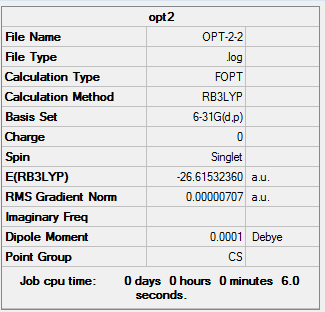
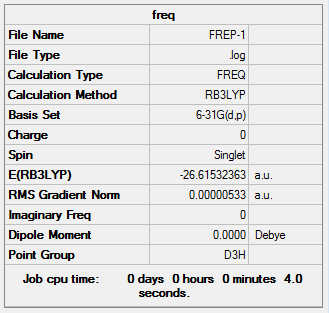
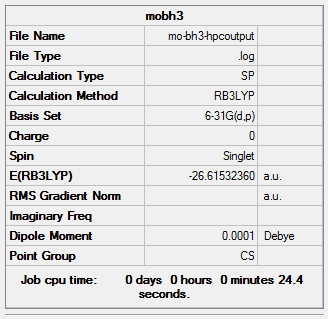
The information of calculation is summarized in the picture. 5.
The "Item" table which includes converged forces and distances is displayed below. And It shows that the calculation was finished.
        Item               Value     Threshold  Converged?
Maximum Force            0.000012     0.000450     YES
RMS     Force            0.000008     0.000300     YES
Maximum Displacement     0.000061     0.001800     YES
RMS     Displacement     0.000038     0.001200     YES
Predicted change in Energy=-1.069047D-09
Optimization completed.
   -- Stationary point found.
                          ----------------------------
                          !   Optimized Parameters   !
                          ! (Angstroms and Degrees)  !
--------------------------                            --------------------------
! Name  Definition              Value          Derivative Info.                !
--------------------------------------------------------------------------------
! R1    R(1,2)                  1.1923         -DE/DX =    0.0                 !
! R2    R(1,3)                  1.1923         -DE/DX =    0.0                 !
! R3    R(1,4)                  1.1923         -DE/DX =    0.0                 !
! A1    A(2,1,3)              120.0055         -DE/DX =    0.0                 !
! A2    A(2,1,4)              119.9938         -DE/DX =    0.0                 !
! A3    A(3,1,4)              120.0007         -DE/DX =    0.0                 !
! D1    D(2,1,4,3)            180.0            -DE/DX =    0.0                 !
--------------------------------------------------------------------------------
GradGradGradGradGradGradGradGradGradGradGradGradGradGradGradGradGradGrad
The original output Log. file could be check through the link Optimisation
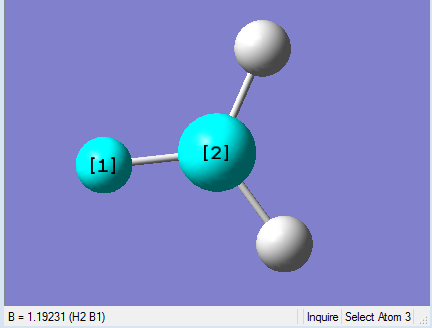 |
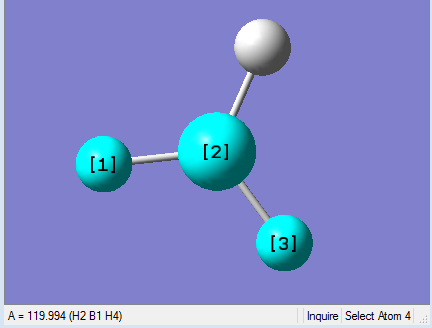 |
As present in Picture. 6 and Picture. 7, the B-H bond after optimize is 1.19 Å and H-B-H angel is 120 degree.
The total energy of 3-21G optimised structure is -26.46226429 au. The total energy of 6-31G(d,p) optimised structure is -26.61532360 au. Because two difference basis sets were chose for the optimization, the energies are not related to the stability of structures.
Using pseudo-potentials and larger basis sets
Method
A GaBr3 molecule was created. The symmetry of the molecule was restricted to D3h and the tollerance was adjusted to "Very tight (0.0001)".The GaBr3 molecule was optimized using the method: B3LYP and the basis set: LanL2DZ. The file was uploaded to HPC to run the analysis.
Results
The information of calculation is summarized in the picture. 8.
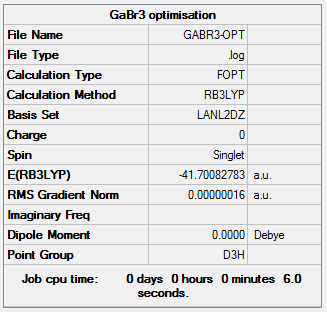
The "Item" table which includes converged forces and distances is displayed below. And It shows that the calculation was finished.
        Item               Value     Threshold  Converged?
Maximum Force            0.000000     0.000450     YES
RMS     Force            0.000000     0.000300     YES
Maximum Displacement     0.000003     0.001800     YES
RMS     Displacement     0.000002     0.001200     YES
Predicted change in Energy=-1.282679D-12
Optimization completed.
   -- Stationary point found.
                          ----------------------------
                          !   Optimized Parameters   !
                          ! (Angstroms and Degrees)  !
--------------------------                            --------------------------
! Name  Definition              Value          Derivative Info.                !
--------------------------------------------------------------------------------
! R1    R(1,2)                  2.3502         -DE/DX =    0.0                 !
! R2    R(1,3)                  2.3502         -DE/DX =    0.0                 !
! R3    R(1,4)                  2.3502         -DE/DX =    0.0                 !
! A1    A(2,1,3)              120.0            -DE/DX =    0.0                 !
! A2    A(2,1,4)              120.0            -DE/DX =    0.0                 !
! A3    A(3,1,4)              120.0            -DE/DX =    0.0                 !
! D1    D(2,1,4,3)            180.0            -DE/DX =    0.0                 !
--------------------------------------------------------------------------------
GradGradGradGradGradGradGradGradGradGradGradGradGradGradGradGradGradGrad
The HPC output Log. file could be check through the linkDOI:10042/26098
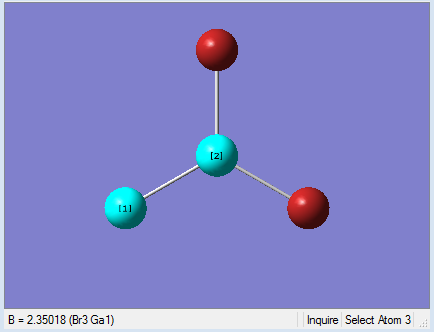 |
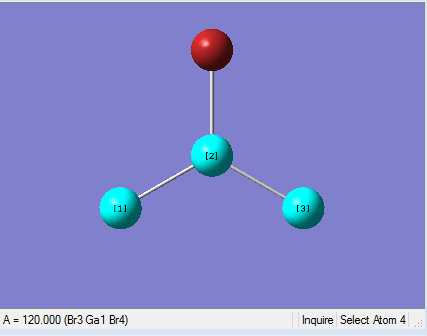 |
As present in Picture. 9 and Picture. 10, the Ga-Br bond length after optimize is 2.35 Å and Br-Ga-Br angel is 120 degree. In literature, The Ga-Br bond length of Gabr3 is 2.249 Å[1]. The optimized Ga-Br bond length is longer than the Ga-Br bond length in the literature. Because the bond length was calculated by Guassian from gaseous Gabr3. However the literature data was measured from crystal solid Gabr3 by experiment. Gabr3 molecules are packed close to each other in solid phase. So the Ga-Br bond length in solid phase is slightly shorter. Meanwhile, the optimized bond length deviates from literature may caused by the basis set chose for the calculation. The basis set was not accurate enough for the calculation. Overall, the bong length difference is 0.101 Å, which is small. It means the optimization is reliable.
Using a mixture of basis-sets and psuedo-potentials
Method
A BBr3 molecule was created. The BBr3 molecule was optimized using 6-31G(d,p) , the basis set: GEN, and the additional keywords section was "pseudo=read gfinput". Finally, the basis sets for all atoms were specified. The file was uploaded to HPC to run the analysis.
Results
The information of calculation is summarized in the picture. 11.
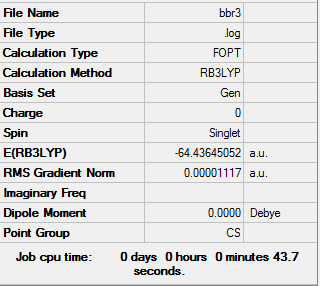
The "Item" table which includes converged forces and distances is displayed below. And It shows that the calculation was finished.
        Item               Value     Threshold  Converged?
Maximum Force            0.000020     0.000450     YES
RMS     Force            0.000011     0.000300     YES
Maximum Displacement     0.000077     0.001800     YES
RMS     Displacement     0.000044     0.001200     YES
Predicted change in Energy=-1.117392D-09
Optimization completed.
   -- Stationary point found.
                          ----------------------------
                          !   Optimized Parameters   !
                          ! (Angstroms and Degrees)  !
--------------------------                            --------------------------
! Name  Definition              Value          Derivative Info.                !
--------------------------------------------------------------------------------
! R1    R(1,2)                  1.9339         -DE/DX =    0.0                 !
! R2    R(1,3)                  1.9339         -DE/DX =    0.0                 !
! R3    R(1,4)                  1.934          -DE/DX =    0.0                 !
! A1    A(2,1,3)              119.9967         -DE/DX =    0.0                 !
! A2    A(2,1,4)              119.9968         -DE/DX =    0.0                 !
! A3    A(3,1,4)              120.0064         -DE/DX =    0.0                 !
! D1    D(2,1,4,3)            180.0            -DE/DX =    0.0                 !
--------------------------------------------------------------------------------
GradGradGradGradGradGradGradGradGradGradGradGradGradGradGradGradGradGrad
The HPC output Log. file could be check through the linkDOI:10042/26092
 |
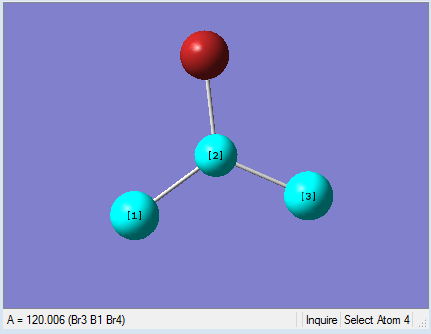 |
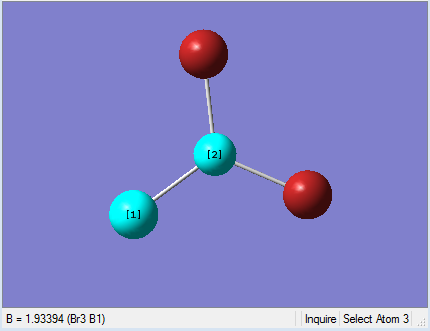
As present in Picture. 12 and Picture. 13, the B-Br bond length after optimize is 1.93 Å and Br-B-Br angel is 120 degree. In literature, the the B-Br bond length is 1.892 Å[1].
Comparison of bond distances
The bond distances of BH3, BBr 3, GaBr3 are listed in the table 1.
Table 1
| ' | Bond Length/ Å | Bond Length in literature[1]./ Å |
| B-H of BH3 | 1.19 | 1.19 |
| B-Br of BBr3 | 1.93 | 1.892 |
| Ga-Br of GaBr3 | 2.35 | 2.249 |
The difference between BH3 and BBr3 is that the -H ligands are replaced by -Br ligands. By the replacement, the bond length increase. The bond length increases form 1.19 Å (B-H) to 1.93 Å (B-Br). It is because that Br is a larger atom and it is more electronegative.
H has the electronic configuration: 1s1. Br has the electronic configuration: [Ar]3d104s24p5. Both of them have a unpaired electron. As a result they are both x-type ligand which donate one unpaired electron to the centre atom to form a sigma bond. However H has a better overlap with B, because the 1s orbital of H has similar size with the sp2 hybridized B orbital. In contrast, the large 4p orbital of Br has a mismatch with the sp2 hybridized B orbital. Though H and Br are both more electronegative than B, Br is more electronegative than H. As a result, B-Br bond is more polar and weaker than B-H bond. In conclusion, B-Br bond is longer, more polar and weaker than B-H bond.
The difference between BBr3 and GsBr3 is that the central B is replaced by Ga. By the replacement, the bond length increase. The bond length increases form 1.93 Å (B-Br) to 2.35 Å (Ga-Br). Because Ga is larger than B.
Ga has the electronic configuration:[Ar]3d104s24p1. B has the electronic configuration: 1s22s22p1. Both of B and Ga are group 3 elements and they can all form sigma bond with Br. However, the large and diffuse (4s,4p)hybridized orbital of Ga has a poor overlap with the large 4p orbital of Br. In contrast (2s,2p)hybridized orbital of B has better overlap with Br. As a results, the Ga-Br bond is weak and long. Meanwhile, Ga is less electronegative than B. As a result, Ga-Br bond is more polar. In conclusion, Ga-Br bond is weaker, longer and more polar than B-Br bond.
In some case, gaussview does not draw bonds as we expect. It does not mean that there is no bond. It is because that the bond length is not in the pre-defined range. "Bond" is defined as the electronic attraction which forms new substance between atoms with opposite charge. In general, there are four types of bonds. They are ionic bond, covalent bond, van der vaals' force and hydrogen bonding[2].
Day 3
Frequency analysis for BH3
Method
The frequency analysis was carried out for the optimized BH3 molecule to analysis the structure of BH3 molecule. The symmetry of the BH3 molecule was restricted to D 3h.
Summary
The information of calculation is summarized in the picture. 14. The summary shows that the " Imaginary frequency" is 0. It means that the molecule was in the stable state.
The "Item" table which includes converged forces and distances is displayed below. And It shows that the calculation was finished.
        Item               Value     Threshold  Converged?
Maximum Force            0.000011     0.000450     YES
RMS     Force            0.000005     0.000300     YES
Maximum Displacement     0.000042     0.001800     YES
RMS     Displacement     0.000021     0.001200     YES
Predicted change in Energy=-6.702220D-10
Optimization completed.
   -- Stationary point found.
GradGradGradGradGradGradGradGradGradGradGradGradGradGradGradGradGradGrad
The low frequencies lines are displayed below. It shows that the low frequencies are in the range of plus/minus 15cm-1.
Low frequencies ---   -5.0068   -1.2203   -0.0055    0.9880    9.0091    9.0914
Low frequencies --- 1162.9783 1213.1705 1213.1732
The original Log. output could be check through the link Frequency
Animating the vibrations
Method
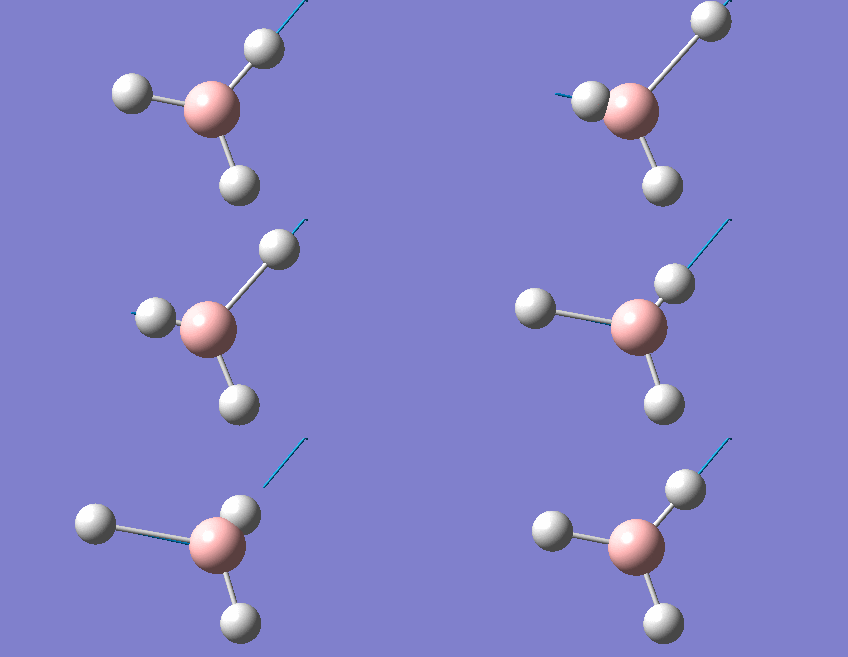
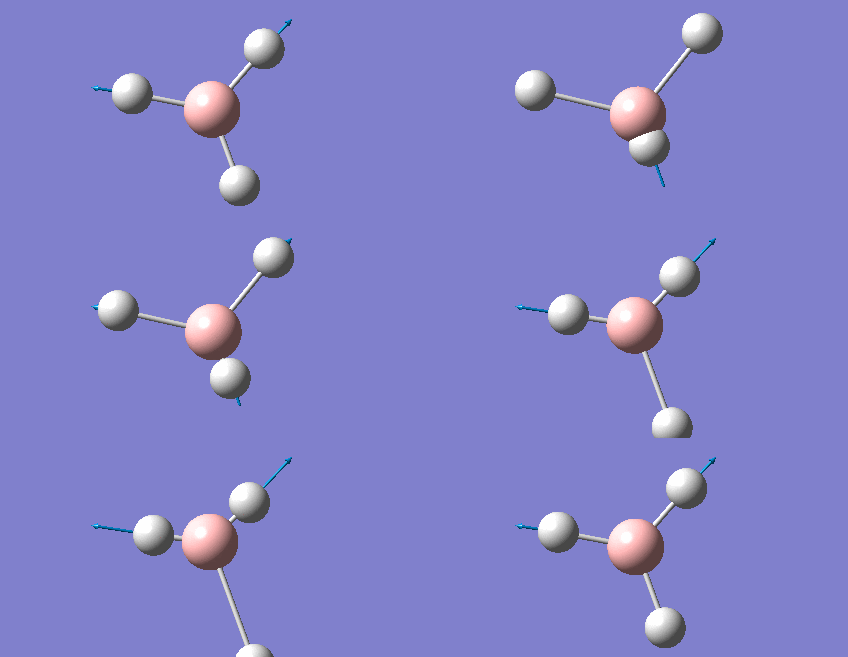
The vibration models of analyzed BH3 molecule was checked from "Results" - "Vibrations" in Gaussview.
Summary
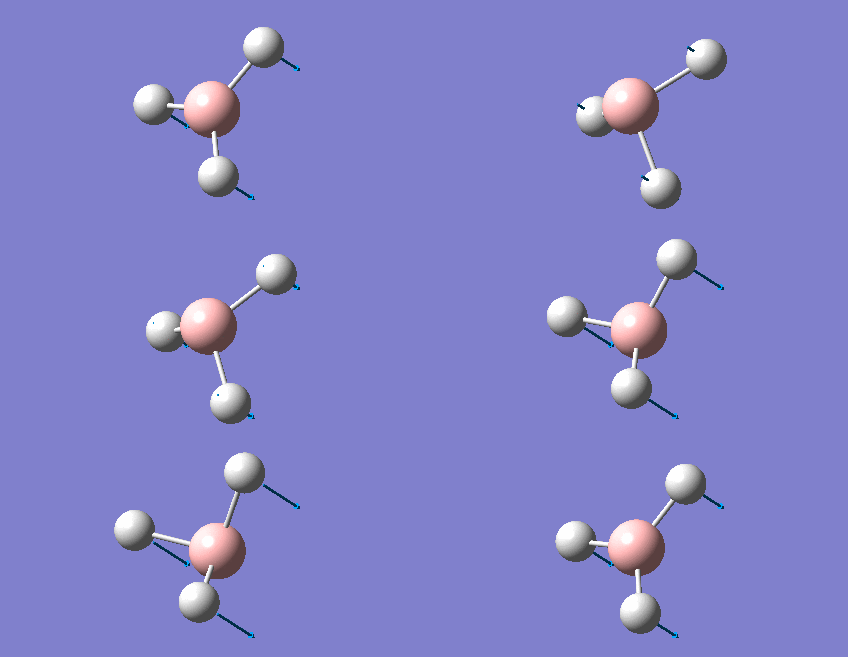
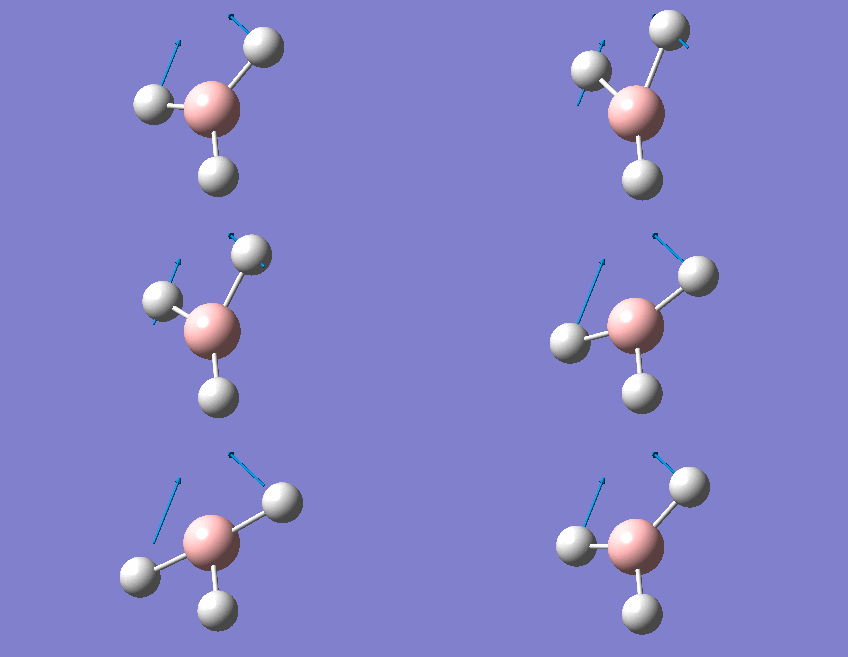
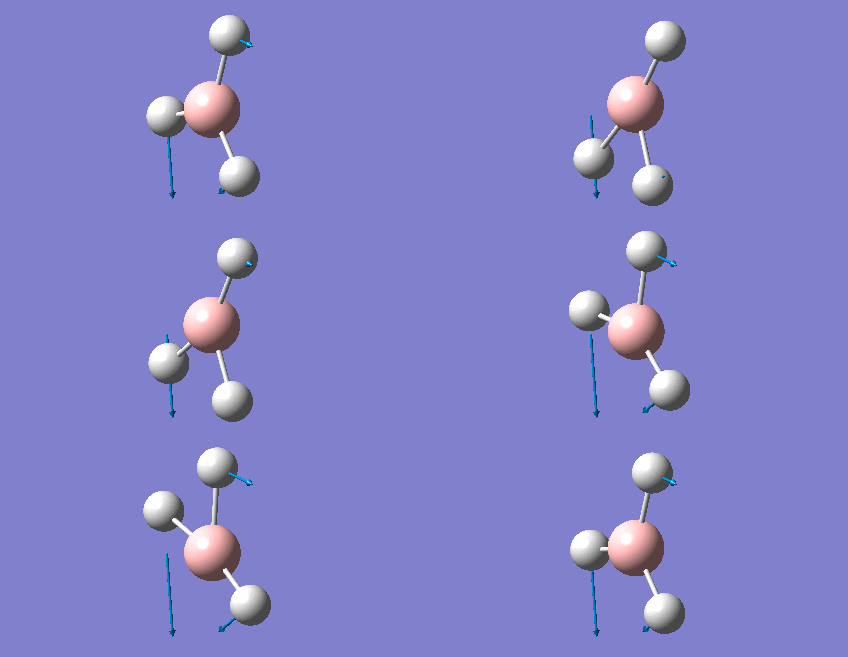
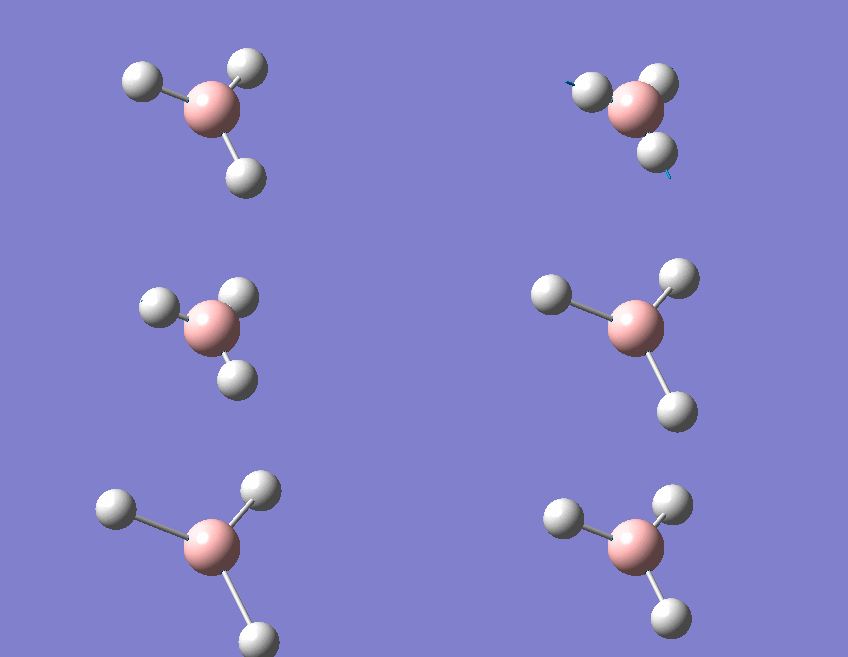
Six vibrations were found and they are displayed in the Table. 2. Table. 2.
IR
The calculated IR spectrum is showed in Picture. 15
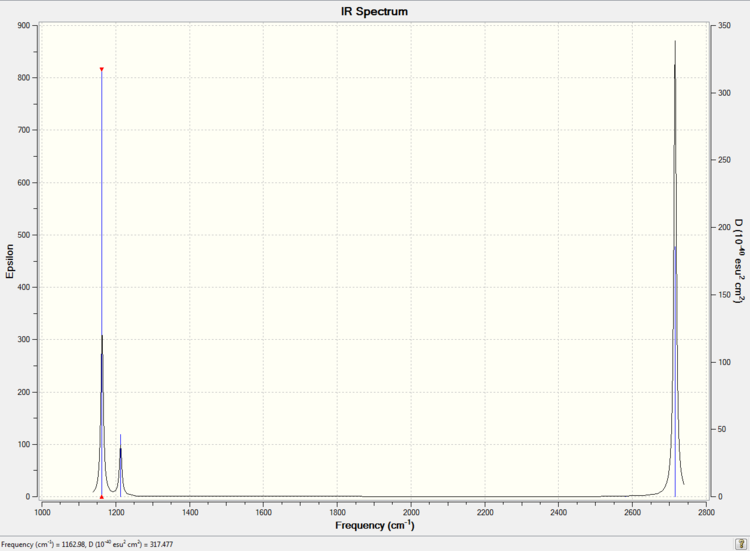
In the IR spectrum, there are only three peaks. The three peaks are 1163 cm-1, 1213 cm-1, 2716 cm-1 separately. However, six vibration modes were calculated. The vibration modes 2 and 3 are degenerate and at the frequency 1213 cm-1. The vibration modes 5 and 6 are degenerate and at the frequency 2716 cm-1. The stretch of mode 4 is totally symmetric so this mode cannot be detected by IR.
Frequency analysis for GaBr3
Method
The frequency analysis was run for the optimized GaBr3 to analysis the structure of GaBr3 molecule. The symmetry of the GaBr3 molecule was restricted to D3h. And the file was analysed by HPC system.
Summary
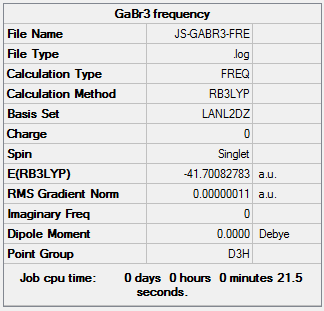
The information of calculation is summarized in the picture. 16.
The "Item" table which includes converged forces and distances is displayed below. And It shows that the calculation was finished.
        Item               Value     Threshold  Converged?
Maximum Force            0.000000     0.000450     YES
RMS     Force            0.000000     0.000300     YES
Maximum Displacement     0.000002     0.001800     YES
RMS     Displacement     0.000001     0.001200     YES
Predicted change in Energy=-6.142862D-13
Optimization completed.
   -- Stationary point found.
The low frequencies lines are displayed below. It shows that the low frequencies are in the range of plus/minus 15cm-1.
Low frequencies ---   -0.5252   -0.5247   -0.0024   -0.0010    0.0235    1.2010
Low frequencies ---   76.3744   76.3753   99.6982
The original Log. output could be check through the linkDOI:10042/26141 The lowest "real" normal mode is 76 cm-1. The optimised structure of GaBr3 is a minimum. Because the imaginary frequency of the structure is zero which is shown in the summary and the low frequencies are in the range of plus/minus 15cm-1.
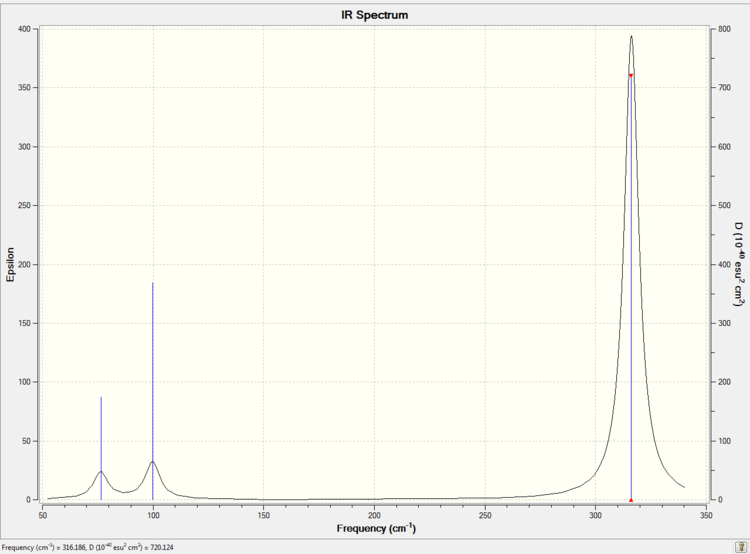
The calculated IR spectrum is showed in Picture. 17
Comparison of IR
| no. BH3 | frequency/ cm-1 | Intensity | symmetry D3h point group | no. GaBr3 | frequency/ cm-1 | Intensity | symmetry D3h point group |
| 1 | 1163 | 93 | A2" | 1 | 76 | 3 | E' |
| 2 | 1213 | 14 | E' | 2 | 76 | 3 | E' |
| 3 | 1213 | 14 | E' | 3 | 100 | 9 | A2" |
| 4 | 2582 | 0 | A1' | 4 | 197 | 0 | A1' |
| 5 | 2716 | 126 | E' | 5 | 316 | 57 | E' |
| 6 | 2716 | 126 | E' | 6 | 316 | 57 | E' |
The frequency is proportional to the force constant of the bond and reversely proportional to the reduced mass. BH3 vibrational modes have much larger frequency than GaBr3 vibrational modes. Both B and H are small atoms and have small mass. as a reslut the reduce mass of BH3 is small. In contrast, Ga and Br have larger mass. As a reslut, the reduce mass of GaBr3 is large. It also means that B-H bond is much stronger than Ga-Br bond. Because the overlap between the large 4p orbital of Ga and large 4p orbital of Br is poor. However, the overlap between 1s orbital of H and 2p orbital of B is much better. In the IR spectra of both BH3 and GaBr3, three peaks are recorded. However both BH3 and GaBr3 have six vibrational modes. Because they all have the point group D3h. Two of the E' modes degenerated and the other two E'modes also degenerated. As a result, the four E' modes give two peaks. The A1' is totally symmetric and cannot be detected by IR. Overall, three peaks are observed. In both IR spectra, A2" and E' modes are close in energy. A1' and E' modes are close in energy. In A2" and E' modes, no bond stretch could be observed. So the bond length keeps constant during the vibrations. However, in A1' and E' modes, bond stretch could be observed. Vibrational frequency is higher for the modes with bond stretch. As a result, A1' and E' modes are higher in frequency. For BH3, A2" mode is lower in frequency than E' mode. For GaBr3, A2" mode is higher in frequency than E'mode. It is because than the bond length of Ga-Br is longer and more polar than B-H.
Why must you use the same method and basis set for both the optimisation and frequency analysis calculations? If two difference method and basis are chose for the optimization, two different optimized structures would be obtained. And the two different optimized structure have different total energy. The frequency analysis is used to check if the structure is fully optimized. Same method and basis must be applied, or the frequency analysis would not be applied to the optimized structure.
What is the purpose of carrying out a frequency analysis? The frequency analysis is used to check if the structure is fully optimized. Meanwhile, vibrational modes and IR spectrum could be simulated.
What do the "Low frequencies" represent? The low frequency present the motions on the center of mass of a molecule. For a molecule with 4 atoms, 6 vibrational modes could be find, according to the 3N-6 rule.
Molecular Orbitals of BH3
Method
The molecular orbitals of BH3 was obtained by calculating of the electronic structure. Before the calculation, the method was set to energy. "pop=full" was added to the "additional keywords" section. And "Full NBO" was chose. The file was sent to HPC system to run the analysis.
Summary
The information of calculation is summarized in the picture. 18.
The original Log. output could be check through the linkDOI:10042/26146
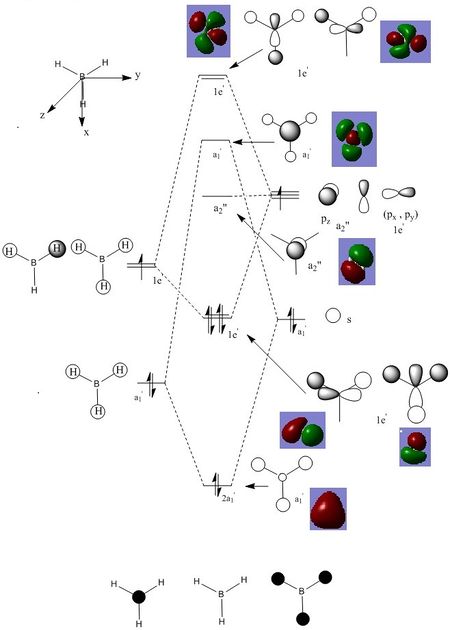
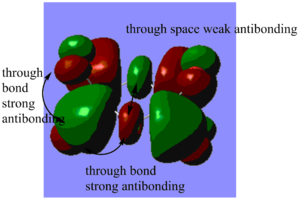
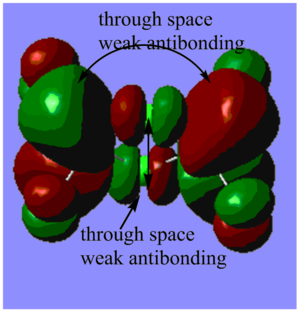
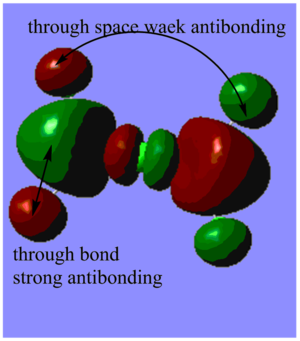
Are there any significant differences between the real and LCAO MOs?
There are significant differences between the real and LCAO MOs. LCAO MOS only show the orbitals on each individual atom of a molecule. However, the real MOs delocolized on the whole molecule and it is more diffuse. As a result, real MOs could be used to predict the electron density and distribution of a molecule but LCAO MOs cannot.
What does this say about the accuracy and usefulness of qualitative MO theory?
Qualitative MO theory could be use to predict the position of orbitals and the their combination. And the nodal planes of the combined orbitals could be predicted. However, qualitative MO theory cannot predict the delocalized electron distribution and the shape of electron density.
NBO Analysis
Method
A NH3 was created. The molecule was carried out 6-31G(d,p) optimization ( key words=nosymm , frequency(key words= int=ultrafine) and MO analysis (key words= pop=full).
Summary
Optimization
The information of calculation is summarized in the picture. 20.
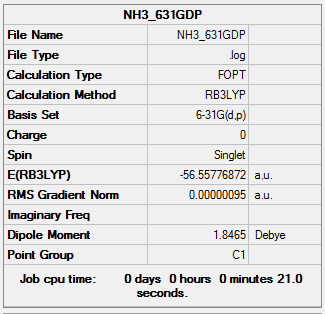
The "Item" table which includes converged forces and distances is displayed below. And It shows that the calculation was finished.
        Item               Value     Threshold  Converged?
Maximum Force            0.000002     0.000015     YES
RMS     Force            0.000001     0.000010     YES
Maximum Displacement     0.000005     0.000060     YES
RMS     Displacement     0.000003     0.000040     YES
Predicted change in Energy=-9.677561D-12
Optimization completed.
   -- Stationary point found.
The original Log. output could be check through the link Optimization
Frequency
The information of calculation is summarized in the picture. 21.
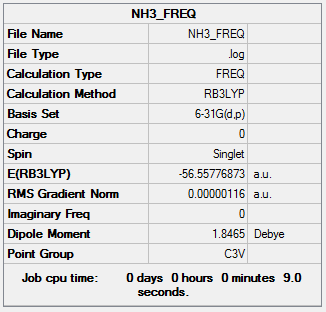
The "Item" table which includes converged forces and distances is displayed below. And It shows that the calculation was finished.
        Item               Value     Threshold  Converged?
Maximum Force            0.000002     0.000450     YES
RMS     Force            0.000001     0.000300     YES
Maximum Displacement     0.000006     0.001800     YES
RMS     Displacement     0.000003     0.001200     YES
Predicted change in Energy=-1.607654D-11
Optimization completed.
   -- Stationary point found.
GradGradGradGradGradGradGradGradGradGradGradGradGradGradGradGradGradGrad
The low frequencies lines are displayed below. It shows that the low frequencies are in the range of plus/minus 15cm-1.
Low frequencies ---   -1.2053   -0.0041   -0.0009    0.0753    3.8651    3.8657
Low frequencies --- 1089.3665 1693.9310 1693.9310
The original Log. output could be check through the link Frequency
MO
The information of calculation is summarized in the picture. 22.
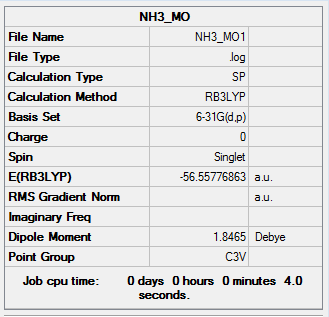
The original Log. output could be check through the link MO
The HPC analyzed output file could be checked through the linkDOI:10042/26172
Picture. 23 shows the charge distribution. And the charge range is (-1.0 to +1.0).
Picture. 24 shows the specific NBO chargeS for nitrogen and hydrogen. The charge of nitrogen atom is -1.125. The charge of each hydrogen atom is +0.375.
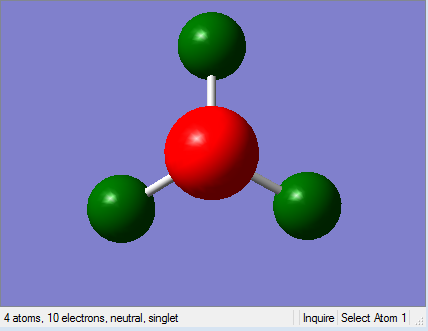 |
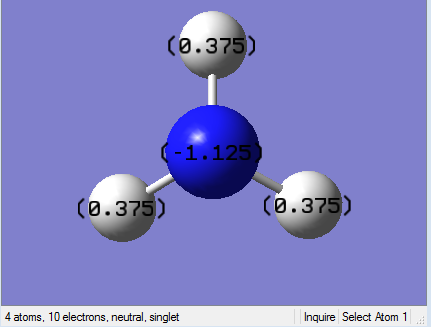 |
Day 4
Association energies: Ammonia-Borane
Method
A NH3BH3 molecule was created and it was optimized at the b3lyp/6-31G(d,p) level. The structure of NH3BH3 molecule was checked by frequency analysis.
Summary
Optimization
The information of calculation is summarized in the picture. 25.
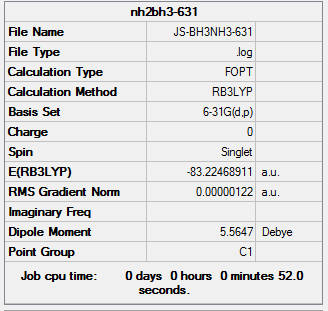
The "Item" table which includes converged forces and distances is displayed below. And It shows that the calculation was finished.
        Item               Value     Threshold  Converged?
Maximum Force            0.000002     0.000015     YES
RMS     Force            0.000001     0.000010     YES
Maximum Displacement     0.000024     0.000060     YES
RMS     Displacement     0.000010     0.000040     YES
Predicted change in Energy=-8.746364D-11
Optimization completed.
   -- Stationary point found.
The original Log. output could be check through the link OPT
Frequency analysis
The information of calculation is summarized in the picture. 26.
The "Item" table which includes converged forces and distances is displayed below. And It shows that the calculation was finished.
        Item               Value     Threshold  Converged?
Maximum Force            0.000004     0.000450     YES
RMS     Force            0.000001     0.000300     YES
Maximum Displacement     0.000022     0.001800     YES
RMS     Displacement     0.000008     0.001200     YES
Predicted change in Energy=-1.098974D-10
Optimization completed.
The low frequencies lines are displayed below. It shows that the low frequencies are in the range of plus/minus 15cm-1.
Low frequencies ---   -5.5395   -0.3588   -0.0541   -0.0011    1.0000    1.1033
Low frequencies ---  263.2916  632.9628  638.4627
   -- Stationary point found.
The original Log. output could be check through the link Frequency
Dissociation Energy
The energy of optimized BH3, NH3, NH3BH3 are listed in the Table. 3.
Table. 3.
| Molecule | Energy/au |
| BH3 | -26.6153236 |
| NH3 | -56.55776872 |
| NH3BH3 | -83.22468911 |
ΔE=E(NH3BH3)-[E(NH3)+E(BH3)]= -0.05159679 au. The association energy in kJ/mol is -134.15 kJ/mol. The dissociation energy is +134.15 kJ/mol. So the dissociate process is endothermic and it is not a spontaneous process. It is because that NH3BH3 is a stable molecule. The stability is due to a lone pair on N donates to the empty p orbital on B to form a N-B bond.
Project: Lewis acids and bases
Optimization
Four isomers of Al2Cl4Br2 were created by Gaussview. The four isomers were optimized using the method: B3LYP and the basis set: Gen. Full basis set 6-31G(d,p) was chose for Al and Cl. A PP LANL2DZdp was chose for Br.
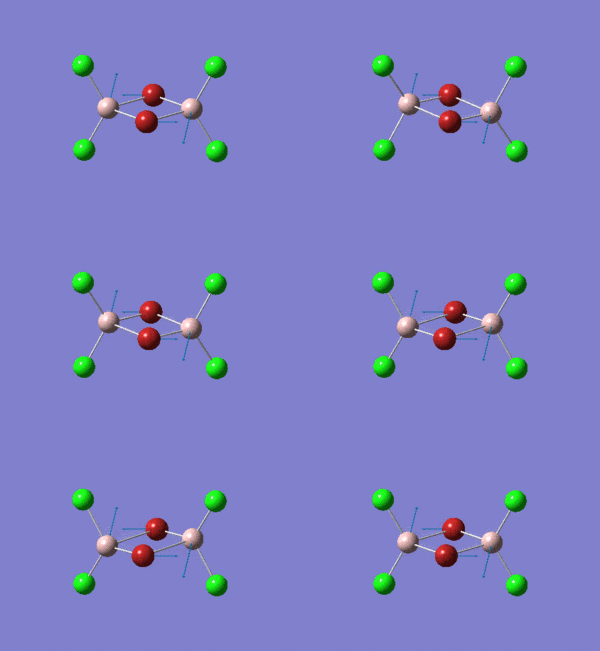
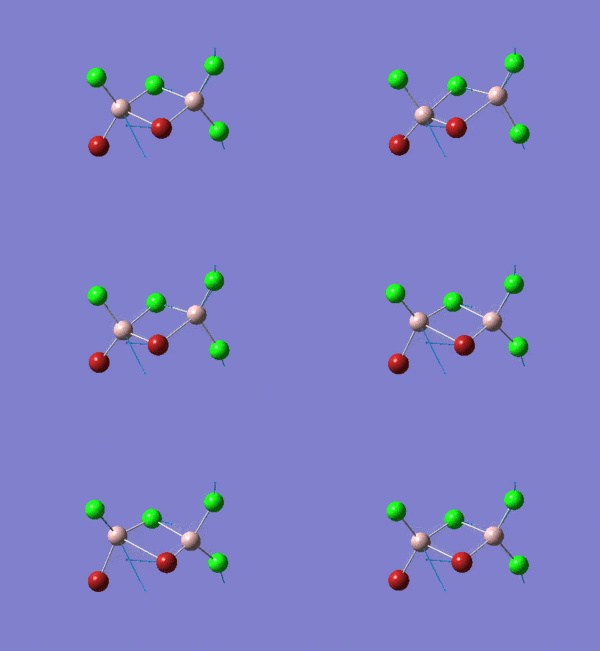
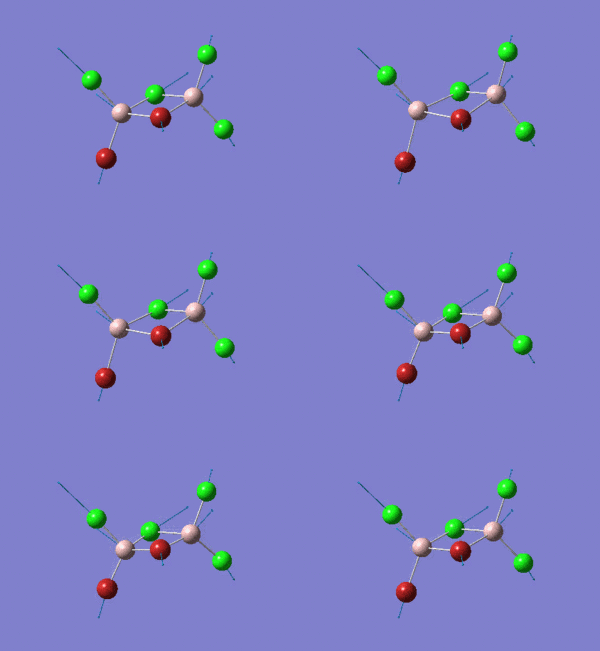
The structure of each isomer and information of calculation are listed in the Table. 4. In the pictures, the green atoms, red atoms and pink atoms are chlorine, bromine and aluminum separately. The calculated point group and real point group are not necessarily to be the same. So the real point groups of isomer are listed at the bottom of Table. 4.
| Table. 4 | Isomer 1 | Isomer 2 | Isomer 3 | Isomer 4 | ||||||||||||
| Sturucture |
|
|
|
| ||||||||||||
| File Name | js-isomer1-opt-out | js-isomer2-clean-opt | js-isomer3-opt-out | js-isomer4-clean-opt | ||||||||||||
| File Type | .log | .log | .log | .log | ||||||||||||
| Calculation Type | FOPT | FOPT | FOPT | FOPT | ||||||||||||
| Calculation Method | RB3LYP | RB3LYP | RB3LYP | RB3LYP | ||||||||||||
| Basis Set | Gen | Gen | Gen | Gen | ||||||||||||
| Charge | 0 | 0 | 0 | 0 | ||||||||||||
| Spin | Singlet | Singlet | Singlet | Singlet | ||||||||||||
| E(RB3LYP) | -2352.40630792 a.u | -2352.41109946 a.u | -2352.41629860 a.u | -2352.41626681 a.u | ||||||||||||
| RMS Gradient Norm | 0.00001239 a.u | 0.00000701 a.u | 0.00000721 a.u | 0.00000585 a.u | ||||||||||||
| Imaginary Frequency | ||||||||||||||||
| Dipole Moment | 0.0013 Debye | 0.1393 Debye | 0.0004 Debye | 0.1665 Debye | ||||||||||||
| Point Group | C2v | C1 | C1 | C2v | ||||||||||||
| Job cpu Time | 0 days 0 hours 3 minutes 30.6 seconds | 0 days 0 hours 7 minutes 34.5 seconds | 0 days 0 hours 7 minutes 5.4 seconds | 0 days 0 hours 6 minutes 32.5 seconds | ||||||||||||
| Link to D-Space | DOI:10042/26278 | DOI:10042/26300 | DOI:10042/26301 | DOI:10042/26302 | ||||||||||||
| Real point Group | D2h | C1 | C2h | C2v |
Isomer 1
File:1.mol |
The "Item" table which includes converged forces and distances is displayed below. And It shows that the optimization calculation was finished.
        Item               Value     Threshold  Converged?
Maximum Force            0.000041     0.000450     YES
RMS     Force            0.000017     0.000300     YES
Maximum Displacement     0.001604     0.001800     YES
RMS     Displacement     0.000746     0.001200     YES
Predicted change in Energy=-3.911645D-08
Optimization completed.
   -- Stationary point found.
The original Log. output could be check through the linkDOI:10042/26278
Isomer 2
File:1.mol |
The "Item" table which includes converged forces and distances is displayed below. And It shows that the optimization calculation was finished.
        Item               Value     Threshold  Converged?
Maximum Force            0.000014     0.000450     YES
RMS     Force            0.000004     0.000300     YES
Maximum Displacement     0.000121     0.001800     YES
RMS     Displacement     0.000033     0.001200     YES
Predicted change in Energy=-1.771796D-09
Optimization completed.
   -- Stationary point found.
The original Log. output could be check through the linkDOI:10042/26300
Isomer 3
File:1.mol |
The "Item" table which includes converged forces and distances is displayed below. And It shows that the optimization calculation was finished.
        Item               Value     Threshold  Converged?
Maximum Force            0.000012     0.000450     YES
RMS     Force            0.000005     0.000300     YES
Maximum Displacement     0.000601     0.001800     YES
RMS     Displacement     0.000239     0.001200     YES
Predicted change in Energy=-4.823693D-09
Optimization completed.
   -- Stationary point found.
The original Log. output could be check through the linkDOI:10042/26301
Isomer 4
File:1.mol |
The "Item" table which includes converged forces and distances is displayed below. And It shows that the optimization calculation was finished.
        Item               Value     Threshold  Converged?
Maximum Force            0.000009     0.000450     YES
RMS     Force            0.000004     0.000300     YES
Maximum Displacement     0.000370     0.001800     YES
RMS     Displacement     0.000170     0.001200     YES
Predicted change in Energy=-2.673342D-09
Optimization completed.
   -- Stationary point found.
The original Log. output could be check through the linkDOI:10042/26302
Summary
Symmetry Analysis
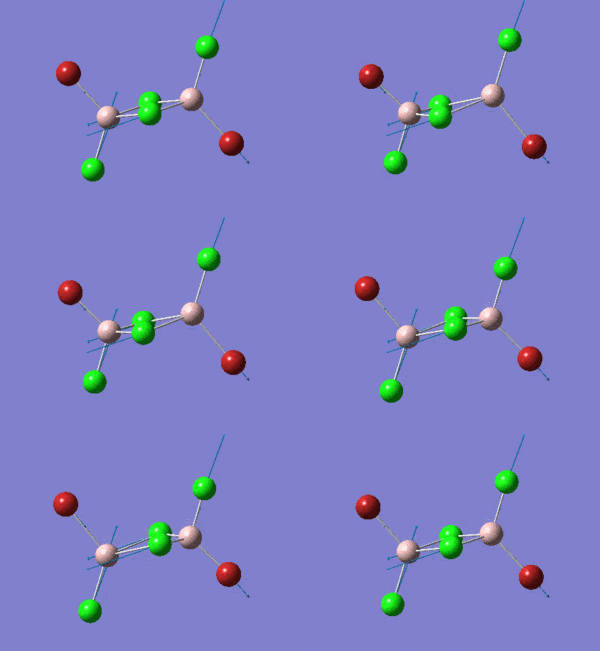
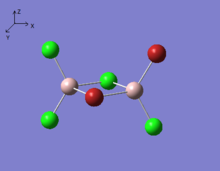
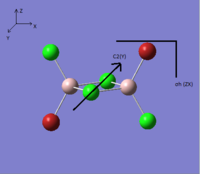
The symmetry elements and point group of each isomer are listed in the Table. 5.
| Table. 5 | Isomer 1 | Isomer 2 | Isomer 3 | Isomer 4 |
| Structure | 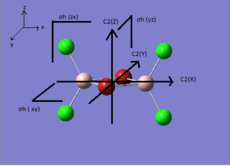 |
 |
 |
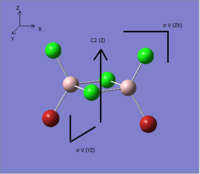 |
| Symmetry elements | C2(x),C2(y),C2(z), σh(xy), σh(xz), σh(zy) | no symmetry element | C2(y), σh(zx) | C2(z), σv(zx), σv(zy) |
| Point group | D2h | C1 | C2h | C2v |
Relative energy of isomers
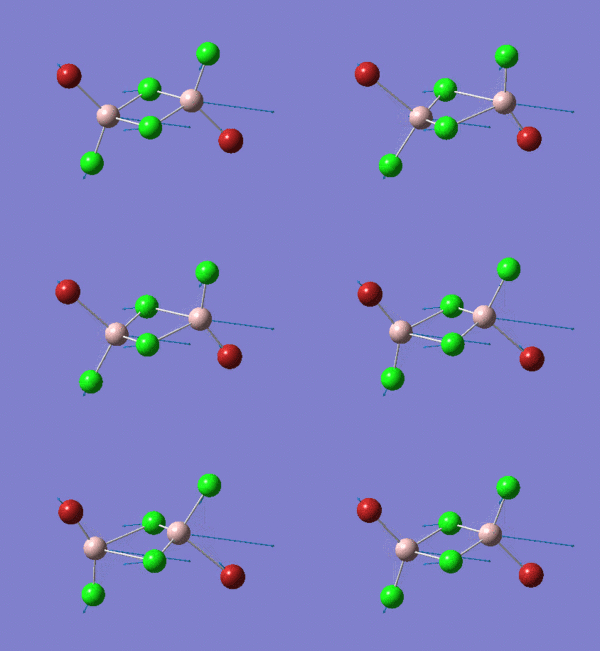
In the structures, the green atoms, red atoms and pink atoms are chlorine, bromine and aluminum separately. The energy of the four isomers are listed in the Table. 6 in both a.u and KJ/mol unit. By comparing the energies, the energy of isomer 3 is found to be the most negative. As a result, isomer 3 is the most stable isomer in these four isomers. In the bottom of Table. 6, the relative energies to the most stable isomer 3 are listed in the unit KJ/mol for each isomer.
| Table. 6 | Isomer 1 | Isomer 2 | Isomer 3 | Isomer 4 | ||||||||||||
| Sturucture |
|
|
|
| ||||||||||||
| Energy/ a.u | -2352.40630792 | -2352.41109946 | -2352.41629860 | -2352.41626681 | ||||||||||||
| Energy/ KJ/mol | -6176242.76 | -6176255.34 | -6176268.99 | -6176268.91 | ||||||||||||
| Relative energy to isomer 3/ KJ/mol | 26.23 | 13.65 | 0.00 | 0.08 |
Isomer 3 is the most stable conformer. In the isomer 3, the two bromine atoms are both in the terminal position to different aluminum and trans to each other. In isomer 4, the two bromine atoms are both in the terminal position to different aluminum and cis to each other. The energy of isomer 4 is higher than the energy of isomer 3 and the energy difference is 0.08 KJ/mol. The energy difference is small. The radius of bromine atom is larger than the radius of chlorine atom. When the two bromine atoms are in the cis position the isomer suffers more steric hindrance than the two bromine atoms are in the trans position. The higher steric hindrance is the reason for the slightly high energy of isomer 4 than isomer 3. The most unstable conformer id isomer 1. The two bromine atoms are both in the bridging position and the relative energy to isomer 3 is 26.23 KJ/mol. The second unstable conformer is isomer 2. One of the bromine atom is in the bridging position and the relative energy to isomer 3 is 13.65 KJ/mol which is half of 26.23 KJ/mol. It means that the conformers with bromine in the bridging position are unfavoured. Because aluminum and chlorine are both in the row 3 in the periodic table. The size of 3s and 3p hybridized orbitals of aluminum are similar to the size of 3p orbitals of chlorine. So the overlap between the aluminum (sp3 orbital) and chlorine (3p orbital) is good. The overlap of the diffuse 4p orbital of bromine with the aluminum is less good, especially when the bromine is in the bridging position of the 3c-2e- system.
Monomer analysis
The structure of the monomer AlBrCl2 is shown below. In the pictures, the green atoms, red atoms and pink atoms are chlorine, bromine and aluminum separately.
File:1.mol |
Same method and basis set as previous were used for the optimization and frequency analysis for the monomer. And the information of calculation is listed in the Table. 7
| Table. 7 | Optimization of the monomer | Frequency analysis of the monomer |
| File Name | MONOMER-OPT-HPCOUT | MONOMER-FRE-HOC-OUT |
| File Type | .log | .log |
| Calculation Type | FOPT | FREQ |
| Calculation Method | RB3LYP | RB3LYP |
| Basis Set | Gen | Gen |
| Charge | 0 | 0 |
| Spin | Singlet | Singlet |
| E(RB3LYP) | -1176.19013679 a.u | -1176.19013679 a.u |
| RMS Gradient Norm | 0.00004196 a.u | 0.00004194 a.u |
| Imaginary Frequency | 0 | |
| Dipole Moment | 0.1075 Debye | 0.1075 Debye |
| Point Group | C2v | C2v |
| Job cpu Time | 0 days 0 hours 1 minutes 5.9 seconds | 0 days 0 hours 0 minutes 37.4 seconds |
| Link to D-Space | DOI:10042/26321 | DOI:10042/26322 |
| Real point Group | C2v | C2v |
The "Item" table of optimization which includes converged forces and distances is displayed below. And It shows that the optimization calculation was finished for the monomer.
        Item               Value     Threshold  Converged?
Maximum Force            0.000136     0.000450     YES
RMS     Force            0.000073     0.000300     YES
Maximum Displacement     0.000681     0.001800     YES
RMS     Displacement     0.000497     0.001200     YES
Predicted change in Energy=-7.984394D-08
Optimization completed.
   -- Stationary point found.
The "Item" table of frequency analysis which includes converged forces and distances is displayed below. And It shows that the frequency calculation was finished for the monomer.
        Item               Value     Threshold  Converged?
Maximum Force            0.000081     0.000450     YES
RMS     Force            0.000042     0.000300     YES
Maximum Displacement     0.001588     0.001800     YES
RMS     Displacement     0.000974     0.001200     YES
Predicted change in Energy=-1.810813D-07
Optimization completed.
   -- Stationary point found.
The low frequencies lines are displayed below. It shows that the low frequencies are in the range of plus/minus 15cm-1. The calculated imaginary frequency is 0. It means that the monomer was fully optimized.
Low frequencies ---   -0.0025   -0.0020    0.0031    1.3569    3.6367    4.2604
Low frequencies ---  120.5042  133.9178  185.8950
Dissociation energy
Isomer 3 is the most stable conformer. So isomer 3 was used for the analysis of dissociation energy.
The energy information of isomer 3 and the monomer are listed in the Table. 8
| Table. 8 | Energy/ a.u | Energy/ KJ/mol |
| Al2Cl4Br2 (Isomer 3) | -2352.41629860 | -6176268.99 |
| AlBrCl2 (monomer) | -1176.19013679 | -3088087.20 |
The association energy ΔE=E(Al2Cl4Br2)-2*E(AlBrCl2)= -94.58 kJ/mol. The dissociation energy is 94.58 kJ/mol. So the dissociate process is endothermic and it is not a spontaneous process. It means that isomer 3 is more stable than the isolated monomer. Because in the monomer, there are only 6 electrons in the valence orbital of Al. So Al want to get two electrons to get the octet structure. When forming the dimer, the electron deficiency are released.
Frequency
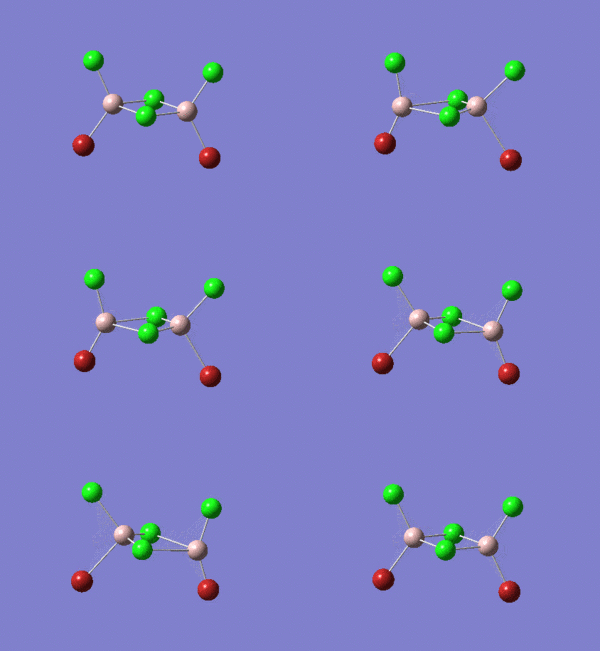
The frequency analysis was carried out for the optimized isomers to confirm the isomers were fully optimized. Same method and basis set as the optimize process were chose for the frequency analysis. The structure of each isomer and information of calculation are listed in the Table. 9. In the pictures, the green atoms, red atoms and pink atoms are chlorine, bromine and aluminum separately. The calculated point group and real point group are not necessarily to be the same. So the real point groups of isomer are listed at the bottom of Table. 9.
| Table. 9 | Isomer 1 | Isomer 2 | Isomer 3 | Isomer 4 | ||||||||||||
| Sturucture |
|
|
|
| ||||||||||||
| File Name | js-isomer1-fre-out | js-isomer2-clean-fre | js-isomer3-fre-out | js-isomer4-clean-fre | ||||||||||||
| File Type | .log | .log | .log | .log | ||||||||||||
| Calculation Type | FREQ | FREQ | FREQ | FREQ | ||||||||||||
| Calculation Method | RB3LYP | RB3LYP | RB3LYP | RB3LYP | ||||||||||||
| Basis Set | Gen | Gen | Gen | Gen | ||||||||||||
| Charge | 0 | 0 | 0 | 0 | ||||||||||||
| Spin | Singlet | Singlet | Singlet | Singlet | ||||||||||||
| E(RB3LYP) | -2352.40630788 a.u | -2352.41109946 a.u | -2352.41629860 a.u | -2352.41626681 a.u | ||||||||||||
| RMS Gradient Norm | 0.00003052 a.u | 0.00000700 a.u | 0.00000718 a.u | 0.00000588 a.u | ||||||||||||
| Imaginary Frequency | 0 | 0 | 0 | 0 | ||||||||||||
| Dipole Moment | 0.0000 Debye | 0.1393 Debye | 0.0004 Debye | 0.1665 Debye | ||||||||||||
| Point Group | D2h | C1 | C1 | C2v | ||||||||||||
| Job cpu Time | 0 days 0 hours 1 minutes 12 seconds | 0 days 0 hours 3 minutes 29.3 seconds | 0 days 0 hours 3 minutes 38.2 seconds | 0 days 0 hours 1 minutes 40.7 seconds | ||||||||||||
| Link to D-Space | DOI:10042/26279 | DOI:10042/26304 | DOI:10042/26305 | DOI:10042/26306 | ||||||||||||
| Real point Group | D2h | C1 | C2h | C2v |
Isomer 1
File:1.mol |
The "Item" table which includes converged forces and distances is displayed below. And It shows that the frequency calculation was finished.
        Item               Value     Threshold  Converged?
Maximum Force            0.000064     0.000450     YES
RMS     Force            0.000031     0.000300     YES
Maximum Displacement     0.000778     0.001800     YES
RMS     Displacement     0.000448     0.001200     YES
Predicted change in Energy=-9.667699D-08
Optimization completed.
   -- Stationary point found.
The low frequencies lines are displayed below. It shows that the low frequencies are in the range of plus/minus 15cm-1. The calculated imaginary frequency is 0. It means that the structure was fully optimized.
Low frequencies ---   -5.7324   -5.5948   -3.3971   -0.0035   -0.0023   -0.0022
Low frequencies ---   14.5079   63.1928   86.0727
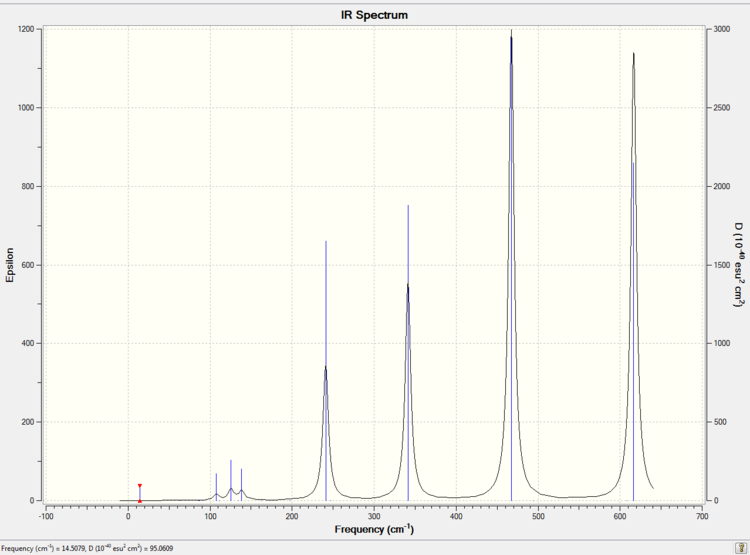
The simulated IR spectrum of isomer 1 is presented in Picture. 27.
Isomer 2
File:1.mol |
The "Item" table which includes converged forces and distances is displayed below. And It shows that the frequency calculation was finished.
        Item               Value     Threshold  Converged?
Maximum Force            0.000020     0.000450     YES
RMS     Force            0.000007     0.000300     YES
Maximum Displacement     0.000937     0.001800     YES
RMS     Displacement     0.000453     0.001200     YES
Predicted change in Energy=-4.164690D-09
Optimization completed.
   -- Stationary point found.
The low frequencies lines are displayed below. It shows that the low frequencies are in the range of plus/minus 15cm-1. The calculated imaginary frequency is 0. It means that the structure was fully optimized.
Low frequencies ---   -2.5287   -0.0018    0.0023    0.0036    0.6262    3.0981
Low frequencies ---   17.1094   55.9276   80.0590
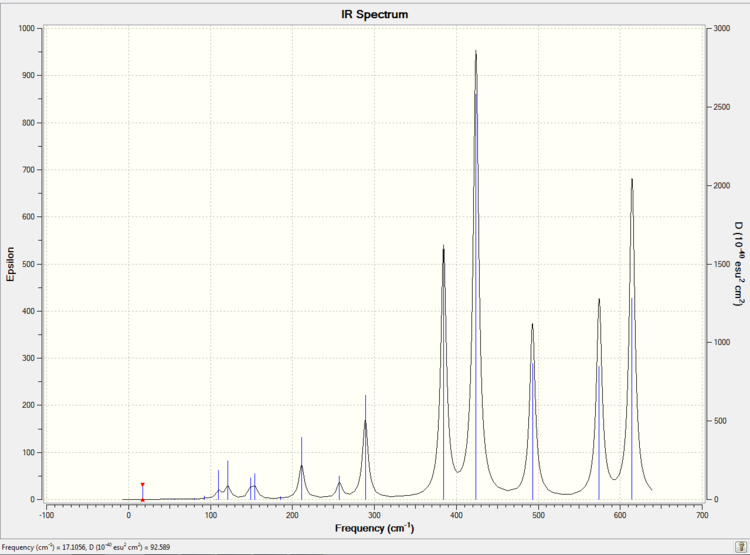
The simulated IR spectrum of isomer 2 is presented in Picture. 28.
Isomer 3
File:1.mol |
The "Item" table which includes converged forces and distances is displayed below. And It shows that the frequency calculation was finished.
        Item               Value     Threshold  Converged?
Maximum Force            0.000019     0.000450     YES
RMS     Force            0.000007     0.000300     YES
Maximum Displacement     0.000488     0.001800     YES
RMS     Displacement     0.000224     0.001200     YES
Predicted change in Energy=-7.038728D-09
Optimization completed.
   -- Stationary point found.
The low frequencies lines are displayed below. It shows that the low frequencies are in the range of plus/minus 15cm-1. The calculated imaginary frequency is 0. It means that the structure was fully optimized.
Low frequencies ---   -5.2222   -0.0026   -0.0013    0.0011    1.3436    1.9047
Low frequencies ---   18.1339   49.1069   73.0122
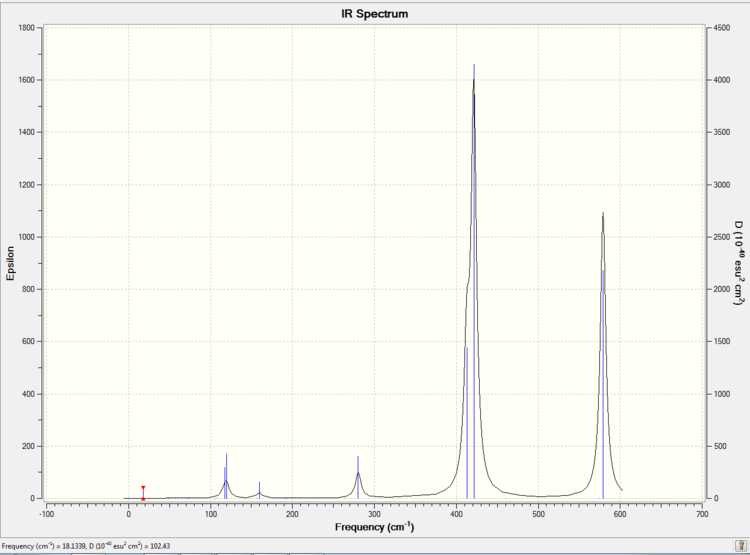
The simulated IR spectrum of isomer 3 is presented in Picture. 29.
isomer 4
File:1.mol |
The "Item" table which includes converged forces and distances is displayed below. And It shows that the frequency calculation was finished.
        Item               Value     Threshold  Converged?
Maximum Force            0.000018     0.000450     YES
RMS     Force            0.000006     0.000300     YES
Maximum Displacement     0.000326     0.001800     YES
RMS     Displacement     0.000160     0.001200     YES
Predicted change in Energy=-3.153276D-09
Optimization completed.
   -- Stationary point found.
The low frequencies lines are displayed below. It shows that the low frequencies are in the range of plus/minus 15cm-1. The calculated imaginary frequency is 0. It means that the structure was fully optimized.
Low frequencies ---   -5.2222   -0.0026   -0.0013    0.0011    1.3436    1.9047
Low frequencies ---   18.1339   49.1069   73.0122
The simulated IR spectrum of isomer 4 is presented in Picture. 30.
Summary
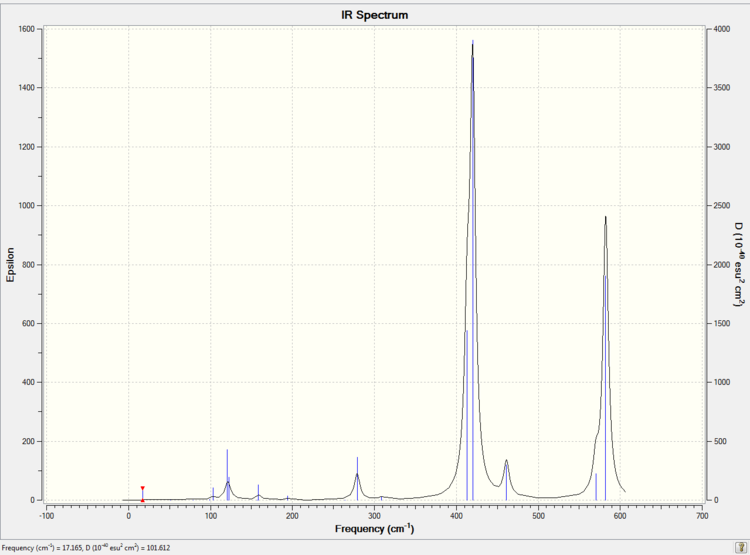
There are 8 atoms in each isomer. According to the 3N-6 rule, each isomer has 18 vibration modes. However, not all the modes are active in IR. Only these vibrations which change the dipole moment of the isomer are active in IR spectrum.
Isomer 2 has 18 bands in the IR spectrum. It means that all the 18 vibration modes are active in IR. It is because that isomer 2 has low symmetry (point group is C1). There is no symmetry element for isomer 2. Meanwhile isomer 2 has a total dipole moment 0.1393 Debye. So the vibration modes of isomer 2 cause the change of dipole moment easier than these isomers with total dipole moment 0 Debye.
Only 8 vibration modes of isomer 1 are active in IR. As a result, IR for isomer 1 has less bands than the IR for isomer 2. Because isomer 1 is highly symmetric (point group is D2h) and has the total dipole moment 0.0000 Debye. 10 vibration modes of isomer 1 cannot change the total dipole moment.
Isomer 3 is slightly less symmetric (point group is D2h) than isomer 1 and has a total dipole moment 0.0004 Debye. As a result, isomer 3 has one more active vibration mode than isomer 1 which is 9.
Isomer 4 is more symmetry (point group is C2v) than isomer 2 but less symmetric than isomer 2 and isomer 4. Meanwhile, isomer 4 has a comparably large dipole moment 0.1665 Debye. As a result, there are 15 active vibration modes in the IR.
Overall, the highly unsymmetrical isomer 2 has the most bands in IR. Because all the vibration modes change the dipole moment.
A change of dipole moment is the requirement for a active vibration mode. And only these active vibration mode could be detected by IR.
MO
The molecular orbitals of isomer 3 was obtained by calculating of the electronic structure. Before the calculation, the method was set to energy. "pop=full" was added to the "additional keywords" section. And "Full NBO" was chose. The file was sent to HPC system to run the analysis. The information of calculation is summarized below:
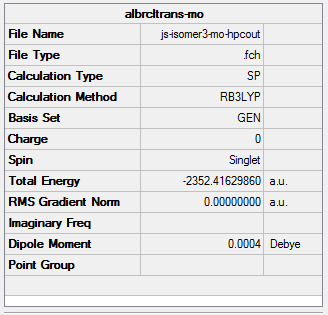
The original output could be check through the link DOI:10042/26408
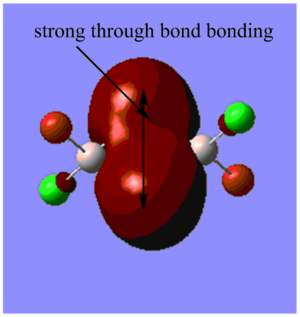
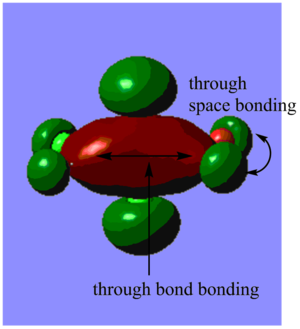
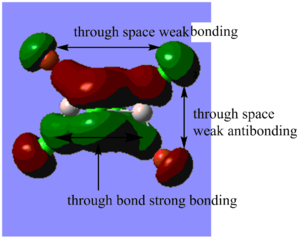
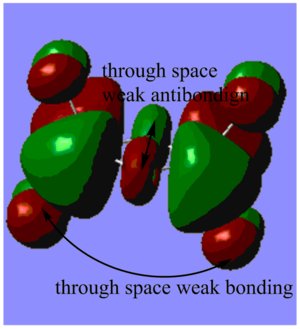
Highly bonding orbital 31
Highly bonding orbital 38
Bonding orbital 40
Bonding orbital 57
Highly antibonding orbital 60
Further study
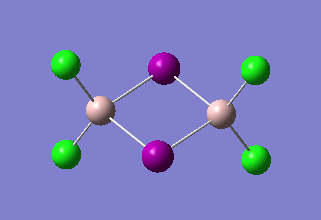
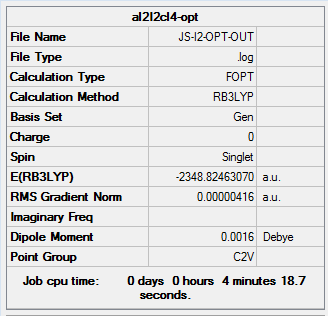
The same method and basis set as previous were used to run optimization and frequency analysis for Al2I2Cl4. I is a bigger atom than Br. In theory, Al2I2Cl4 should be less stable than isomer 1 because of the poor overlap. The purple atoms are I. The calculation information is listed below:
 |
 |
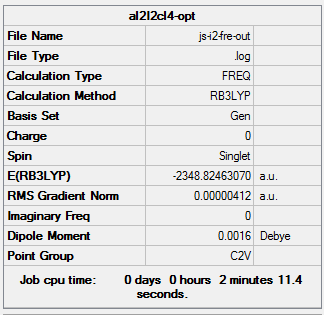 |
The "Item" table of optimization analysis which includes converged forces and distances is displayed below. And It shows that the calculation was finished.
        Item               Value     Threshold  Converged?
Maximum Force            0.000014     0.000450     YES
RMS     Force            0.000005     0.000300     YES
Maximum Displacement     0.001317     0.001800     YES
RMS     Displacement     0.000641     0.001200     YES
Predicted change in Energy=-6.065606D-09
Optimization completed.
   -- Stationary point found.
The original output could be check through the link DOI:10042/26409
The "Item" table of frequency analysis which includes converged forces and distances is displayed below. And It shows that the calculation was finished.
        Item               Value     Threshold  Converged?
Maximum Force            0.000012     0.000450     YES
RMS     Force            0.000004     0.000300     YES
Maximum Displacement     0.001635     0.001800     YES
RMS     Displacement     0.000710     0.001200     YES
Predicted change in Energy=-6.317924D-09
Optimization completed.
   -- Stationary point found.
The low frequencies lines are displayed below. It shows that the low frequencies are in the range of plus/minus 15cm-1. The calculated imaginary frequency is 0. It means that the monomer was fully optimized.
Low frequencies ---   -6.2631   -5.7571   -4.4599   -0.0010   -0.0006    0.0017
Low frequencies ---    9.2351   65.0734   76.7447
The original output could be check through the link DOI:10042/26410
The total energy of the optimized Al2I2Cl4 is -2348.82462070 a.u ( -6166839.07 KJ/mol). This molecule can created by changing the bridging Br in isomer 1 into I. And the total energy of isomer 1 is -6176242.76 KJ/mol. ΔE=E(Isomer 1) - E(Al2I2Cl4 )= -9403.69 KJ/mol. It means that isomer 1 much stable than Al2I2Cl4. The result satisfy the theory.
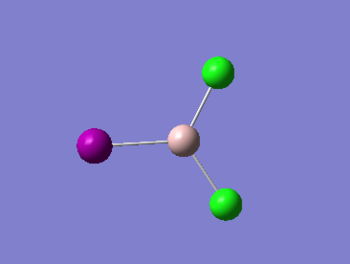
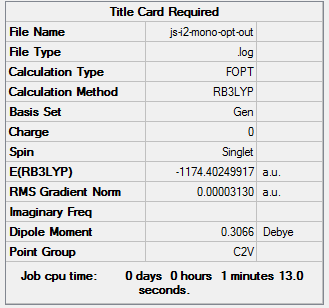
The monomer AlICl2 was optimized and analysed below:
 |
 |
        Item               Value     Threshold  Converged?
Maximum Force            0.000101     0.000450     YES
RMS     Force            0.000050     0.000300     YES
Maximum Displacement     0.000610     0.001800     YES
RMS     Displacement     0.000365     0.001200     YES
Predicted change in Energy=-3.978942D-08
Optimization completed.
   -- Stationary point found.
The original output could be check through the link DOI:10042/26464
The energy of the monomer is -1174.402499 a.u (-3083393.76 KJ/mol)
The association energy ΔE=E(Al2Cl4I2)-2*E(AlICl2)= -51.55 kJ/mol. The dissociation energy is 51.55 kJ/mol. So the dissociate process is endothermic and it is not a spontaneous process. It means that Al2Cl4I2 is more stable than the isolated monomer. Because in the monomer, there are only 6 electrons in the valence orbital of Al. So Al want to get two electrons to get the octet structure. When forming the dimer, the electron deficiency are released. Tough compare to isomer 3, the chose Al2Cl4I2 is less stable. The monomers are still want to couple to form the dimer.
References
- ↑ 1.0 1.1 1.2 W. M. Haynes, D. R. Lide and T. J. Bruno, CRC handbook of chemistry and physics : a ready-reference book of chemical and physical data, 2012, 93, 9–23.
- ↑ Carl R. Nave (2005). HyperPhysics http://hyperphysics.phy-astr.gsu.edu/hbase/chemical/bond.html Retrieved May 18, 2005.

