Rep:Mod:sunflower395
Module 2
Computer modelling is frequently used to model the structures and properties of molecules. An alternative method to the computationally robust ab initio method, is density functional theory (DFT). DFT expresses the total energy in terms of the total electron density instead of the wavefunction solely. DFT methods are much quicker and require less computer memory.
Analysing The Optimised BH3 Molecule
Creating a molecule of BH3
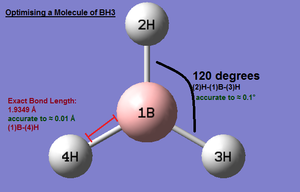
A molecule of BH3 was drawn using Guass View 3.0. The B-H bond lengths were modified and set to 1.5 Å using the 'bond length tool', the default B-H length was 1.18 Å. Once complete the structure was optimised using Gaussian. The BH3 optimised .log file was opened using Gauss View and the new optimised B-H bond length measured as 1.19 Å (2dp). According to theoretical literature studies the B-H bond length in BH3 is 1.160 Å, geometry optimised using STO-3G; this value is very similar to the optimised bond length using RB3LYP calculation method and 3-21G basis set. This can be expected since BH3 is a reasonably simple molecule. Literature also confirms that the BH3 molecule is a planar molecule with D3H symmetry as illustrated in the computational results summary below.(1) Experimental data from literature studies also show that the H-B-H bond angle is 120° which support the calculated bond angle also. (2)
Optimising the molecule
Since the geometry of a molecule determines many of its physical and chemical properties it is important to understand the geometry of a molecule when running computations. In computational chemistry we aim to optimise bond lengths, bond angles and dihedral angles. To confirm that the structure has successfully optimised one can observe whether or not the ‘gradient’ value is close to zero, or at least least than 0.001. The results summary sections shows that the gradient for the BH3 is 0.00020672 a.u , which suffices. One can also consult the ‘final set of forces and displacements’ section in the log file of the optimised structure to check whether the forces (gradient the energy vs distance graph) are converged. See the log file below:
Results Summary: BH3 optimisation

- File Name = bh3_optimisation
- File Type = .log
- Calculation Type = FOPT
- Calculation Method = RB3LYP
- Basis Set = 3-21G
- Charge = 0
- Spin = Singlet
- E(RB3LYP) = -26.46226338 a.u.
* RMS Gradient Norm = 0.00020672 a.u.
- Imaginary Freq =
* Dipole Moment = 0.0000 Debye, accurate to 0.01 Debye
- Point Group = D3H
- Job cpu time: 0 days 9 0 hours 0 minutes 37.0 seconds.
- B(1)-H(2) Bond Length: 1.19 Å (accurate to ≈ 0.01 Å)
- H(2)B(1)H(4) Angle: 120.0° (accurate to ≈ 0.1°)
Optimising the molecule, log file:
       Item               Value     Threshold  Converged?
Maximum Force            0.000413     0.000450     YES
RMS     Force            0.000271     0.000300     YES
Maximum Displacement     0.001610     0.001800     YES
RMS     Displacement     0.001054     0.001200     YES
Predicted change in Energy=-1.071764D-06
Optimization completed.
   -- Stationary point found.
                          ----------------------------
                          !   Optimized Parameters   !
                          ! (Angstroms and Degrees)  !
--------------------------                            --------------------------
! Name  Definition              Value          Derivative Info.                !
--------------------------------------------------------------------------------
! R1    R(1,2)                  1.1935         -DE/DX =    0.0004              !
! R2    R(1,3)                  1.1935         -DE/DX =    0.0004              !
! R3    R(1,4)                  1.1935         -DE/DX =    0.0004              !
! A1    A(2,1,3)              120.0            -DE/DX =    0.0                 !
! A2    A(2,1,4)              120.0            -DE/DX =    0.0                 !
! A3    A(3,1,4)              120.0            -DE/DX =    0.0                 !
! D1    D(2,1,4,3)            180.0            -DE/DX =    0.0                 !
--------------------------------------------------------------------------------
GradGradGradGradGradGradGradGradGradGradGradGradGradGradGradGradGradGrad
The ‘converged’ column shows all ‘YES’ values this means that for a small displacement, the energy does not change.
BH3 .log file shows that the forces have all converged hence the optimisation was successful. The image titled, BH3 Optimise Total Energy and RMS Gradient Norm Graphs, also shows that the total energy has reached the lowest value as the RMS gradient norm graph shows that the gradient of the energy is very close to zero. The gradient is not exactly zero however, this could be due to the extent of the accuracy of the method/basis set used to calculate these values. To improve the investigation one could use the following methods and basis set :MP2 and 6-311G(d,p) to get more accurate calculations.
There is also a function in Guass View that allows the intermediate geometries to be illustrated before the final optimised structure is shown. When the green button is clicked the animation starts and the different structures are displayed. Initially the first structure is drawn without any bonds. This is because Gaussview only draws bonds( in the form of a ‘line’) when the distance between the two given atoms for-fills a certain criteria based on a chemical database comprised from primarily organic molecules; thus the absence of a ‘line’ does not equate to the absence of a bond existing, it simply means that the distance of the given atoms lies outside of the given pre-defined threshold.
Literature references: 1.Bond length Literature B-H BH3 http://pubs.acs.org/doi/pdf/10.1021/ja00845a021 1.16 2.H-B-H bond angle is 120° http://www.sciencedirect.com/science?_ob=MImg&_imagekey=B6TFM-44GH6JN-43-1&_cdi=5230&_user=217827&_pii=0301010486870963&_origin=search&_coverDate=12%2F15%2F1986&_sk=998899997&view=c&wchp=dGLbVzz-zSkWb&md5=6b3868d693fd4ab6d11dbafbd3787a34&ie=/sdarticle.pdf
Molecular Orbitals of BH3



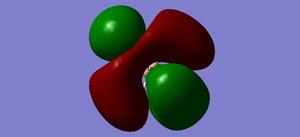

Molecular Orbitals of BH3
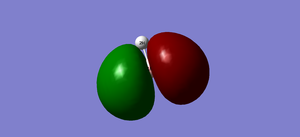
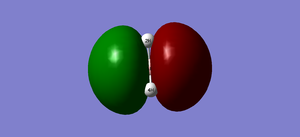
Computational chemistry allows the molecular orbitals (Mo’s) of structures to be visualised in 3D and allows comparisons to be made with manual MO diagram estimates. To compute the MOs for BH3, the .chk file from the initial optimisation was opened. The method was changed from optimisation to Energy, "pop=full" was added to the additional keywords section (activates the MO analysis) and "Full NBO" was selected on the NBO tab. Teh energy calculation is more extensive than the optimisation calculation so it was performed ont he HPC server: DOI:5317 http://hdl.handle.net/10042/to-5317 .
Once the energy calculated was complete the .fchk file was opened useing Guass view 3.0 and the Mo’s were analysed.
Results Summary the SCAN MO energy calculation for the Molecular Orbitals: E(RB3LYP)-26.46226338 a.u. consistent with the optimised energy value. This confirms that the same basis set was used.
The MO diagram of BH3
The advantage of generating MO diagrams on a computer rather than by the manual LCAO method is that the computational energy method calculation allows a quantitative value to be associated with each molecular orbital diagram. This means that the exact ordering of MO’s according to their relative energies can be seen.
Visually, from a phase perspective, the real MO’s look very similar to the LCAO pictures drawn using Chem Draw 3D which is good. The image titled Computer generated MO and LCA MO BH3 comparison shows that the MO’s with energies -0.356 and 0.188 (highlighted by a red dot)are degenerate, i.e. there are two different MO’s with the same energy. The main difference between the computer generated (real) MO images and the LCAO MO is the energy ordering sequence. According to the LCAO method the highest energy MO is doubly degenerate with symmetry labels 2e’ and the next highest energy MO has a 3a1’ symmetry label. However, based on the energy calculation using the B3LYP method and 3-21G basis set, this ordering is reversed i.e. the highest energy (0.192 a.u.) MO is the orbital with the 3a1’ symmetry label followed by the second highest energy degenerate MO’s (0.188 a.u.) with both with symmetry labels 2e’ (0.188) 0.188 and 0.192 a.u.
What does this say about the accuracy and usefulness of qualitative MO theory?
Qualitative LCAO MO theory is a useful, but simplified, technique to provide a basic understanding of the shape of the molecular orbitals, based on the atomic orbitals of the constituent fragments for a given system. However, the exact energy ordering of the MOs is difficult to predict accurately without any prior knowledge of the numerical values. Computationally generated MOs allow more accurate MO diagrams to be draw since the exact energies of each MO are provided. The accuracy of the energy values obtained depends largely on the parameter set when conducting the ‘Energy’ calculation method.
Molecular orbital diagram BH3

__________________________________________________________________________________________________________________________________
NBO Analysis BH3
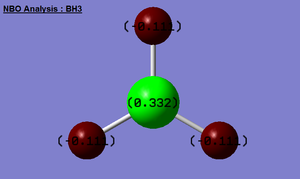
NBO analysis of BH3
The .log file from the population analysis calculation (energy method) was open and the ‘charge distribution’ option was selected. The NBO charge options were chosen, bright green represents highly positive charge and bright red highly negative charge. The image titled ‘BH3 Analysis’ shows that the boron atom (+0.332) is the relatively less electronegative than the hydrogen atoms (all three H atoms have -0.11 charge).
Example of the optimised BH3, energy method population .log file:
                                Natural Population
--------------------------------------------------------
  Core                       1.99903 ( 99.9517% of   2)
  Valence                    6.00000 (100.0000% of   6)
  Natural Minimal Basis      7.99903 ( 99.9879% of   8)
  Natural Rydberg Basis      0.00097 (  0.0121% of   8)
--------------------------------------------------------
   Atom  No          Natural Electron Configuration
----------------------------------------------------------------------------
     B    1      [core]2S( 0.97)2p( 1.70)
     H    2            1S( 1.11)
     H    3            1S( 1.11)
     H    4            1S( 1.11)
Animating BH3 Vibrations
Energy comparison check: To ensure that the frequency calculation on the optimised BH3 molecule (referred to as structure i) was conducted successfully, the energy value of the structure should be the same as the optimised BH3 molecule. The results show that that E(RB3LP) = -26.46226338 au and E(RB+HF-LYP)= -26.4622633 au are very similar.
Vibrational analysis and confirming minima
The frequency analysis is the second derivative of the potential energy surface. To confirm that a minimum energy structure has been achieved we aim to see all positive frequencies in the output .log file. If one of the frequencies is negative there is a transition state present, and if more than one frequency is negative then the critical point and the optimisation has not completed or has failed. The frequency analysis allows the generation of IR and Raman modes which can then be compared with experiment.
Results
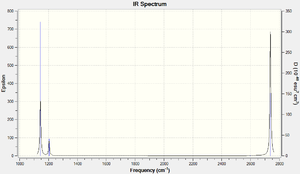
The computed IR spectrum for BH3 shows that there are less than six peaks even thought there are six vibrational modes. There are four different types of frequencies and two out of the six vibration modes have the same frequency (e.g. modes (2 and 3) and modes (5 and 6) both have common frequencies and intensities). There are only three IR peaks since mode 4 has an intensity of 0.0000 based on the accuracy of the type of frequency calculation method implemented.
___________________________________________________________________________________________________________________________________
Using pseudo-potentials and larger basis sets
Information about ThBr3
Key Information about ThBr3
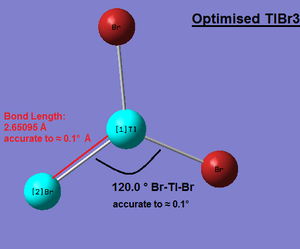
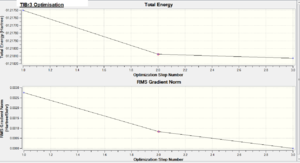
According to Guass View calculations,all three Tl-Br bond distances are exactly 2.65095 Å, however this value is only accurate to ≈ 0.01 Å hence the bond distance can be quoted as 2.65 Å ± 0.01 Å. Similarly, all three Br-Tl-Br bond angels are exactly 120.0°; however this value is only accurate to ≈ 0.1°hence the angles are quoted as 120.0° ±0.1°. Image:bh3_opt_totalenergy_RMSGradientNorm_Graphs.png|thumb| BH3 Optimise Total Energy and RMS Gradient Norm Graphs]]
Results Summary: TlBr3 optimisation
- File Name: TLBR3_OPTIMISATION4
- File Type: .log
- Calculation Type: FOPT
- Calculation Method: RB3LYP
- Basis Set: LANL2DZ,pseudo-potentials and larger basis sets, a medium level basis set: D95V on first row atoms and Los Alamos ECP (ie pseudo potentials) on heavier elements
- Charge: 0
- Spin: Singlet
* E(RB3LYP): -91.21812851 a.u.
- RMS Gradient Norm: 0.00000090 a.u.
- Imaginary Freq:
- Dipole Moment: 0.0000 Debye
- Point Group: D3H
- Job cpu time: 0 days 0 hours 1 minutes 15.0 seconds.
Filename = \\icfs16.cc.ic.ac.uk\cp308\YR III\Module 2 Patricia Hunt\tlbr3_optimisation4.log
TlBr3 optimisation File Name = tlbr3_optimisation4 File Type = .log Calculation Type = FOPT Calculation Method = RB3LYP Basis Set = LANL2DZ Charge = 0 Spin = Singlet E(RB3LYP) = -91.21812851 a.u. RMS Gradient Norm = 0.00000090 a.u. Imaginary Freq = Dipole Moment = 0.0000 Debye Point Group = D3H Job cpu time: 0 days 0 hours 1 minutes 15.0 seconds.
Calculations on TlBr3
The Gaussian density functional theory (DFT) RB3LYP calculation method and medium basis set LANL2DZ (this particular basis set is more suitable for modelling heavier elements such as Thallium) settings were chosen to construct an optimised structure of TlBr3. Once the optimisation calculation was completed, the .log file was opened in Guass View 3.0 and the structure was viewed. The optimised Tl-Br bond distance was measured to be 2.7 Å (accurate to 1dp), the Br-Tl-Br angle was 120o and the symmetry point group was found to be D3H. According to literature the Tl-Br bond length in planar geometryTlBr3 was found to be 2.512 Å. This is reasonably similar since the bond lengths both have the same order of magnitude. Tl-Br bond length Literature ref: http://actachemscand.dk/pdf/acta_vol_36a_p0125-0135.pdf
The total energy was given as E(RB3LYP) = -91.21812851 a.u. and the RMS Gradient Norm = 0.00000090 a.u. The gradient is less than 0.001 a.u. which confirms that the optimisation was successful. The .log output file below also confirms that the optimisation was successful since all the forces have converged. TlBr3 opt file : DOI:5331 http://hdl.handle.net/10042/to-5331
        Item               Value     Threshold  Converged?
Maximum Force            0.000002     0.000450     YES
RMS     Force            0.000001     0.000300     YES
Maximum Displacement     0.000022     0.001800     YES
RMS     Displacement     0.000014     0.001200     YES
Predicted change in Energy=-6.083929D-11
Optimization completed.
   -- Stationary point found.
                          ----------------------------
                          !   Optimized Parameters   !
                          ! (Angstroms and Degrees)  !
--------------------------                            --------------------------
! Name  Definition              Value          Derivative Info.                !
--------------------------------------------------------------------------------
! R1    R(1,2)                  2.651          -DE/DX =    0.0                 !
! R2    R(1,3)                  2.651          -DE/DX =    0.0                 !
! R3    R(1,4)                  2.651          -DE/DX =    0.0                 !
! A1    A(2,1,3)              120.0            -DE/DX =    0.0                 !
! A2    A(2,1,4)              120.0            -DE/DX =    0.0                 !
! A3    A(3,1,4)              120.0            -DE/DX =    0.0                 !
! D1    D(2,1,4,3)            180.0            -DE/DX =    0.0                 !
--------------------------------------------------------------------------------
GradGradGradGradGradGradGradGradGradGradGradGradGradGradGradGradGradGrad
The aim of conducting a frequency analysis on a molecule is to analyse whether or not the molecule geometry corresponds to the minimum energy level. Frequency analysis must be performed on a pre-optimised structure. The calculation involves working out the second derivative of the potential energy surface. For a minimum energy structure to be achieved, all frequencies must be positive
• Why must you use the same method and basis set for both calculations?
A basis set is a collection of vectors which cover a defined area of space in which a given problem is solved. In quantum chemistry the basis set refers to the set of single particle functions used to generate molecular orbitals (MO’s). In quantum chemistry MO’s are built from atomic orbitals. Atomic orbitals are single electron functions. It is necessary to use the same basis set e.g. LanL2DZ for both the optimisation and frequency analysis for a given molecule so that the functions used to calculated the given properties is consistent. If two different basis sets were used for the optimisation and frequency analysis for a given molecule the results would not make sense. The frequency analysis must be performed using the same basis set as that used for the optimisation of the molecule. What are the "Low frequencies" for TlBr3? What is the lowest "real" normal mode? TlBr3 optimised_frequency .log file:
Low frequencies --- -3.4213 -0.0026 -0.0004 0.0015 3.9367 3.9367
Low frequencies --- 46.4289 46.4292 52.1449
Harmonic frequencies (cm**-1), IR intensities (KM/Mole), Raman scattering
activities (A**4/AMU), depolarization ratios for plane and unpolarized
incident light, reduced masses (AMU), force constants (mDyne/A),
and normal coordinates:
                    1                      2                      3
                   E'                     E'                     A2"
Frequencies --    46.4289                46.4292                52.1449
Red. masses --    88.4613                88.4613               117.7209
Frc consts  --     0.1124                 0.1124                 0.1886
IR Inten    --     3.6867                 3.6867                 5.8466
 Atom  AN      X      Y      Z        X      Y      Z        X      Y      Z
    1  81     0.00   0.28   0.00    -0.28   0.00   0.00     0.00   0.00   0.55
    2  35     0.00   0.26   0.00     0.74   0.00   0.00     0.00   0.00  -0.48
    3  35     0.43  -0.49   0.00    -0.01  -0.43   0.00     0.00   0.00  -0.48
    4  35    -0.43  -0.49   0.00    -0.01   0.43   0.00     0.00   0.00  -0.48
                    4                      5                      6
                   A1'                    E'                     E'
Frequencies --   165.2685               210.6948               210.6948
Red. masses --    78.9183               101.4032               101.4032
Frc consts  --     1.2700                 2.6522                 2.6522
IR Inten    --     0.0000                25.4830                25.4797
 Atom  AN      X      Y      Z        X      Y      Z        X      Y      Z
    1  81     0.00   0.00   0.00     0.42   0.00   0.00     0.00   0.42   0.00
    2  35     0.00  -0.58   0.00     0.01   0.00   0.00     0.00  -0.74   0.00
    3  35     0.50   0.29   0.00    -0.55  -0.32   0.00    -0.32  -0.18   0.00
    4  35    -0.50   0.29   0.00    -0.55   0.32   0.00     0.32  -0.18   0.00
• What is a bond?
A bond describes a region of electron density between adjacent atoms. The electron density confers a degree of relative stability in the stystem due to the existence of positive attractive columbic forces between the electrons and the protons in the atomic nuclei. The relationship between the extent of the stability , strength of the columbic favourable energy, and the distance apart between the atoms in question can be modelled by the Morse potential curve. The Morse potential curve describes the energy of the system as a function of distance, the minimum (well) point represent the most stable distance apart i.e the bond length. The bond order represents the strength of the bond, for example a triple bond is stronger than a double bond which is stronger than a single bond. The bond order can be calculated from molecular orbital diagrams as well as other more sophisticated computer programs which may be based on semi-empirical methods. Electron density around an atoms can generally be categorised as either: core or valence and it is typically the valence electrons that are the most active in bond formations. It is difficult to classify a type of bond discretely as either ionic or covalent. Instead bonds are generally hybrids and fall somewhere along the spectrum classification spectrum. In summary, bonds cannot be merely represented as a ‘line’. Bond origin and nature is more complex. In order to understand more fully about the bonding interactions in a given system one must analyse the individual atomic properties at lower levels.
Isomers of Mo(CO)4L2
Optimising the ground state structures of cis and trans Mo(CO)4(PCl3)2
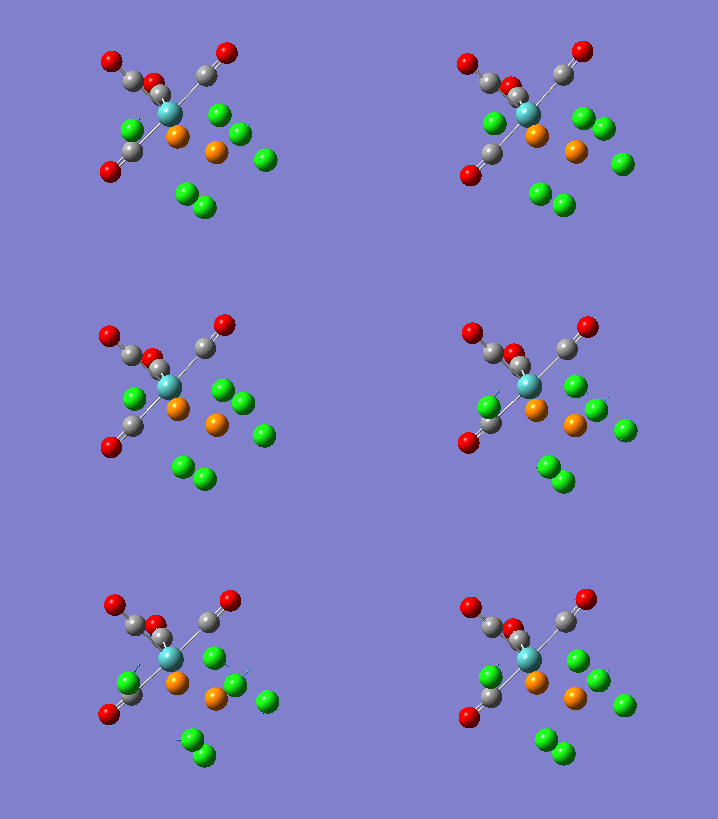
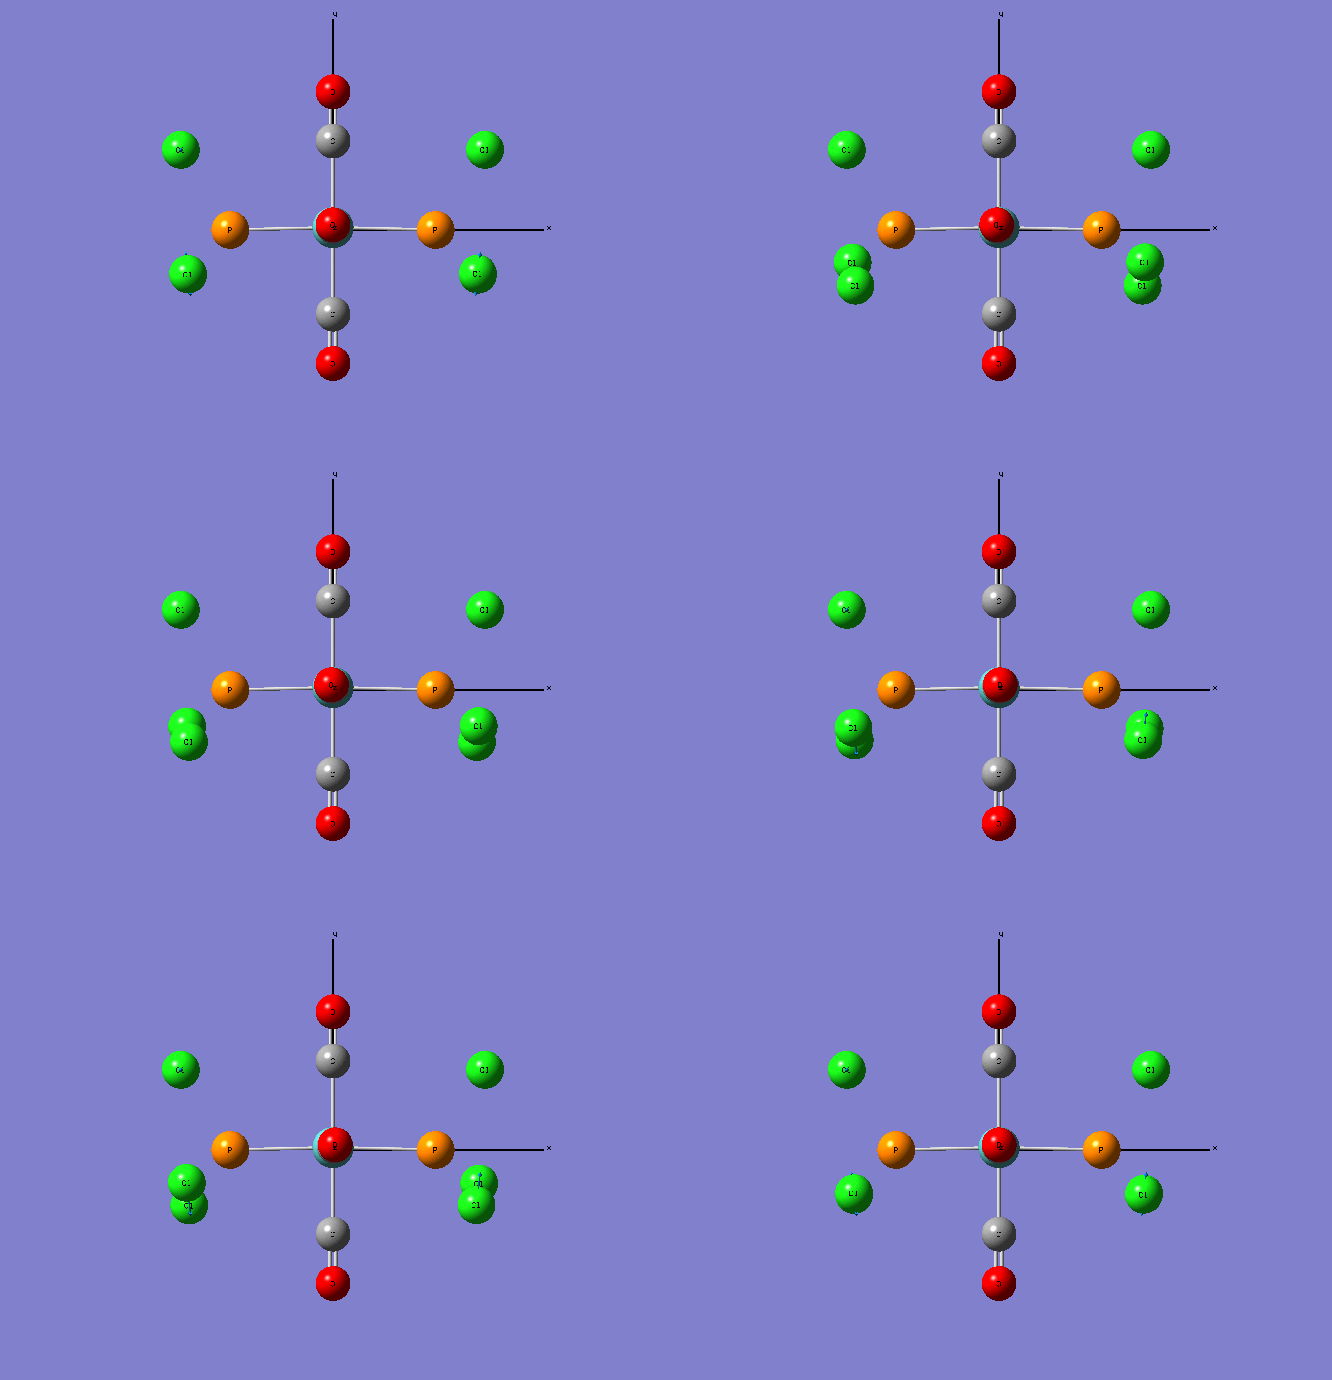
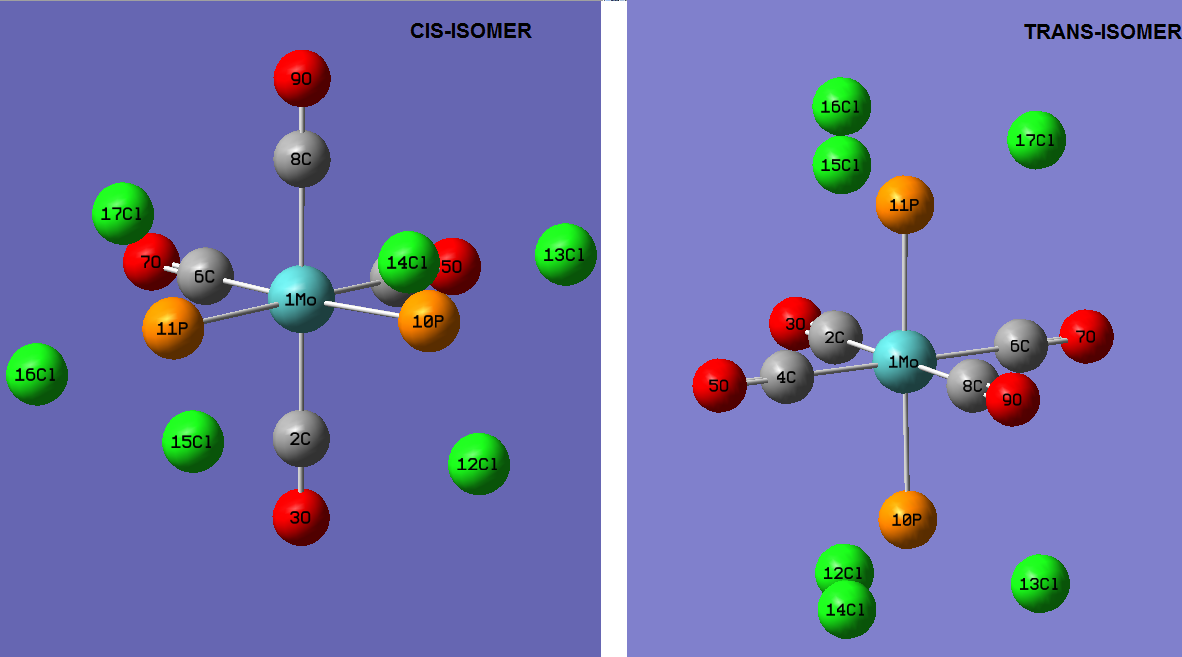
The initial optimisations of the both the cis and trans Mo(CO)4(PCl3)2 structure was run using the B3LYP method and a low level basis set and pseudo-potential : LANL2MB , so that the approximate geometry could be found. The convergence, relating to the first derivative of the energy was set to opt=loose since the criteria limits set are more accurate than the method used. Once the initial optimisation was completed, the torsion angle of the PCl3 groups was adjusted , see diagram below.
The new geometries were optimised using the B3LYP method with the LANL2DZ pseudo-potential and basis sets and to increase the electronic convergence limit the following phrase was inserted in the additional keywords section: "int=ultrafine scf=conver=9".
Re-Optimised Cis- Mo(CO)4(PCl3)2
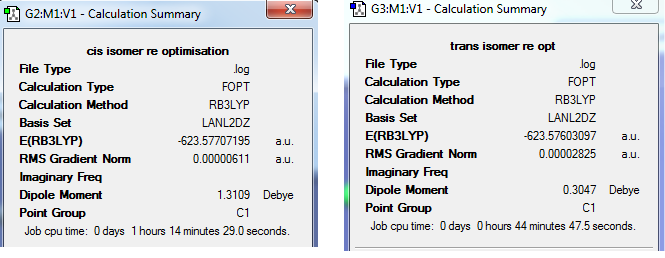
The calculation summary shows for the FOPT, RB3LYP calculation method, basis set LANL2DZ the final energy was E(RB3LYP)= -623.7707 a.u. , the gradient was 0.00000611 a.u., the dipole moment is 1.3109 Debye and the point group was C1. The .log output file also shows that the system forces have fully converged:
        Item               Value     Threshold  Converged?
Maximum Force            0.000013     0.000450     YES
RMS     Force            0.000005     0.000300     YES
Maximum Displacement     0.000778     0.001800     YES
RMS     Displacement     0.000188     0.001200     YES
Predicted change in Energy=-5.704204D-09
Optimization completed.
   -- Stationary point found.
Cis Isomer Job CPU time: 1 hour 14 minutes 29.0 seconds Cis re_opt: DOI:5368 LINK http://hdl.handle.net/10042/to-5368
Re-Optimised Trans- Mo(CO)4(PCl3)2
The calculation summary shows that for the FOPT, RB3LYP calculation method, basis set LANL2DZ the final energy was E(RB3LYP)= -623.5760 a.u., the gradient was 0.00002825 a.u., the dipole moment is 0.3047 Debye and the point group was C1. The .log output file also shows that the system forces have fully converged:
        Item               Value     Threshold  Converged?
Maximum Force            0.000061     0.000450     YES
RMS     Force            0.000018     0.000300     YES
Maximum Displacement     0.001218     0.001800     YES
RMS     Displacement     0.000232     0.001200     YES
Predicted change in Energy=-7.124748D-08
Optimization completed.
   -- Stationary point found.
Trans Isomer Job CPU time: 44 minutes 47.5 seconds Trans link: DOI:5369 http://hdl.handle.net/10042/to-5369
Geometric Comparisons
The image below shows the re-optimisation calculation summaries for the cis and trans Mo isomers.
 File:Image:Movie cis.gif
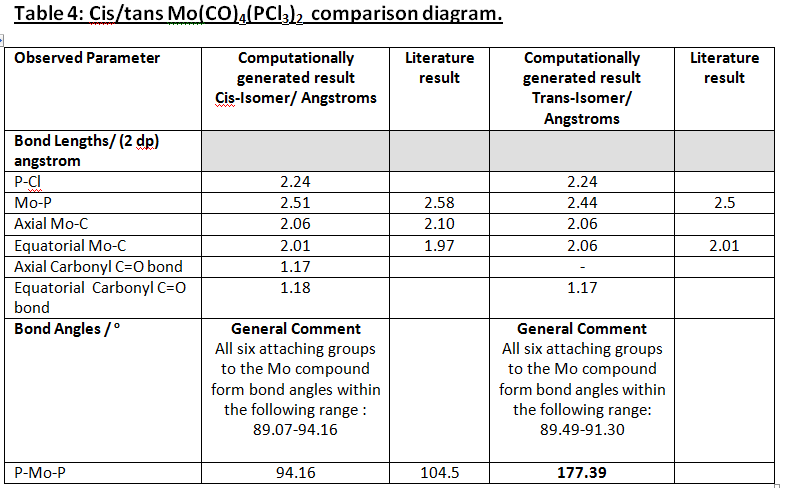
In general the experimental versus literature bond lengths are very similar with the exception of a few subtle difference. It is important to realise that the literature values obtained were for the Mo(CO)4(PPh3)2 complex, so comparison must be made with caution. For example the Mo-P bond lengths in the cis and trans isomers are slightly lower than the literature value. This infers that these Mo-P bonds are slightly stronger than those in the Mo(CO)4(PPh3)2 complex. This could be because in Ph groups, relative to Cl atoms, are more electron withdrawing (due the pi electron density above and below the Ph rings) which may cause electron bonding density to be removed from the Mo-P bonds. Also, the experimental results show that the Mo-P bond in the cis isomer is slightly longer than that in the trans isomer (0.07 Angstroms). This means that the Mo-P bond is slightly weaken in the cis form compared to the trans form. The longer Mo-P bond in the cis form may also help to reduce the unfavourable steric interactions with the PCl3 group.
In the cis isomer the P-Mo-P angle is 94.16 degrees which is reasonably close to the ideal 90 degree octahedral angle. The P-Mo-P angle in the trans isomer is 177.39 degrees, which is close to the expected ideal 180 degrees for trans octahedral complexes. According to literature studies (3) based on cis- Mo(CO)4(PL3)2 where L=phosphine or a phosphate (which produces a large cone angle) the Molybdenum complex is highly distorted from the standard octahedral geometry about the Mo center. Evidence of strong distortion can be observed from the unusually large P-Mo-P bond angle 104.5 degrees. However in the Mo(CO)4(PCl3)2 complex there is little distortion from the ideal 90 degree P-Mo-P angle (experimentally P-Mo-P is 94.16 degrees). The geometry is not as severely distorted from the ‘ideal’ compared to the Mo(CO)4(PL3)2 complex hence this may explain may the cis/trans energy difference is not as great as the literature difference. To extend this investigation further it may be interesting to test the computational geometry optimisation method on other ligands with similar electronic properties to PPh3. For example, ideally I would test the optimisation calculation again using L=PPh2Me which has similar electronic behaviour to PPh3. I chose to this particular ligand modification since literature studies have reported the presence of conformational interligand non-bonding interactions that may occur leading to the preferential cis isomer formation. As a result it is expected that the co-ordination atmosphere around the Mo atom remains close to standard octahedral. This theory could be tested by measuring the P-Mo-P angle, a value close to 90 would be expected.
Frequency Comparison
Frequency Results
It is important to realise that there is a frequency systematic error of around 10%, because the harmonic approximation is used for vibrations that are actually anharmonic. Also, convention state that intensities are rounded to the nearest whole integer.
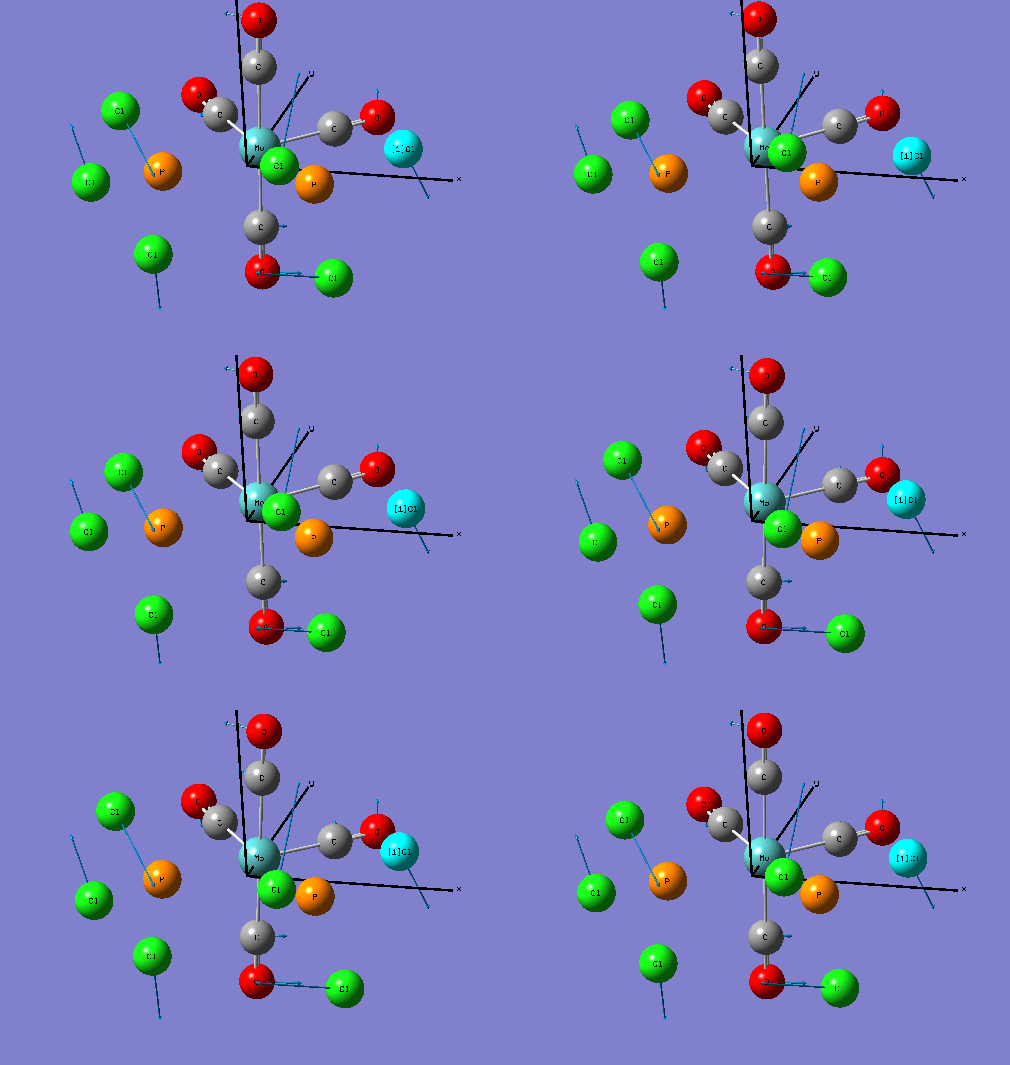
The vibrations displayed in table two show the lowest two vibrations for both the cis and trans isomers. For all of the illustrated lowest frequency vibrations, the PCl3 ligand group is rotating around the Mo-P bond. A rotational type of motion is more likely than a bond wagging/stretching/bending motion since the energy requirement for these associates is much greater.
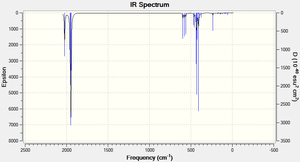
The Cis isomer IR spectra shows that there are four main peaks:
| Number | Frequency (cm-1) | Intensity | Literature Frequency Values based on the Mo(CO)(PPh3)2 complex(cm-1)(1) | ||
|---|---|---|---|---|---|
| 1 | 1945 | 763 | 1867 | ||
| 2 | 1949 | 1498 | 1896 | ||
| 3 | 1958 | 633 | 1924 | ||
| 4 | 2023 | 597.93 | 2026 |
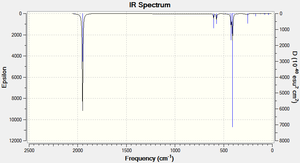
The Trans isomer IR spectra shows that there are three main peaks:
| Number | Frequency (cm-1) | Intensity | Literature Frequency Values(cm-1)(1) | |
|---|---|---|---|---|
| 1 | 409 | 728 | - | |
| 2 | 1950 | 1475 | 1889 | |
| 3 | 1951 | 1467 | 1889 |
Analysis of frequencies, refer to tables 2 and 3
Cis-Isomer Frequency D Space: DOI:5374 http://hdl.handle.net/10042/to-5374 Cis .log frequency output file Low frequencies --- -1.8508 -0.0004 0.0003 0.0007 0.8654 1.3638
Low frequencies ---   10.7377   17.6156   42.0478
Harmonic frequencies (cm**-1), IR intensities (KM/Mole), Raman scattering
Trans-Isomer Frequency D Space: DOI:5375 http://hdl.handle.net/10042/to-5375 trans .log frequency output file Low frequencies --- -2.2092 -1.6027 -0.0005 -0.0004 -0.0001 3.1319
Low frequencies ---    5.1308    6.1917   37.2051
Harmonic frequencies (cm**-1), IR intensities (KM/Mole), Raman scattering
The carbonyl stretching region in IR spectroscopy typically occurs in the 1540-2000 cm-1 region. The position of the CO stretching band is influenced by several factors including: physical state, mass and electrical effects from neighbouring substituents and conjugation.
The symmetry of the complex determines the number of expected CO vibrational stretches observed in the IR spectrum. Typically, the greater the symmetry of a complex the fewer the number of IR bands expected. The cis isomer (C2v symmetry) is expected to exhibit four CO bands whereas the trans isomer (D4h) is expected to exhibit just one active IR band. The computational results show that there are four CO stretches in the cis IR, all with reasonably high intensities, and the trans isomer seems to have three CO stretches with reasonable intensities; however the frequencies 1950 and 1951 both with intensities 1467 and 1475 are very similar hence once can assume these vibrations constitute just one CO stretch band. Also, the trans CO stretch at 409 cm-1 has an intensity that is almost half of frequencies 1467 and 1475 so it is less important. Therefore, the experimental trans IR spectrum really just has one main peak, this is expected since the trans complex has a higher degree of symmetry than the cis isomer.
The re-optimised Cis-isomer Mo(CO)4(PCl3)2 has an energy equal to E(RB3LYP)= -623.57707195 a.u. whereas the re-optimised Trans-isomer Mo(CO)4(PCl3)2 has an energy equal to E(RB3LYP)= -623.57603097 a.u. Since both structures contain the same number and type of atoms these energy values can be compared with consistency. The cis isomer is 0.00104098 a.u. lower in energy than the trans form, which equates to 2.733092 kJ/mol energy difference. This suggests that the cis isomer is thermodynamically more stable. In this investigation Cl atoms were substituted in place of phenyl rings which required costly computer resources. It has been shown that the electronic properties of Cl atoms are similar to phenyl rings, however from a steric perspective the Cl atoms are perhaps smaller. Literature studies based on the more common Mo(CO)4(PPh3)2 complex, have shown that when density functional calculations are performed on the cis and trans isomers, in the gas phase the cis conformer is electronically more stable than the trans conformer (72.98 kJ mol-1 more stable). Ref (2) The computational Cis-Trans energy difference is quite a lot lower than the experimental literature value. The main reason for this difference could be in our experiment we replaced PPh3 ligands for PCl3 ligands. The Phenyl groups are much larger than the chlorine atoms hence there is likely to be much more steric hindrance caused by the sheer bulk of the three phenyl rings leading to a higher energy difference between the cis/trans isomers. In order to make the trans Mo(CO)4(PCl3)2 complex isomer more stable than the cis isomer one must replace the chlorine atoms with bulkier groups since this would raise the steric repulsion interactions forcing the ligands to move further apart from each other.
To test how the bulk properties of the R groups in PR3 effects the cis/trans isomerisation dominance in Mo(CO)4(PPh3)2 , the chlorine atoms around the phosphorous could be replaced with various R groups each with different ‘bulkiness’. The energy differences between the cis and trans isomers can then be observed. Examples of R groups could include Et3 , CH3, (n-Bu)3.
Literature References: 1. J. Shamir,A. Givan,M. Ardon,G. Ashkenazi, Vibrational spectra of the cis and trans isomers of the Mo(CO)4(PPh3)2 complex
2. Journal of Chemical Crystallography Vol34, No. 6, June 2004 http://www.springerlink.com/content/u5383x017700g761/fulltext.pdf
3. http://pubs.acs.org/doi/pdf/10.1021/ic00134a075
___________________________________________________________________________________________________________________________________
Mini Project



Molecules to be modelled:
Molecule A: CH3NH2 Molecule B: CH3PH2 Molecule C: CH2ClNH2 Molecule D: CH2ClPH2
Background
For calculations including: geometry optimisation, frequency analysis, energy analysis and NBO analysis the following criteria was implemented using Gaussian:
Method: Ground state MP2 Basis set: 6311g (d,p) [include all electrons] The above criteria was specifically chosen as the molecules A-D are relatively small thus the computational time required to process these calculations is not very long. The above criteria also allows more accurate calculations to be made. The initial geometry optimisation was successful as the .log output files for molecule A-D all showed that the forces has converged. The following text was displayed in molecules A-D out put .log file:
        Item               Value     Threshold  Converged?
Maximum Force            0.000240     0.000450     YES
RMS     Force            0.000064     0.000300     YES
Maximum Displacement     0.000616     0.001800     YES
RMS     Displacement     0.000319     0.001200     YES
Predicted change in Energy=-1.275400D-07
Optimization completed.
   -- Stationary point found.
AIMs: 1. Compare structures A and B substituting a Nitrogen atom with a Phosphorus atom – LONE PAIR/CHARGE DISTRBUTION 2. Observe the effects of introducing a halogen atom into the system AC [the C-N and C-P Bond lengths in the presence/absence of Cl atoms] 3. Observe the effects of substituting a nitrogen for a phosphorus on the C-Cl bond length/ bond angles/IR frequencies - To think about reasons why this occurs, what are the similarities and difference between the N/P and their interactions with Carbon (molecular orbitals) 4. Generally comparisons/trend: IR look for key stretches (change in dipole vs change in polarizability Raman etc), 5. If time try changing the basis set method i.e. to a less accurate B3LYP etc. To see if a change in frequencies
1. Compare structures A and B... substituting a Nitrogen atom with a Phosphorus atom
- REACTIVITY:
Typically methylamines are nucleophilic due to the availability of the lone pair on the nitrogen atom.
The lone pair typically binds to electron deficient electrohpilic species. The mechanism is usually either SN1 or SN2 depending on the steric bulk of substituent’s on the electrophile. Since the methyl group ( CH3 ) on the nucleophile is relatively small, provided the electrophile is not very ‘bulky’ and the correct solvent conditions are used the mechanism will tend to be SN1.
Energy comparisons [Analysis based on Energy method .log file information]
Generally, the lower the relative energy of a molecule the more thermodynamically stable the molecule is. The greater the thermodynamic stability of a molecule , the less reactive it is likely to be. To investigate this idea it is important to compare the computed molecular orbital diagrams so that the electron density distribution area can be compared. Also it is important to look at the characteristics of the orbital where the lone pair on the Nitrogen and Phosphorus atoms is located. This will allow the relative stability of the lone pair to be understood better hence a more informed prediction of the nucleophilic reactivity differences can be made.
NBO Atomic Charge Distribution
The NBO analysis allows the atomic charge distribution for each molecule to be seen using a relative colour scale, whereby bright red indicated highly negative charge and bright green indicates highly positive charge. The charge numerical scale was set to +1.0 to -1.0 for all four molecules (A, B, C and D) so that easy colour comparisons can be made.
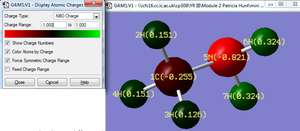
Molecule A : The nitrogen atom has the most negative charge in the molecule (-0.821). The difference in charge between C and N is ( 0.566). According to literature Pauling Electronegativity values N (3.04) and C (2.55) the electronegativity is 0.49, this suggests that the computational energy method slightly overestimates the atomic charge difference.
The charge difference between the hydrogen atoms bonded to the nitrogen atom, H(6) and H(7) are relatively more positively charged compared to the hydrogen atoms bonded to the carbon atom, H(2), H(3) and H(4). This trend is likely to be due to the greater charge difference between N-H (6/7) (difference: 1.145) atoms relative to the C-H atoms ( difference: 0.640 whereby an average ‘H’ charge is used to calculate this C-H difference, the individual H atoms 2,3 and 4 charges are summed and dived by three to acquire the average H atom charge). Hydrogen atoms (2), (3) and (4) are all located on the carbon atom however their charges differ slightly. In order to understand why this charge difference occurs it is necessary to analyse the relative positions of reach hydrogen atom with respect to the nitrogen atom.
Hydrogen atoms (2) and (4) have the same charge which is more positive than H(3) possibly because their H-C-N angles are both 109. 1° (1dp) whereas as the H(3)-C-N angle is 115.2° (1 dp). Since H’s (2 and 4) are closer to the nitrogen atom the electronwithdrawing effect from the nitrogen may be more prominent hence the charge on these H atoms is more positive.
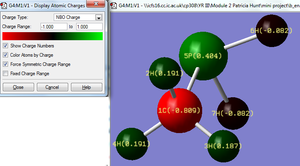
MOLECULE B: The carbon atoms has the most negative charge in the molecule (-0.514). The phosphorus atoms has the most positive charge (0.288). The difference in charge between C and P is (0.802). According to the Pauling electronegativity scale the C-P charge difference is (0.36). The hydrogen atoms (6) and (7) located on the phosphors atom have a more negative charge than hydrogens (2), (3) and (4). This difference is likely to be due to phosphorus having a relatively more electropositive nature than carbon. It is interesting to compare hydrogens’ (2), (3) and (4) which are all located on the same carbon atom and all have C-H bond lengths equal to 1.09 Å. Hydrogens (2) and (4) both have the same charge and the H-C-P angles are both 109.0° (1dp) whereas hydrogen (3) has a lower charge and its H-C-P angle is slightly greater 113.7° (1dp). This difference is unlikely to be due to the relative proximity from the electronegative carbon since the bond distances are all the same also the further away the H atom is from the electropositive P atom the lower the expected H charge would be; however interestingly the results oppose this idea. By substituting the nitrogen atom (molecule A) for a phosphorus atoms (molecule B) the charge difference between the carbon and heteroatom is greater in B.
Comparing the atomic charge distribution between molecules A and C:
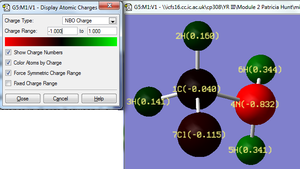
The substitution of a hydrogen atom bonded to the carbon atom in molecule A, for a chlorine atom (molecule C) effects the atomic charges on the remaining two carbon bonded hydrogens (2 and 3) ,see molecule C, whereas the charge on the hydrogen atoms (6 and 5) bonded to the nitrogen,see molecule C, are not affected. This shows that the presence of a strongly electronegative chlorine atom exerts increased electron withdrawing power within the methyl region only. Hydrogen (3) has a slightly lower charge than (2), (0.141 and 0.160 respectively, since the H(3)-C-Cl bond angle is smaller than the H(2)-C-Cl angle, 105.2 and 107.0 ° (1dp) respectively. The smaller the H-C-Cl bond angle the closer the hydrogen atom is to the chlorine atom hence the electron withdrawing effect is greater. Comparing molecule A and C, it is also interesting to observe how the charge of the carbon atom changes in the presence of the chlorine atom. The NBO analysis shows that in the presence of the chlorine atom the charge on the carbon becomes less negative ( carbon charge increases from -0.255 to -0.040) because the chlorine is very electronegative thus attracts electron density away from the carbon atoms.
Natural Bonding Orbitals: Lone Pair Analysis
The nitrogen atom in A has the most negative charge thus it is likely that the lone pair on the nitrogen atom will have nucleophilic character. Conversely, the phosphorus atom in B has a positive charge thus the lone pair on the phosphorus is unlikely to have much or any nuecleophilic character.
The "Bond orbital/ Coefficients/ Hybrids" section of the ‘Natural Atomic Orbital and Natural Bond Orbital Analysis’ section of the .log file molecule A shows that the lone pair on the Nitrogen atom has 21.78% s character and 78.18% p character, whereas the lone pair on the Phosphorus atom (molecule B) has 51.33% s character and 48.66% p character. This implies that the lone pair on Nitrogen is located in an orbital with approximately sp3 character whereas the lone pair on Phosphorus is located in an orbital with approximately sp character. Since the Phosphorus lone pair is located in an orbital with 56.4% greater s character, this lone pair is lower in energy hence it is relatively more stabilised. The increased stability of Phosphous atom lone pair leads to reduced ease of lone pair donation hence less nucleophilic character is likely. The nature of the Carbon – Hetero atom bond The "Bond orbital/ Coefficients/ Hybrids" section of the NBO analysis also shows that in molecule B 61.47 % of the C-P bond is contributed from carbon orbitals with hybridisation s ( 26.18%) , p( 73.61%) and d (0.20%). This is expected since the atomic charge distribution diagram shows that Carbon has the most negative charge value. Conversely, molecule A only 39.96% of the C-N bond is contributed from carbon orbitals with hybridisation s( 26.97%), p 2.70( 72.82%) and d (0.21%); hence the majority of the C-N originates from nitrogen orbitals, which is expected since nitrogen has a lower energy atomic charge. Generally, when focusing on bonding interactions the greater orbital contribution stems from the more electronegative atom.
It is important to realise that in NBO analysis orbitals are initially associated with single atoms hence it is assumed that core orbitals and lone pairs are localised hence the term natural atomic orbtials. The next stage of NBO analysis involves adjusting bonding orbitals between atoms so that they are localised using the basis set atomic orbitals of the given atoms only. The final stage involves identifying the Rydberg type orbitals and all the orbitals are made orthogonal to each other. Therefore NBO analysis represents an orbital description that relates closely to the lewis structure of the molecule. Since this method employs a ‘localisation’ assumption, it is possible to adopt hybridised properties to the atomic lone pairs and one can also identify the weighted contribution and character of individual atoms in a given bond. Although most
The main difference between density functional theory (DFT) and Molecular Orbital (MO) theory is that DFT optimises an electron density whereas MO theory optimises a wave function. Since MO theory treats electrons as being delocalised, it would be interesting to compare the HOMO MO computed diagrams for molecules A and B based on the flowing criteria : MP2 and 6-311G(d,p). The MOs show that for both molecule the singly degenerate HOMO contains a pair of electrons. The energy level of the HOMO electrons in molecule A is -0.389 a.u. whereas in molecule B the energy is -0.362 a.u. Since the energy of the HOMO electrons is higher in molecule B one would expect the reactivity of molecule B to be greater, although according to NBO theory the opposite prediction is made. Since most chemical reactivity concepts are more local in nature the NBO analysis may provide a better justification of the reactivity of molecules A and B.
2. Observe the effects of introducing a halogen atom into the system AC Focus: C-N bond lengths/ C-H bond lengths/ angles
The C-N bond length in methylamine, molecule A, is 1.46381 however on substitution of a methyl hydrogen atom for a chlorine atom the C-N bond length decreases to 1.43775. Shorter bond lengths usually correspond to stronger bonds, thus on substituting a hydrogen for a chlorine atom the number of electrons in the system increases hence there may be more favorable electron nuclei intereactions present between the nitrogen carbon atoms leading to a shorter, stronger bond. Comparing the H-N-H bond angles molecule A : 105.767 dergrees and molecule C: 108.298 degrees. This shows that in the presence of chlorine the H-N-H angle expands slightly this could be due to possible inductive effects exerted by the chlorine atom.

3. To describe and analyse the MO diagram of molecule C and explore how the MO’s change when a phosphorous atom replaces the nitrogen atom?
Molecule C MO computed diagram- General observations (MO Structures viewed at Iso-value 0.02) Molecule C generates a total of 17 MO’s (why are there not 6 6 Ao’s=6MO’s). The lowest lying MO has an energy -104.816 a.u.. At iso-value 0.02 the MO area was not visual in Guass view, so the iso-value varied until a molecular orbital was visible however no appropriate value was found, given the time limits. This may be an interesting area to explore in further detail. The energy gap between the lowest lying MO and the second lowest (-15.559 a.u.) is very large relative to the higher energy gaps this could be because due to the core electron properties being more stable than the valence electrons since they are located closer to the nuclei, the coloumbic interactions are stronger.
The second MO (energy -15.559 a.u.) has a spherical ‘s’ like orbital shape. The electron density in the second MO is delocalised only around the nitrogen atom. This shows that the nitrogen atom stabilises negative charge the best relative to carbon, chlorine and nitrogen. The third MO (energy -11.326 a.u.) has a spherical ‘s’ like orbital shape and the electron density is delocalised only around the carbon atom.??(strange as you would expect chlorine to have a more electron stabilising nature?) The fourth MO (energy -10.543 a.u.) has a spherical ‘s’ like orbital shape. The electron density in the third MO is delocalised only around the chlorine atom.
MO’s 5, 6 and 7 (energies -8.011, -8.009 and -8.008 respectively a.u.) are the first MO to exhibit ‘p’ (two phase lobe) orbital character located on the chlorine atom only. The energies of all these MO’s is -8.01 (2dp) a.u. which suggests that these MO’s are all degenerate ‘p’ MO’s in the x/y/z directions. MO 8 (energy -1.221 a.u.) shows all in phase atomic orbital interactions from all constituent atoms in molecule C.
Comparing the HOMO/LUMO of molecule C and D it is evident that there is a large nodal region (region of no electron density) in molecule D whereas in molecule C the MO distribution is far more compact, see image titled : HOMO comparison Molecules C and D.
3. Observe the effects of substituting a nitrogen for a phosphorus [C D] on the C-Cl bond length
Optimised Structures Molecule C Computational value: N-C bond length= 1.44 angstroms C-Cl bond length= 1.79 angstroms Dihedral angle (1)Cl-(2)C-(3)N-(4)H = 76.3 degrees
Literature value: N-C bond length= C-Cl bond length=
Molecule D Computational value:
P-C bond length= 1.86 angstroms C-Cl bond length= 1.78 angstroms Dihedral angle (1)P-(2)C-(3)N-(4)H = 76.0 degrees
Literature value: P-C bond length= C-Cl bond length=
The in the presence of phosphorus the C-Cl bond length decreases slightly which implies that the strength of the C-Cl bond increases slightly. This increase in bond strength could be due to some electron density donation from the phosphorus p orbital into the carbon p orbital region.
Vibrational Analysis
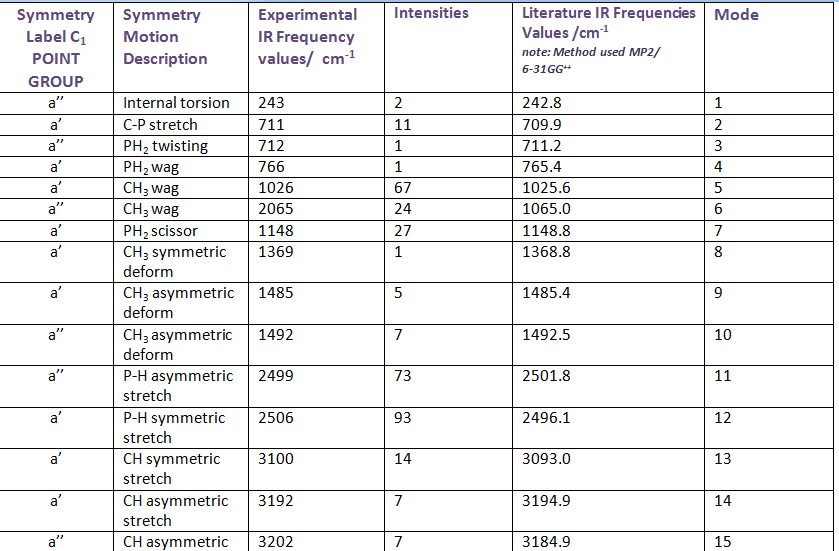
Table 1: Vibrational frequency summary chart of all 15 molecule B vibrations
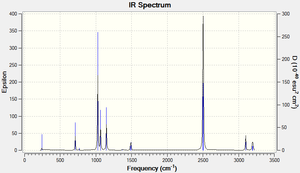
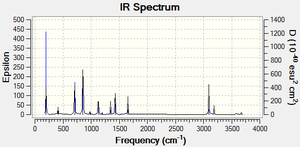
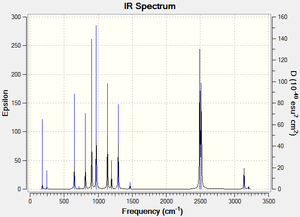
The IR frequency results for molecule B show that all the interactions are non degenerate with Cs symmetry. There are 15 different vibrational modes in total, nine of which have a’ symmetry and six of which have a’’ symmetry. The most intense vibrations are: P-H symmetric stretch (2506 cm-1) P-H asymmetric stretch (2499 cm-1) and CH3 wag (1026 cm-1). When one of the hydrogen atoms on the methyl group is replaced for a chlorine atom (molecule D) , the IR experimental results show that there are still 15 active IR modes. The most intensive frequencies occur at 2492 cm-1 (mode 12, asymmetric P-H stretching) and 2513 cm-1 (mode 13, symmetric C-H stretching) (intensities: 74 and 62 respectively). Comparing the IR spectrums of molecule B and D, both molecules have the most intense absorptions around the 1020 cm-1 and 1250 cm-1 region which corresponds to methyl based wagging and P-H symmetric stretching. In contrast, the presence of the chlorine atom seems to lead to more peaks in the 650- 900 cm-1 range, which is typically characteristic of C-Cl alkyl halide stretching. The frequencies due to the C-Cl absorptions are: 619,719,813, 907 and 972 cm-1. According to literature aliphatic C-Cl absorption is observed in the broad region between 850 and 550 cm-1 . It would be interesting to experiment with different halogen atoms in place of the chlorine atom in molecule D so that IR spectral changes can be observed. For example, Fluorine containing compound generally absorb strongly in the 1400-1000 cm-1 region due to the C-F stretching modes. Also, it would be interesting to vary the number of halogen atoms e.g. mono-halogenated, di, tri... so that the changes in band patterns can be analysed. Molecule C, point group C1, contains 15 vibrational IR modes. The IR spectrum contains characteristic IR absoprtions at : 706, 854 and 978 cm-1 corresponding to C-Cl stretching, similar to molecule D. The most intensive peaks occur at mode 4, 854 cm-1 , intensity 137, see animation. The main difference between C and D is that there are N-H stretching vibrations present at 3669 cm-1 ( asymmetric stretch) and 3567 cm-1 (symmetric stretch), however the intensity of these vibrations is not very large ( 6 and 3 respectively).
| Mode | Form of the Vibration | |
|---|---|---|
| 1 | File:B 1.gif | |
| 2 | File:B 2.gif | |
| 3 | 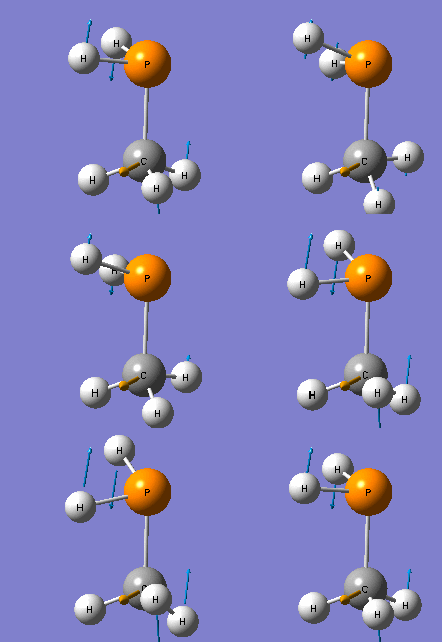
| |
| 4 | 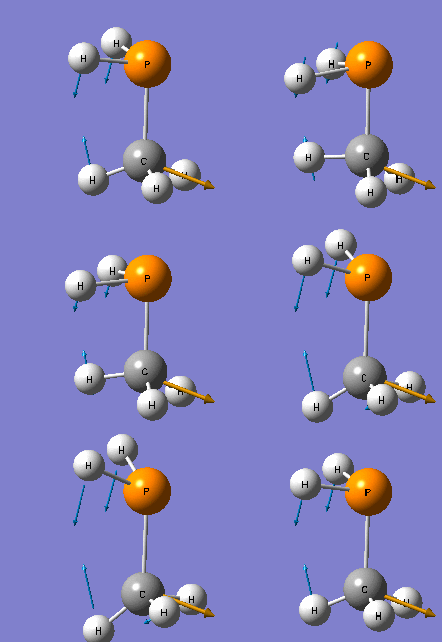
| |
| 5 | 
| |
| 6 | 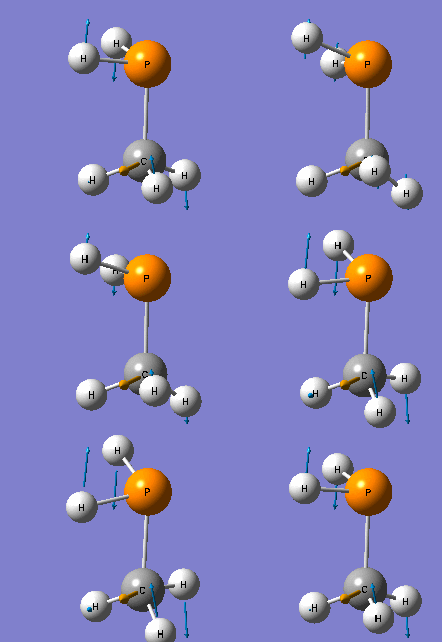
| |
| 7 | 
| |
| 8 | 
| |
| 9 | 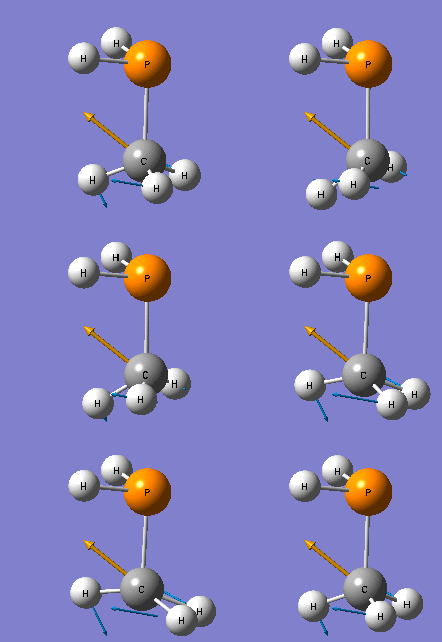
| |
| 10 | 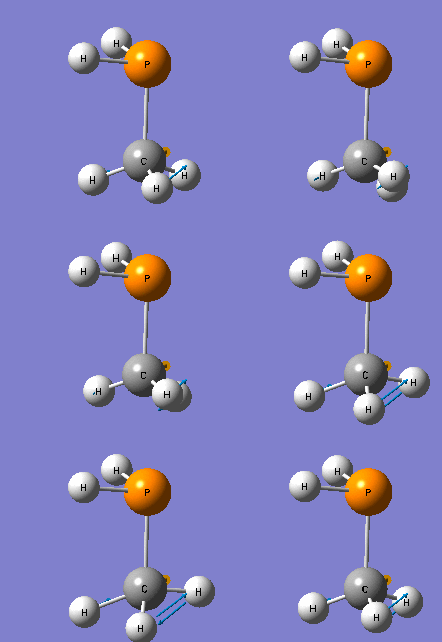
| |
| 11 | 
| |
| 12 | 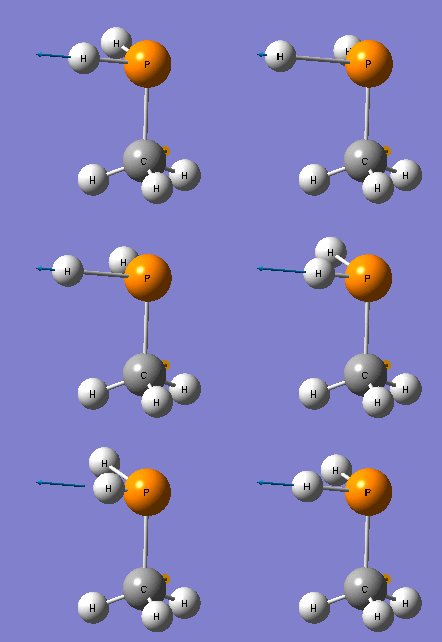
| |
| 13 | 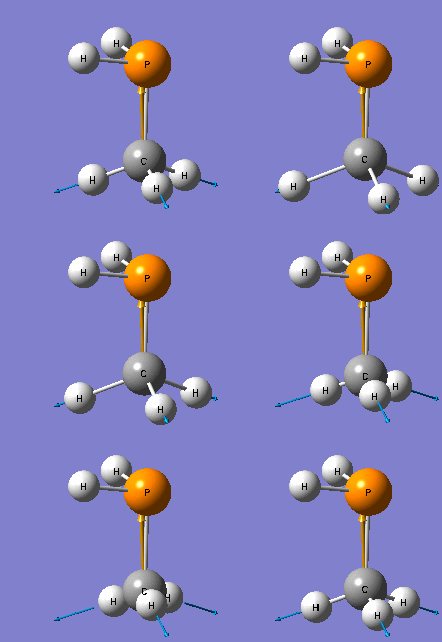
| |
| 14 | 
| |
| 15 | 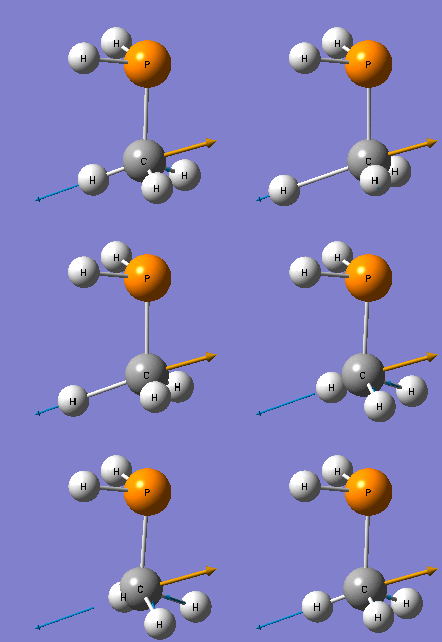
|
| Mode | Form of the Vibration | |
|---|---|---|
| 7 | File:D 972.gif | |
| 6 | File:D 907.gif | |
| 5 | File:D 813.gif | |
| 4 | File:D 719.gif | |
| 3 | File:D 648.gif | |
| 12 | File:D mode12 2492.gif P-H a stretch | |
| 13 | File:D mode13 2513.gifCH s stretch |
| Mode | Form of the Vibration | |
|---|---|---|
| 4 | 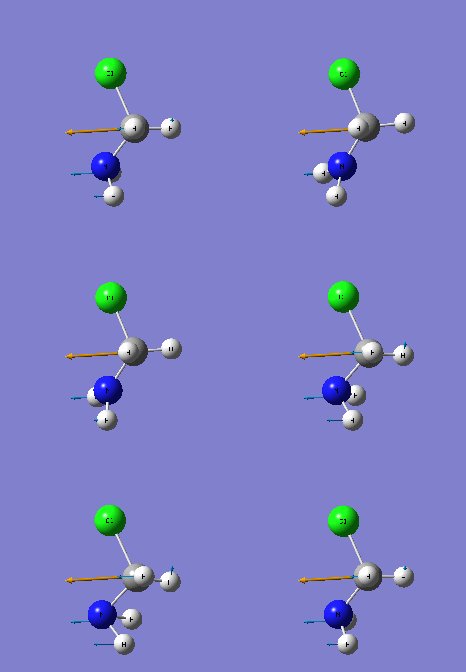 Most intensive IR peak Most intensive IR peak
| |
| 15 | 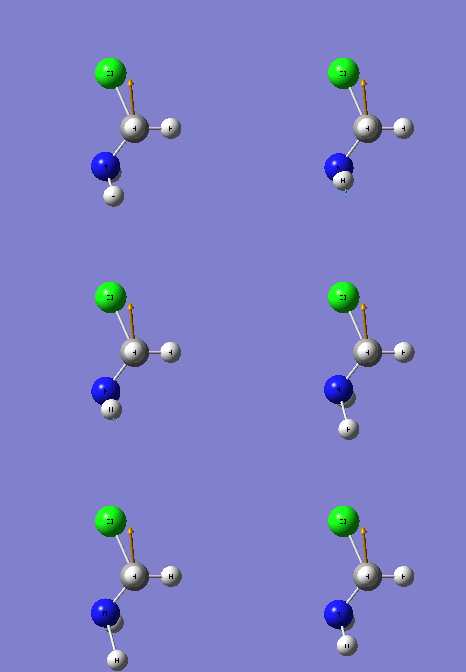 C-N a stretch C-N a stretch
| |
| 16 |  C-N s stretch C-N s stretch
|
References:
Electronegativity: Huheey, J.E. Inorganic Chemistry ; Harper & Row: New York, 1983.
R. M. Silverstein, F. X Webster, Sixth Edition, Spectrometric Identification of Organic Compounds


