Rep:Mod:steph280
The transition state structures of pericyclic reactions were investigated using Gaussian 09W computational program. Reaction pathways and barrier heights were calculated and through modelling potential energy surfaces, stationary points were located, indicating reactants, products or a transition state.The Cope Rearrangement of 1,5-hexadiene was explored and it was found that the chair conformer was favoured, supported by activation energy calculations. Diels-Alder cycloadditions were also investigated and regioselectivity aspects were introduced. It was found that the cycloaddition of maleic anhydride and cyclohexa-1,3-diene favoured to approach each other in an endo fashion due to the secondary orbital overlap effect and a lower transition state relative to that found in the exo pathway. Calculations made were compared to experimental and literature values.
Introduction
The Woodward Hoffmann rules are used to analyse the orbital interaction of reactants involved in pericyclic reactions under thermal control and hence predicts the cyclic structure of the transition. The rules state: [1]
In an open- chain system containing 4n π- electrons, the symmetry of the highest occupied ground state orbital is such that a bonding interaction between the termini must involve overlap between orbital envelopes on the opposite faces of the system and this is achieved in a conrotatory process. Alternatively, in an open- chain system containing 4n +2 π- electrons, the terminal bonding interaction within ground state molecules requires overlap of orbital envelopes on the same face of the system, attainable only by disrotatory displacement.
Computational Methods
It is known amongst scientists that it is virtually impossible to isolate transition states experimentally, however advances in computational simulation of molecules have allowed scientists to explore transition state species in greater depth. Three different methods were utilised in this experiment, varying in degree of approximation. The least accurate method was the semi-empirical Austin (AM1) method which does not require an atomic orbital basis set to be specified. The Hartree Fock (HF) method was also used which is more accurate as it requires a minimum basis set, STO-3G. The Hartree Fock equation, including the Coulomb operator and the exchange operator, treats each electron independently in a potential field of other electrons. The most accurate calculation method employed was the Density Functional Theory (DFT) which is an enhanced version of the HF method but also included exchange- correlation potential (B3LYP) due to spin and charge of surrounding electrons. [2] When simulating reaction pathways and calculating energetic changes, the method employed depended on the complexity of the reactants involved , time taken for the calculation to complete and resources available.
Very indepth into you have clearly gone beyond the script
The Cope Rearrangement

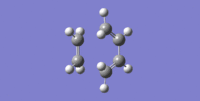
The Cope rearrangement of 1,5-hexadiene as shown in Figure 1 is a sigmatropic rearrangement involving 4 π electrons, hence employing Woodward Hoffmann rules, the orbitals at the termini move with conrotatory displacement. Due to free rotation of the three central single C-C bonds, there are many possible conformers of 1,5-hexadiene. Therefore the reaction can proceed through a “chair” or “boat” transition state structure. The experiment involved modelling multiple conformers to find that of the lowest energy. The hypothesis stated that an anti conformer, such as the conformation displayed in Figure 2, has the lowest energy due to the C=C bonds orientated 180° relative to each other, hence electron density located the furthest distance apart. However this was proven wrong using modelling simulations of other conformers.
Optimisation of 1,5-hexadiene Conformers
Anti Conformer of 1,5-hexadiene
Using Gaussian 09W and GaussView 5.0, the anti conformer of 1,5-hexadiene, was drawn by setting the dihedral angle to 180o. After performing the cleaning function, the molecule was optimised at HF/3-21G level of theory and the results can be found in Table 1 below. The molecule was then symmetrised to find the point group which was C2.
Gauche Conformer of 1,5-hexadiene
Similarly, the gauche conformer was drawn by setting the dihedral angle to 60o. After being cleaned, the molecule was optimised at HF/3-21G level of theory and the results can be found in Table 1. The point group of the molecule was C1.
Anti1 Conformer of 1,5-hexadiene
Another anti conformer of 1,5-hexadiene was drawn and optimised at HF/3-21G level of theory; the results are displayed in Table 1. As this reactant conformer had the lowest energy, this was used as a reference to compare. The point group of the molecule was Ci. The molecule was then re-optimised using DFT B3LYP/6-31G* hence a small change in energy as seen in Table 1.
Table 1. A table displaying results after geometry optimisations of 1,5-hexadiene conformers
| Conformer | Optimised Structure | Level of Theory | Point
Group |
Energy/ Hartrees | Relative Energy/ kcal/mol | Log Files | ||
|---|---|---|---|---|---|---|---|---|
| Anti | HF/3-21G | C2 | -231.69260235 | 0.04 | Anti | |||
| Gauche | HF/3-21G | C1 | -231.69266121 | 0.00 | Gauche | |||
| Anti1 | HF/3-21G | Ci | -231.69253526 | 0.08 | Anti1(3-21G) | |||
| Anti1 | DFT B3LYP/6-31G* | Ci | -234.61171166 | Anti1 (6-31G̈) |
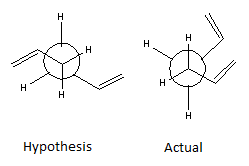
From the results in Table 1, the lowest conformation was found to be a gauche structure proving the hypothesis to be wrong. This was an unexpected result due to the observable steric clash of C=C bonds as illustrated in the Newman projection in Figure 2. It was found that there was a stabilising interaction between the π orbitals of the unsaturated carbon bonds and the vinyl protons, resulting in a reduced energy.[3]
Nf710 (talk) 11:02, 5 November 2015 (UTC) you could have proved this by looking at the orbitals in the .chk file and you would have been able to see graphically that there is secondary orbital overlap
Comparing Levels of Theory
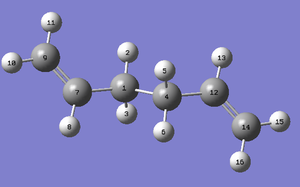
The levels of theory used were HF/3-21G and B3LYP/6-31G*. As previously mentioned in section 1.1 Computational Methods, B3LYP/6-31G* calculations are of greater accuracy due to using DFT method. To compare these two methods, Anti1 molecule was used. Figure 3 illustrates Anti1 conformer with labelled atoms. Certain bond distances are displayed in the table below. The bond distances at B3LYP/6-31G* are closer to the literature values [4] overall as expected. The differences between the bond distance of C7-C9 is comparatively large and may be attributed to the high bond order which can make modelling more difficult. Therefore, molecules containing high bond orders may benefit from being simulated using the DFT method.
| Atoms | HF/3-21G/ Å | B3LYP/6-31G*/ Å | Increase/Decrease |
|---|---|---|---|
| C7-C9 | 1.3162 | 1.3335 | Increase |
| C1-C7 | 1.5089 | 1.5042 | Decrease |
| C1-C4 | 1.5530 | 1.5482 | Decrease |
The dihedral angle of four carbon atoms was also compared. Again a distinct difference was recorded when the DFT method was adopted.
| Atoms | HF/3-21G/ Å | B3LYP/6-31G*/ Å | Increase/Decrease |
|---|---|---|---|
| C9-C7-C1-C4 | 114.703 | 118.586 | Increase |
| C7-C1-C4-C12 | 179.994 | 180.000 | Increase |
| C1-C4-C12-C14 | 114.699 | 118.586 | Increase |
Nf710 (talk) 11:03, 5 November 2015 (UTC) It is meaningless to compare different levels of theory, their hamalotonians are totally different
Frequency Analysis of Anti1 Conformer
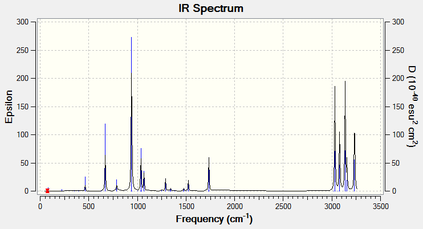
The thermochemistry of Anti1 conformer was also explored at B3LYP/6-31G*. There were 42 real and no imaginary frequencies reported, as expected and confirms that the optimisation was made to a minimum. The IR spectrum can be seen in Figure 4 and the log file can be found here.
| Energetic Values | B3LYP/6-31G* |
|---|---|
| Sum of Electronic and Zero-point Energies at 0 K | -234.4692 |
| Sum of Electronic and Thermal Energies at 298.15 K | -234.4619 |
| Sum of Electronic and Thermal Enthalpies | -234.4609 |
| Sum of Electronic and Thermal Free Energies | -234.5008 |
The sum of electronic and zero-point energies (ZPE) at 0 K can be expressed as E = Eelec + ZPE where Eelec is the electronic potential energy. The sum of electronic and thermal energies at 298.15 K and 1 atm of pressure can be expressed as (E = E + Evib + Erot + Etrans), including all the different modes of energy. The sum of electronic and thermal enthalpies inlcludes an RT term due to it being a measure of enthalpy, hence it equals (H = E + RT). Lastly the sum of electronic and thermal free energies includes entropic contribution (S), hence it equals (G = H - TS).
Nf710 (talk) 11:06, 5 November 2015 (UTC)Good explanation of the Energies. when doing a frequency analysis we are only typically interested if there is an imaginary frequency or not
Optimising Transition State Structures
Due to the rotation of single C-C bonds, there are multiple possible structures of the transition state; in this report they are referred to as "chair" and "boat" structures. Three methods were used to locate and optimise the geometries of the transition state.
Optimising Allyl Fragments
The approach taken in building the transition state structure was to split up 1,4-hexadiene into C3H5 allyl fragments. The allyl fragment was cleaned and optimised at HF/3-21G level of theory. The results of this geometry optimisation is shown in the table below and the log file can be found here.
| Optimised Structure | Level of Theory | Point Group | Energy/ Hartrees | ||
|---|---|---|---|---|---|
| HF/3-21G | C2v | -115.82304010 |
Optimising the "Chair" Transition State Structure at HF/3-21G using TS Berny Method
The next step in building the "chair" transition state structure, was to arrange two identical optimised allyl fragments so that the terminal carbons were 2.2 Å apart from each other. It was important to use the symmetrising function to achieve the best possible guess "chair" transition structure. A optimisation and frequency calculation was carried out on this structure at HF/3-21G and optimised to a transition state (Berny). Additional keywords "Opt=NoEigen" was included and force constants were set to "Once". The changes allow the calculation to locate a maximum on the potential energy surface and also continue the calculation even if imaginary frequencies are found, which is expected for a transition state structure. The results of this calculation are shown in the table below and the log file can be found here.
| Optimised Structure | Level of Theory | Energy/ Hartrees | Imaginary Frequency/ cm-1 | Animation of Imaginary Frequency | IR Spectrum | ||
|---|---|---|---|---|---|---|---|
| HF/3-21G | -231.61932235 | -818.09 | 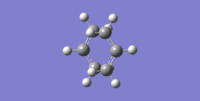 |
 |
Nf710 (talk) 11:11, 5 November 2015 (UTC) you have calculated these correctly however you havent really shown an understanding of what the imaginary freqiencies are. They come from the calculation of a negative force constant which then goes into the equation of a quantum vibronic oscillator which then when you try and square root a negative k gives you an imaginary fequency.
Optimising the "Chair" Transition State Structure at HF/3-21G using the Frozen Coordinate Method
The advantage of the the freeze coordinate method over the TS (Berny) method is that the guess transition structure must be close to the true structure in the TS (Berny) method in order for the optimisation to be successful. Hence for more complicated reactions, this may be more difficult to achieve. Therefore the frozen coordinate method is a more practical way of locating the transition structure. This method froze the terminal carbons 2.2 Å away from each other and minimised the remainder of the molecule. The terminal carbons were then unfrozen and a geometry optimisation (at HF/3-21G) to a transition state was carried out without calculating the force constants. Below are the results and the log file can be found here.
| Optimised Structure | Level of Theory | Energy/ Hartrees | Imaginary Frequency/ cm-1 | Animation of Imaginary Frequency | IR Spectrum | ||
|---|---|---|---|---|---|---|---|
| HF/3-21G | -231.61932232 | -817.76 |  |
 |
The TS (Berny) method and freeze coordinate method gave very similar results and the energies calculated have identical up to 7 decimal places. It is clear that the both methods produce reliable results for a simple reaction.
Optimising the "Boat" Transition State Structure at HF/3-21G using TS QST2 Method
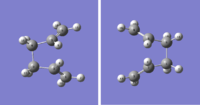
In this experiment, when finding the "boat" transition structure, the QST2 method was used. By modelling the reactants and products, the structure of the transition state was found by interpolation between the two input structures. The anti1 structure with Ci symmetry (in Section 2.1) was used as the reactant and product. In two separate windows the atoms were labelled carefully. The optimisation and frequency calculation was performed at HF/3-21G level of theory and selected the "TS(QST2)" method. Initially, there was some difficulty in a successful calculation as the geometry of the anti1 conformer did not resemble that of a "boat". However, the problem was overcome when dihedral angle between the central four carbons was set to 0° and the two inside angles between the three central carbons was set to 100 °. The table below represents the input structures and the suggested transition structure as the output. The presence of an imaginary frequency confirms that the correct transition state structure was found.
the log file can be found here.
| Input Strutures | Output Transition State | Energy/ Hartrees | Imaginary Frequency/ cm-1 | Animation of Imaginary Frequency | ||
|---|---|---|---|---|---|---|
 |
-231.60280968 | -840.27 | 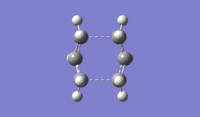 |
Nf710 (talk) 11:12, 5 November 2015 (UTC)Correct frequency and energy
Intrinsic Reaction Coordinate Method
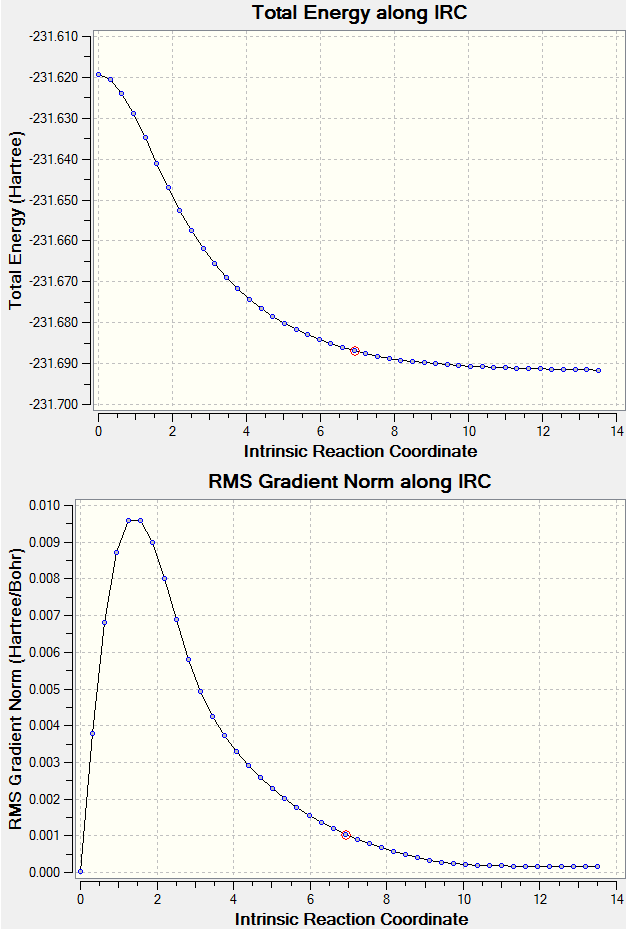
Despite locating the transition states and confirming their structures with vibrational frequency analysis, the conformer in which it proceeded from could not be inferred. IRC analysis follows the minimum energy path from the transition structure to a local minimum on a potential energy surface. The reaction path considered is the steepest descent from the transition structure maximum to the reactants and products. The calculation is ran as a sequence of constrained geometry optimisations, and this was set to 100 steps at HF/3-21G in this case. The reaction coordinate was ran forward only as the reactant and product are essentially the same. Below are graphs showing the results of this analysis. The 'Total Energy along IRC' graph displays the transition state as the maximum and indicates the calculation is ran until it locates a local minimum. The graph illustrating the change in gradient supports that the calculation began at a maximum and ended at a local minimum having the values of 0. The log file of this IRC calcuation can be found here.
| Reaction co-ordinate |
|---|
 |
Nf710 (talk) 11:15, 5 November 2015 (UTC) You dont need to do 100 steps as it would have converged, you can check this in the log file. Further more to find out which conformer it would going to you just need to look in the energy for the converged step which is found in the log file again
Reoptimisation and Activation Energy Analysis
The "chair" and "boat" transition state structures were repotimised to a higher level of theory, DFT/6-31G(d). and vibrational frequency analysis was also carried out. In Table 2 and Table 3 below are the thermochemical data and calculated activation energies obtained from geometric optimisation and frequency analysis at both HF/3-21G and B3LYP/6-31G(d) levels of theory.
The log file of the boat optimisation and frequency analyisis at DFT/6-31G(d) can be found here. The log file of the chair optimisation and frequency analyisis at DFT/6-31G(d) can be found here.
Table 2. A table diplaying thermochemical data obtained from frequency calculations at different levels of theory.
| HF/3-21G | B3LYP/6-31G(d) | |||||
|---|---|---|---|---|---|---|
| Electronic energy | Sum of electronic and zero-point energies | Sum of electronic and thermal energies | Electronic energy | Sum of electronic and zero-point energies | Sum of electronic and thermal energies | |
| at 0 K | at 298.15 K | at 0 K | at 298.15 K | |||
| Chair TS | -231.619322 | -231.466703 | -231.461343 | -234.556931 | -234.414909 | -234.408980 |
| Boat TS | -231.602802 | -231.450930 | -231.445302 | -234.543079 | -234.402360 | -234.396016 |
| Reactant (anti1) | -231.692535 | -231.539540 | -231.532566 | -234.611712 | -234.469215 | -234.461866 |
Table 3. A table diplaying calculated activation energies in kcal/mol at different levels of theory.
| HF/3-21G | HF/3-21G | B3LYP/6-31G* | B3LYP/6-31G* | Expt. | |
| at 0 K | at 298.15 K | at 0 K | at 298.15 K | at 0 K | |
| ΔE (Chair) | 45.70 | 44.69 | 34.08 | 33.19 | 33.5 ± 0.5 |
| ΔE (Boat) | 55.60 | 54.75 | 41.95 | 41.32 | 44.7 ± 2.0 |
As expected, the calculations ran at B3LYP/6-31G* level of theory produced results closer to the experimental values. It was also inferred that since the activation energy of the reaction path via a chair transition strucutre was lower, this would be the favoured route. A reason for the increase in energy of the boat transition state could be repulsion of the hydrogens n the flagpole positions. Both levels of theory agreed upon a lower chair transition state.
Nf710 (talk) 11:19, 5 November 2015 (UTC) your energies are correct but you haven't explicitly stated teh imaginary frequecies and you havent compared the geometries of different levels of theory therefore you havent come to the conclusion that you dont need a complex basis set for the geom, but you do for the Energies to be close to experiement. In all a good report but would have been nice if you had shown abit mroe understanding behind optimisations and DFT/HF.
Diels Alder Cycloaddition
In this section of the experiment, Diels Alder reactions were simulated and explored. Cycloadditions are a class of pericyclic reactions and proceeds via a cyclic transition state between two unsaturated reactant molecules. The π orbitals of the diene and π orbitals of the dienophile interact in such a way that two π bonds are broken and two new σ bonds are formed, resulting in a product of lower energy due to the more effective end-on orbital overlap in σ bonds.
A Simple Diels Alder Cycloaddition

Firstly, a simple Diels-Alder reaction with reactants ethene and cis-1,3-butadiene was modelled. The overall reaction is illustrated in Figure 5.
Optimising Reactant Cis Butadiene
A molecule of cis butadiene was created in Gaussview; the dihedral angle was set to 0 ° . The cleaning function was ran before it was optimised using AM1 semi empirical method and at DFT/6-31G* level of theory for comparison. The log file at AM1 semi empirical method can be found here. The log file at DFT/6-31G(d) can be found here.
(B3LYP is the DFT method that you used, and so it should be written B3LYP/6-31G(d) or B3LYP/6-31G*. Not a big deal Tam10 (talk) 11:19, 28 October 2015 (UTC))
| Optimised Structure | Level of Theory | Point Group | Energy/ Hartrees | ||
|---|---|---|---|---|---|
| AM1/semi empirical | C2v | 0.04879719 | |||
| DFT/6-31G* | C2v | -155.98595128 |
Following this optimisaiton, the HOMO and LUMO of cis butadiene was investigated as these orbitals were involved in the cycloaddition reaction. Below in the table compares the HOMO/LUMO diagrams with symmetry analysis.
| Orbital | Orbital Diagram | Symmetry wrt the plane |
|---|---|---|
| HOMO |  |
antisymmetric |
| LUMO | 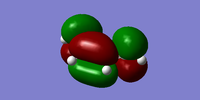 |
symmetric |
Optimising the Transition State Structure
An ethylene molecule was also built and optimised in order to simulate the transition structure. In this particular case, it was optimised using the TS (Berny) method at both AM1 semi empirical method and DFT/6-31G level of theory.
The log file at AM1 semi empirical method can be found here. The log file at DFT/6-31G(d) can be found here.
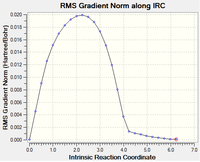
IRC analysis was carried out in order to confirm that the correct structure of the transition state was found.
| Level of Theory | Number of Points Set | Reaction Coordinate | RMS Gradient along IRC |
|---|---|---|---|
| AM1 semi empirical | 150 | 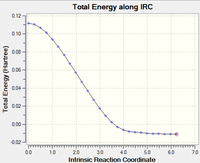 |
 |
| DFT/6-31G | 150 |  |
 |
In both cases, the transition state has been successfully located as in the both the IRC graphs, the line approaches zero. However, at the DFT/6-31G* level of theory, the gradient appears to not reach exactly zero, therefore an IRC with more than 150 steps could be ran to ensure the transition structure has definitely been located at a local minimum. The calculations were ran only in the forward direction only hence the reactant was not detected. Therefore, an extension to this part of the experiment would be to run the calculation in both directions.
Vibrational Frequency and MO Orbital Analysis
The HOMO and the LUMO of the transition state structure is shown below.
| Orbital | Orbital Diagram | Symmetry wrt the plane |
|---|---|---|
| HOMO | 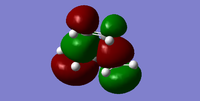 |
antisymmetric |
| LUMO | 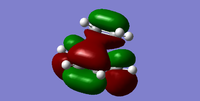 |
symmetric |
For this Diels Alder reaction, in order to identify the interacting HOMO and LUMO, the Woodward Hoffman rules were applied to evaluate the MOs of the transition state structure. Using frontier molecular orbital (FMO) theory [5] and the MO visuals on Gaussview, it was noted that the symmetry of the reactants and transition state must remain the same in order for the reaction to be classed allowed. Hence, it was inferred that the antisymmetric HOMO of butadiene and the antisymmetric LUMO of ethene come together to form the antisymmetric HOMO of the transition state. Similarly, the symmetric LUMO of butadiene and symmetric HOMO of ethene form the symmetric LUMO of the transition state.
The table below compares the imaginary frequency and lowest positive frequency of the transition structure at DFT/6-31G*.
| Frequency/ cm1 | Vibrational Animation | Description |
|---|---|---|
| -526.79 |  |
Synchronous |
| 136.15 | 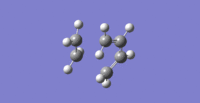 |
Asynchronous |
The lowest positive frequency is described as asynchronous as the vibrational movement is not symmetric with respect to the plane and the fragments ends do not move towards each other. The imaginary frequency on the other hand shows the fragment ends mutually coming together resembling the formation of a bond.
Comparing Levels of Theory
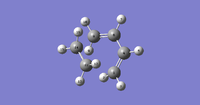
As well as comparing vibrational frequency data and energies, the two transition structures optimised at different levels of theory were compared by measuring bond lengths. Below is table with different bond length of the structures.
| C8-C14/ Å | C4-C6/ Å | C6-C8/ Å | Lit C=C bond[6]/ Å | Lit C-C bond[7]/ Å | C Van Der Waals Radius [8]/ Å | |
|---|---|---|---|---|---|---|
| AM1 Semi Empirical | 2.12012 | 1.39755 | 1.38180 | 1.334 | 1.544 | 1.70 |
| B3LYP/6-31G* | 2.27206 | 1.40720 | 1.38180 |
In general, the AM1 semi empirical method underestimates the bond length. The partial σ bond, denoted C8-C14, is in the range of a single C-C bond and the total of two carbon Van Der Waals radii (3.40 Å) indicating presence of attrative interaction. The bond denoted C6-C8 refers to a bond that transforms from a double to a single bond hence the bond length is found in the range of the literature C-C bond and C=C bond.The bond denoted C4-C6 refers to a bond that transforms from a single to a double bond hence the bond length is found in the range of the literature C-C bond and C=C bond.
Regioselectivity of Diels Alder Cycloadditions
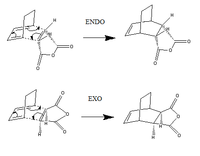
In addition, the regioselectivity of the Diels Alder reaction was investigated. Maleic anhydride is known to be an electron poor dienophile due to the presence of two electron withdrawing carbonyl groups, therefore the energy of the C=C bond involved in the cycloaddition is low. Hence the hypothesis states that the LUMO of maleic anhydride will interact with the HOMO of the cyclohexa-1,3-diene for a better energy match. The reactants can combine in a cycloaddition reaction in either a endo or exo fashion. The activation energies and reaction paths were calculated for each approach and it was found that the endo cycloaddition was thermally favoured.
Locating the Transition Structure
Both the reactants and products were optimised using AM1 semi empirical method before simulating a rough structure for the transition state. The log file for cyclohexa-1,3,-diene can be found here and for maleic anhydride, here The method used in locating the maximum involved freezing coordinates and optimising it to TS(Berny). The log file for exo can be found here and endo, here
| Type of Approach | Optimised Structure | Energy/ Hartrees | Imaginary Frequency/ cm-1 | Animation of Imaginary Frequency | ||
|---|---|---|---|---|---|---|
| Exo | -0.05041983 | -812.13 | 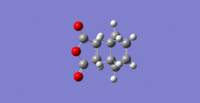 | |||
| Endo | -0.05150479 | -806.40 | 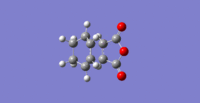 |
As seen from the data above, the energies and imaginary frequencies of the endo and exo transition states are very similar. however, the endo transition state is slightly lower than energy, suggesting this is the preferred pathway.
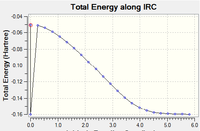
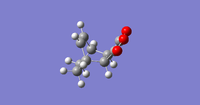
IRC analysis confirmed that the correct transition structures were located. The log file for exo can be found here and endo, here
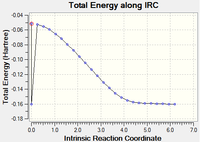
Each were ran using the AM1 semi empirical method with 100 steps and below are the tri-cyclic product structure indicating the calculation has gone to completion. However, there is a mysterious dip in both the IRC graphs, perhaps due to some error in the Gaussian program.
(Mysterious dip is caused by GaussView misreading the .log file. We found that this problem doesn't occur when you open the .chk file Tam10 (talk) 11:19, 28 October 2015 (UTC))
| Type of Approach | Product Structure | IRC Graph |
|---|---|---|
| Exo |  |
 |
| Endo |
 |
 |
Bond Distance and MO Analysis
Structural analysis of the transition structures involved measuring and comparing bond length. Included in the table below, are the atom labelled transition structures and corresponding bond lengths.
| Endo TS | 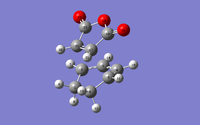 |
C2-C16/Å (1) | C16-C17/Å (2) | C2-C3/Å (3) | C3-C4/Å (4) | C4-C5/Å (5) | C3-C15/Å (6) |
| 2.16240 | 1.40848 | 1.39305 | 1.39721 | 1.39305 | 2.89215 | ||
| Exo TS |  |
C2-C12/Å (1) | C2-C3 /Å (2) | C11-C12/Å (3) | C12-C13/Å (4) | C13-C14/Å (5) | C1-C10 /Å (6) |
| 2.63495 | 1.41012 | 1.39438 | 1.39676 | 1.39437 | 2.94501 |
The first bond (1) recorded in both transition structures refers to the new σ bond formed between cyclohexa-1,3-diene and maleic anhydride reactants. It shows that in the endo approach, the length is a lot shorter than the bond length found in the exo approach. The next four bonds, (2), (3), (4) and (5) change bond order in the reaction and are found to be between single and double bond length as expected. The final bond length recorded was between the -(C=O)-O-(C=O)- fragment of the maleic anhydride and an opposing carbon atom.
| Exo TS | Endo TS | |
| HOMO | 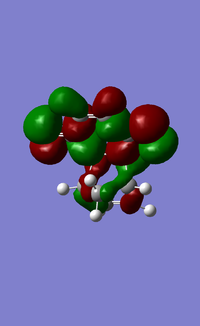 |
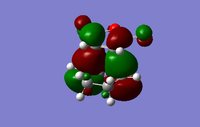 |
| LUMO | 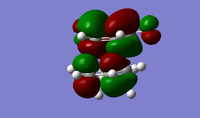 |
 |
Activation Energies
Thermochemical data was extracted from the frequency analysis (Table 4) and activation energies (Table 5) were calculated.
Table 4. A table diplaying thermochemical data obtained from frequency calculations at AM1 semi-empirical method.
| Electronic energy | Sum of electronic and zero-point energies | Sum of electronic and thermal energies | |
| at 0 K | at 298.15 K | ||
| Exo TS | -0.05041983 | 0.134881 | 0.144881 |
| Endo TS | -0.05150479 | 0.133493 | 0.143682 |
| 1,3-cyclohexadiene | 0.02771124 | 0.152502 | 0.157726 |
| maleic anhydride | -0.12182423 | -0.077322 | -0.072119 |
Table 5. A table diplaying calculated activation energies in kcal/mol.
| at 0 K | at 298.15 K | |
| ΔE (Exo) | 37.46 | 37.20 |
| ΔE (Endo) | 36.59 | 36.44 |
From the data in the tabels above, the endo transition structure has lower energy, hence it suggests that the reaction would preceed via this species. Unfortunately due to time contraints, the calculations were not ran at another level of theory, making it difficult to compare the error of the approximation using AM1 semi empirical method.
Secondary Orbital Overlap Effect
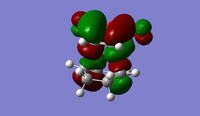
The secondary orbital overlap effect [9] explains the lower energy endo transition state. This theory states that orbitals that are not directly utilised upon bond forming or breaking, undergo favourable overlap when the reactants approach on another. This overall stabilising effect leads to a preference of endo approach in this Diels Alder reaction.
Below is an example of an orbital demonstrating secondary orbital overlap effect. The LUMO +2, which is not directly involved in bonding was analysed in both the endo and exo transition structure. In the endo structure, there is favourable overlap however this can not be seen the the exo LUMO +2.
| LUMO +2 | |
|---|---|
| Exo | Endo |
 |
 |
Conclusion
In this experiment, the Cope rearrangement and two Diels Alder cycloaddition reactions were simulated and investigated using Gaussian 09W and Gaussview 5.0. Employing the Woodward Hoffmann rules aided the analysis of molecular orbital interactions. To locate the transition state maximum on the potential energy surface, three methods were used: TS (Berny), freeze coordinate and QST2 method. All methods were used in finding a ‘chair’ or ‘boat’ transition structure in the Cope rearrangement reaction and overall the data produced was fairly accurate when compared to experimental values. The hypothesis predicted the lowest energy conformer of 1,5-hexadiene to be anti- linkage due to C=C bonds situated 180 ° relatively, reducing steric repulsion. However this was proven to be wrong due to the stabilising interactions between C=C and the vinyl proton. As it was a simple symmetrical reaction, it was not difficult to roughly orientate the reactants resembling the transition structure hence all method were successful.
Three different levels of theory were used. AM1 semi empirical method gave the more inaccurate results as there are more approximations in the calculation. For example, the energies of cis butadiene transition state were very different when using AM1 semi empirical method and DFT/ 6-31G*. Overall, although AM1 semi empirical method requires a short calculation time, it would not yield accurate results in more complicated reaction, perhaps with more substituents as it would ignore electronic effects. Therefore Hartree Fock or DFT would be more suitable as it includes a minimum basis set that includes electron- electron interactions. An extension to what was carried out in the experiment would be to run the calculations at DFT B3LYP/6-31G* in the Diels Alder reaction of cyclohexa-1,3-diene and maleic anhydride so the results using Am1 could be compared to assess accuracy.
In conclusion the computational experiment has successfully simulated pericyclic reactions as cyclic transition structures were modelled after QST2 or TS (Berny) methods. An advantage of computational simulation enabled an IR spectrum to be taken of transition states which would be impossible experimentally. However the energetic values may be skewed due to solvent effects which have been ignored.
References
- ↑ Woodward, R. and Hoffmann, R. (1965), "Stereochemistry of Electrocyclic Reactions, J. Am. Chem. Soc., 1965,, 395-397. doi:http://pubs.acs.org/doi/abs/10.1021/ja01080a054
- ↑ M.F. Brigatti , A. Mottana , "Layered Mineral Structures and their Application in Advanced Technologies", , Vol 11,, 209-210.
- ↑ Gung, B., Zhu, Z. and Fouch, R. (1995). Conformational Study of 1,5-Hexadiene and 1,5-Diene-3,4-diols. J. Am. Chem. Soc., 117(6), pp.1783-1788. doi:http://pubs.acs.org/doi/pdf/10.1021/ja00111a016
- ↑ Pauling, L. (1931). THE NATURE OF THE CHEMICAL BOND. II. THE ONE-ELECTRON BOND AND THE THREE-ELECTRON BOND. J. Am. Chem. Soc., 53(9), pp.3225-3237. doi:http://pubs.acs.org/doi/abs/10.1021/ja01360a004
- ↑ Fleming, I. (n.d.). Frontier Orbitals and Organic Chemical Reactions.
- ↑ Pauling, L. (1931). THE NATURE OF THE CHEMICAL BOND. II. THE ONE-ELECTRON BOND AND THE THREE-ELECTRON BOND. J. Am. Chem. Soc., 53(9), pp.3225-3237. doi:http://pubs.acs.org/doi/abs/10.1021/ja01360a004
- ↑ Pauling, L. (1931). THE NATURE OF THE CHEMICAL BOND. II. THE ONE-ELECTRON BOND AND THE THREE-ELECTRON BOND. J. Am. Chem. Soc., 53(9), pp.3225-3237. doi:http://pubs.acs.org/doi/abs/10.1021/ja01360a004
- ↑ Bondi, A. (1964). van der Waals Volumes and Radii. The Journal of Physical Chemistry, 68(3), pp.441-451.doi:http://pubs.acs.org/doi/abs/10.1021/j100785a001
- ↑ Fox, M., Cardona, R. and Kiwiet, N. (1987). Steric effects vs. secondary orbital overlap in Diels-Alder reactions. MNDO and AM1 studies. The Journal of Organic Chemistry, 52(8), pp.1469-1473.doi:http://pubs.acs.org/doi/abs/10.1021/jo00384a016

