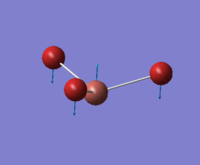
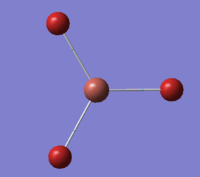
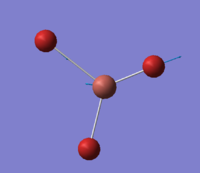
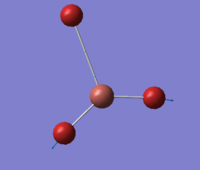
Rep:Mod:stanleyinorg
Optimisation
3-21G optimisation of BH3 Molecule
Link to BH3 3-21G Optimisation .LOG file: click here
For JMol File:
Optimal Bond Distance: 1.19 Å
Optimal Bond Angle: 120.0°
BH3 optimization results summary table:
| BH3 optimisation | ||
| File Name | bh3_opt | |
| File Type | .log | |
| Calculation Type | FOPT | |
| Calculation Method | RB3LYP | |
| Basis Set | 3-21G | |
| Charge | 0 | |
| Spin | Singlet | |
| E(RB3LYP) | -26.46226338 | a.u. |
| RMS Gradient Norm | 0.00020672 | a.u. |
| Imaginary Freq | ||
| Dipole Moment | 0 | Debye |
| Point Group | D3H | |
| Job cpu time: 57.0 seconds | ||
Calculation Log: 'Item' table of converged forces and distances for 3-21G BH3 optimisation:
        Item               Value     Threshold  Converged?
 Maximum Force            0.000413     0.000450     YES
 RMS     Force            0.000271     0.000300     YES
 Maximum Displacement     0.001610     0.001800     YES
 RMS     Displacement     0.001054     0.001200     YES
 Predicted change in Energy=-1.071764D-06
 Optimization completed.
    -- Stationary point found.
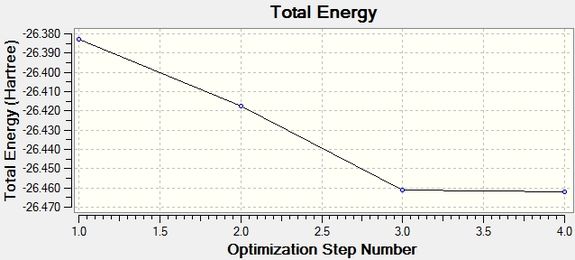
Intermediate geometry optimisation plots:
 |
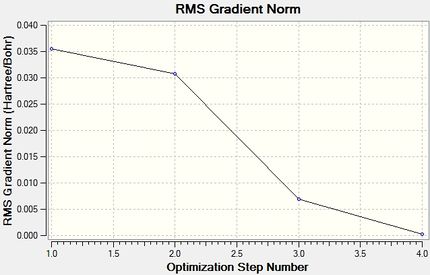 |
Total Energy Minimum Value for 3-21G optimisation of BH3 Molecule: -26.46226338 a.u.
631G(d,p) optimisation of BH3 Molecule
Link to BH3 631G(d,p) optimisation .LOG file: click here
For JMol File:
Optimal Bond Distance: 1.19 Å
Optimal Bond Angle: 120.0°
BH3 631G(d,p) Optimization results summary table:
| BH3 optimisation | ||
| File Name | BH3_OPT_631G_DP | |
| File Type | .log | |
| Calculation Type | FOPT | |
| Calculation Method | RB3LYP | |
| Basis Set | 6-31G(d,p) | |
| Charge | 0 | |
| Spin | Singlet | |
| E(RB3LYP) | -26.61532374 | a.u. |
| RMS Gradient Norm | 0.00000236 | a.u. |
| Imaginary Freq | ||
| Dipole Moment | 0 | Debye |
| Point Group | CS | |
| Job cpu time: 28.0 seconds | ||
Calculation Log: 'Item' table of converged forces and distances for 6-31G(d,p) BH3 optimisation:
         Item               Value     Threshold  Converged?
 Maximum Force            0.000005     0.000450     YES
 RMS     Force            0.000003     0.000300     YES
 Maximum Displacement     0.000020     0.001800     YES
 RMS     Displacement     0.000012     0.001200     YES
 Predicted change in Energy=-1.312911D-10
 Optimization completed.
    -- Stationary point found.
Intermediate geometry optimisation plots:
 |
 |
Total Energy Minimum Value for 631G(d,p) optimisation of BH3 Molecule: -26.61532374 a.u.
LanL2DZ optimisation of TlBr3 Molecule
Link to TlBr3 LanL2DZ Optimisation Calculation on D-Space: DOI:10042/20468
Optimal Bond Distance: 2.65 Å
Literature value for TlBr bond distance: 2.481 Å [1]
Optimal Bond Angle: 120.0°
TlBr3 LanL2DZ optimization results summary table:
| TlBr3 optimisation | ||
| File Name | TlBr3_OPT_LanL2DZ | |
| File Type | .log | |
| Calculation Type | FOPT | |
| Calculation Method | RB3LYP | |
| Basis Set | LANL2DZ | |
| Charge | 0 | |
| Spin | Singlet | |
| E(RB3LYP) | -91.21812851 | a.u. |
| RMS Gradient Norm | 0.0000009 | a.u. |
| Imaginary Freq | ||
| Dipole Moment | 0 | Debye |
| Point Group | D3H | |
| Job cpu time: 19.6 seconds | ||
Calculation Log: 'Item' table of converged forces and distances for LanL2DZ TlBr3 optimisation:
         Item               Value     Threshold  Converged?
 Maximum Force            0.000002     0.000450     YES
 RMS     Force            0.000001     0.000300     YES
 Maximum Displacement     0.000022     0.001800     YES
 RMS     Displacement     0.000014     0.001200     YES
 Predicted change in Energy=-6.084050D-11
 Optimization completed.
    -- Stationary point found.
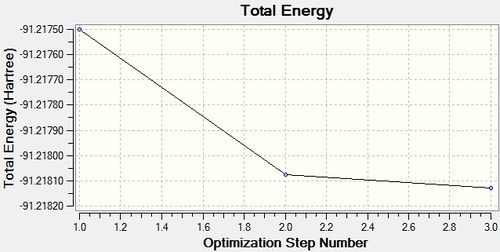
Intermediate geometry optimisation plots:
 |
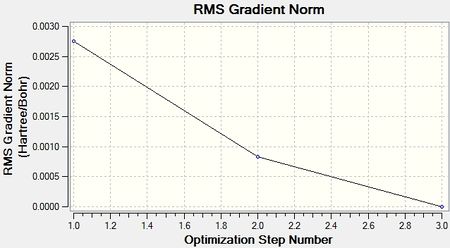 |
Total Energy Minimum Value for LanL2DZ optimisation of TlBr3 Molecule: -91.21812851 a.u.
GEN optimisation of BBr3 Molecule
Link to BBr3 GEN optimisation .LOG file: click here
Optimal Bond Distance: 1.93 Å
Optimal Bond Angle: 120.0°
BBr3 optimization results summary table:
| BBr3 GEN Optimisation | ||
| File Name | BBR3_OPT_GEN | |
| File Type | .log | |
| Calculation Type | FOPT | |
| Calculation Method | RB3LYP | |
| Basis Set | Gen | |
| Charge | 0 | |
| Spin | Singlet | |
| E(RB3LYP) | -64.43645277 | a.u. |
| RMS Gradient Norm | 0.00000384 | a.u. |
| Imaginary Freq | ||
| Dipole Moment | 0.0002 | Debye |
| Point Group | C2V | |
| Job cpu time: 1 minutes 20.0 seconds | ||
Calculation Log: 'Item' table of converged forces and distances for GEN BBr3 optimisation:
          Item               Value     Threshold  Converged?
 Maximum Force            0.000008     0.000450     YES
 RMS     Force            0.000005     0.000300     YES
 Maximum Displacement     0.000036     0.001800     YES
 RMS     Displacement     0.000024     0.001200     YES
 Predicted change in Energy=-4.098477D-10
 Optimization completed.
    -- Stationary point found.
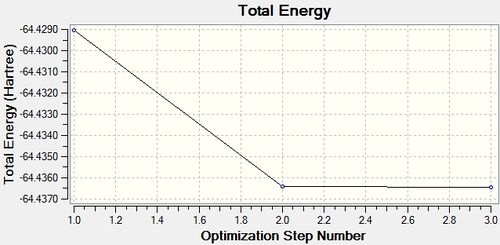
Intermediate geometry optimisation plots:
 |
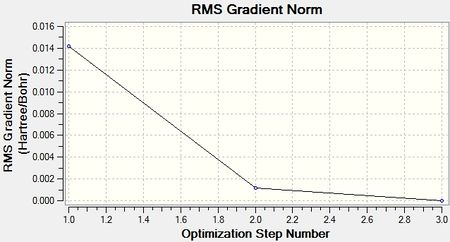 |
Total Energy Minimum Value for GEN optimisation of BBr3 Molecule: -64.43645277 a.u.
Comparing and Contrasting the bond distances of BH3, BBr3 and TlBr3
Table summarising the bond lengths of BH3, BBr3 and TlBr3 calculated by Gaussian:
| Bond | Computated Bond Length (Å) |
|---|---|
| BH3 | 1.19 |
| BBr3 | 1.93 |
| TlBr3 | 2.65 |
A chemical bond represents the build up of electron density between separate atoms to form a molecule. Depending on the size and shape of the orbitals, this interaction can be strong (leading to short bond lengths) or can be weak (leading to longer bond lengths).
As you can see the immediate trend is that moving from BH3 to TlBr3 the bond length is increasing. This trend can be understood by considering the relative sizes of the orbitals involved in bonding. If we first take BH3 we see that Boron is in group 3 and row 2 meaning in size it has a comparatively small valence electron shell and thus a small electron radius. Now if we consider that the boron atom is bonding to Hydrogen we can understand why the bond length is so short, since hydrogen has one of the smallest electron radii being the first atom in the periodic table.
If we now consider BBr3 we still have the boron atom but now have three Bromine atoms bonding to it. Bromine is in the fourth row of the periodic table and thus it's valence electrons extend out much further from the nucleus of the atom meaning it has a larger atomic radius than Hydrogen. In terms of bonding this results in a longer observed bond than in BH3.
Finally if we consider TlBr3 we can see that we have changed the central atom from Boron to Thallium. The bonding observed stays the same since Boron and Thallium are both in group three, however with Thallium in the sixth row of the periodic table, it's valence electrons are even further from the nucleus than in Bromine. This results in the longest bond length since the two orbitals interacting are the largest in size.
In some structures we sometimes observe a bond forming where we do not expect and this can also be explained by considering the orbital interactions of the atoms in the molecule. Unless sufficient electron density can build up between two atoms i.e. a strong orbital overlap, then a chemical bond will not form. Within Gaussian the output may show that a bond has not formed between two atoms, however this does not mean one does not exist. This is due to the fact that Gaussian only considers a bond to have formed when it conforms to a specific length criteria, however in inorganic bonding these lengths may exceed this value due to large orbital overlap.
Frequency Analysis
631G(d,p) frequency Analysis of BH3 Molecule
Link to BH3 631G(d,p) frequency Analysis .LOG file: click here
Optimal Bond Distance: 1.19 Å
Optimal Bond Angle: 120.0
BH3 631G(d,p) Frequency analysis results summary table:
| BH3 Frequency | ||
| File Name | MICHAELSTANLEY_BH3_FREQ | |
| File Type | .log | |
| Calculation Type | FREQ | |
| Calculation Method | RB3LYP | |
| Basis Set | 6-31G(d,p) | |
| Charge | 0 | |
| Spin | Singlet | |
| E(RB3LYP) | -26.61532374 | a.u. |
| RMS Gradient Norm | 0.00000237 | a.u. |
| Imaginary Freq | 0 | |
| Dipole Moment | 0 | Debye |
| Point Group | C2V | |
| Job cpu time: 24.0 seconds | ||
Calculation Log: 'Item' table of converged forces and distances for 631G(d,p) Frequency Analysis of BH3:
         Item               Value     Threshold  Converged?
 Maximum Force            0.000005     0.000450     YES
 RMS     Force            0.000002     0.000300     YES
 Maximum Displacement     0.000020     0.001800     YES
 RMS     Displacement     0.000009     0.001200     YES
 Predicted change in Energy=-1.329322D-10
 Optimization completed.
    -- Stationary point found.
Low Frequencies:
Low frequencies ---  -18.6669   -0.0007   -0.0001    0.0008   12.5167   12.5631
 Low frequencies --- 1162.9785 1213.1756 1213.2363
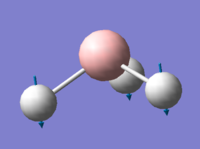
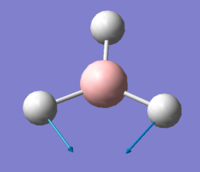
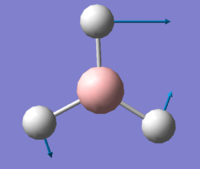
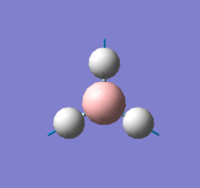
Table summarizing the computed vibrations of the BH3 molecule:
Computed IR SPectrum for BH3:

Summary table of the vibrational frequencies of BH3:
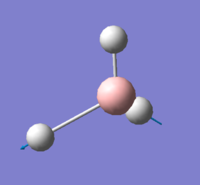
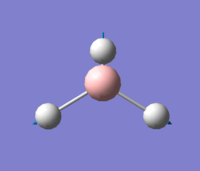
Question: Why are there less than six peaks in the spectrum, when there are obviously six vibrations?
Answer: Out of the six vibrations only five are IR active and thus observed. This is because the Symmetric stretch mode has no overall change in dipole moment. This can be confirmed by the calculated intensity value of 0.00 in the table above.
LanL2DZ frequency Analysis of TlBr3 Molecule
For JMol File:
Link to TlBr3 LanL2DZ Frequency Analysis on D-Space: DOI:10042/20504 Optimal Bond Distance: 2.65 Å
Optimal Bond Angle: 120°
TlBr3 LanL2DZ Frequency analysis results summary table:
| TlBr3 Frequency | ||
| File Name | TlBr3_FREQ_LanL2DZ | |
| File Type | .log | |
| Calculation Type | FREQ | |
| Calculation Method | RB3LYP | |
| Basis Set | LANL2DZ | |
| Charge | 0 | |
| Spin | Singlet | |
| E(RB3LYP) | -91.21812851 | a.u. |
| RMS Gradient Norm | 0.00000088 | a.u. |
| Imaginary Freq | 0 | |
| Dipole Moment | 0 | Debye |
| Point Group | D3H | |
| Job cpu time: 18.7 seconds | ||
Calculation Log: 'Item' table of converged forces and distances for Frequency Analysis of TlBr3:
         Item               Value     Threshold  Converged?
 Maximum Force            0.000002     0.000450     YES
 RMS     Force            0.000001     0.000300     YES
 Maximum Displacement     0.000022     0.001800     YES
 RMS     Displacement     0.000011     0.001200     YES
 Predicted change in Energy=-5.660901D-11
 Optimization completed.
    -- Stationary point found.
Low Frequencies:
 Low frequencies ---   -3.4213   -0.0026   -0.0004    0.0015    3.9367    3.9367
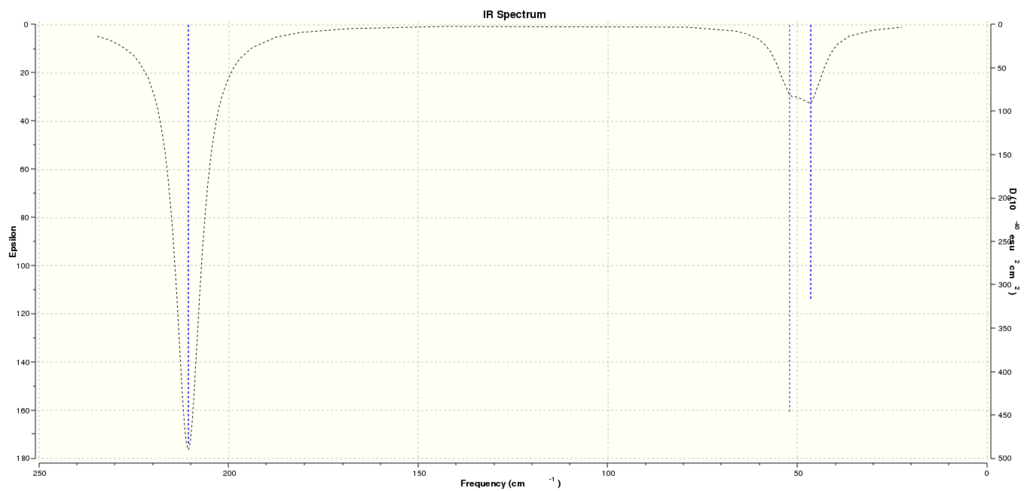
 Low frequencies ---   46.4289   46.4292   52.1449
Computed IR SPectrum for TlBr3:
Summary table of the vibrational frequencies of TlBr3:
Comparing the vibrational frequencies of BH3 and Tl3:
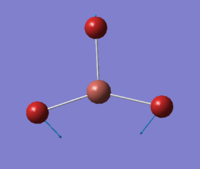
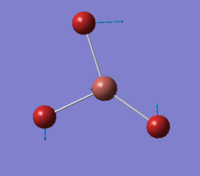
Using the 3N-6 rule we can confirm that both BH3 and Tl3 exhibit six vibrational modes as calculated. Looking at the frequencies of the vibrations we see that they are at a much lower frequency in Tl3 than in BH3. This implies that the Tl-Br bond is much weaker than the B-H bond. If we look at the Tl-Br bond length we see that it is longer than the B-H bond length thus suggesting that the bonds in Tl3 are much weaker.
We can rationalise the observed bonding when we consider the relative orbitals involved. In BH3 the bonds are 2s and 2p derived sp2 hybridised orbitals bonding to 1s Hydrogen orbitals. In Tl3 the bonding is derived from 6s and 6p orbitals and thus the orbitals are much more diffuse, thus resulting in poorer orbitals overlap and thus weaker bonds.
If we next consider the order of the vibrational modes for BH3 and Tl3 we see that in BH3 the wagging mode is the lowest frequency mode whereas in Tl3 this is the scissoring mode. This reordering of modes can be rationalised when we consider that the bond lengths in Tl3 are much longer, thus requiring more energy to move the bromine atoms.
These spectra are similar in the sense that there are two signals at a low and two at a high frequency. The A2' and E' and the A1' and E' respectively. This reason for this observation becomes clear when we inspect the form of the vibrations for A2' and E' and A1' and E'. Both A2' and E' involve only a change in bond angle and not bond length, thus these are low energy and thus low frequency vibrations. When we consider A1' and E' we see that these modes involve a change in bond length which is a much higher energy process, thus occurs at a higher frequency.
When conducting a frequency analysis there are two operations being carried out by the computer. The first is the calculation of the second derivative of the potential energy surface which allows us to determine whether we are looking at a transition state or a minimum. The second is the calculation of the vibrational modes of the molecules and this the IR and Raman spectra. This allows us to check whether the results obtained match up with experimental values.
When running an optimisation and frequency analysis on a molecule, we must ensure that the same method and basis sets are used for both calculations. The reason for this is it allows us to make comparisons between the two outputs from the calculations since the same method and basis set have been employed. When we get the output from the calculation we always check to make sure that the low frequencies reported are as close to zero as possible. The reason for this is because these low frequencies represent the vibrations of the centre of mass of the molecule (the -6 value in the 3N-6 formula) and thus will be very small compared the the other vibrations.
Molecular Orbitals
Molecular orbitals of BH3
Link to BH3 MO analysis on D-space: DOI:10042/20527
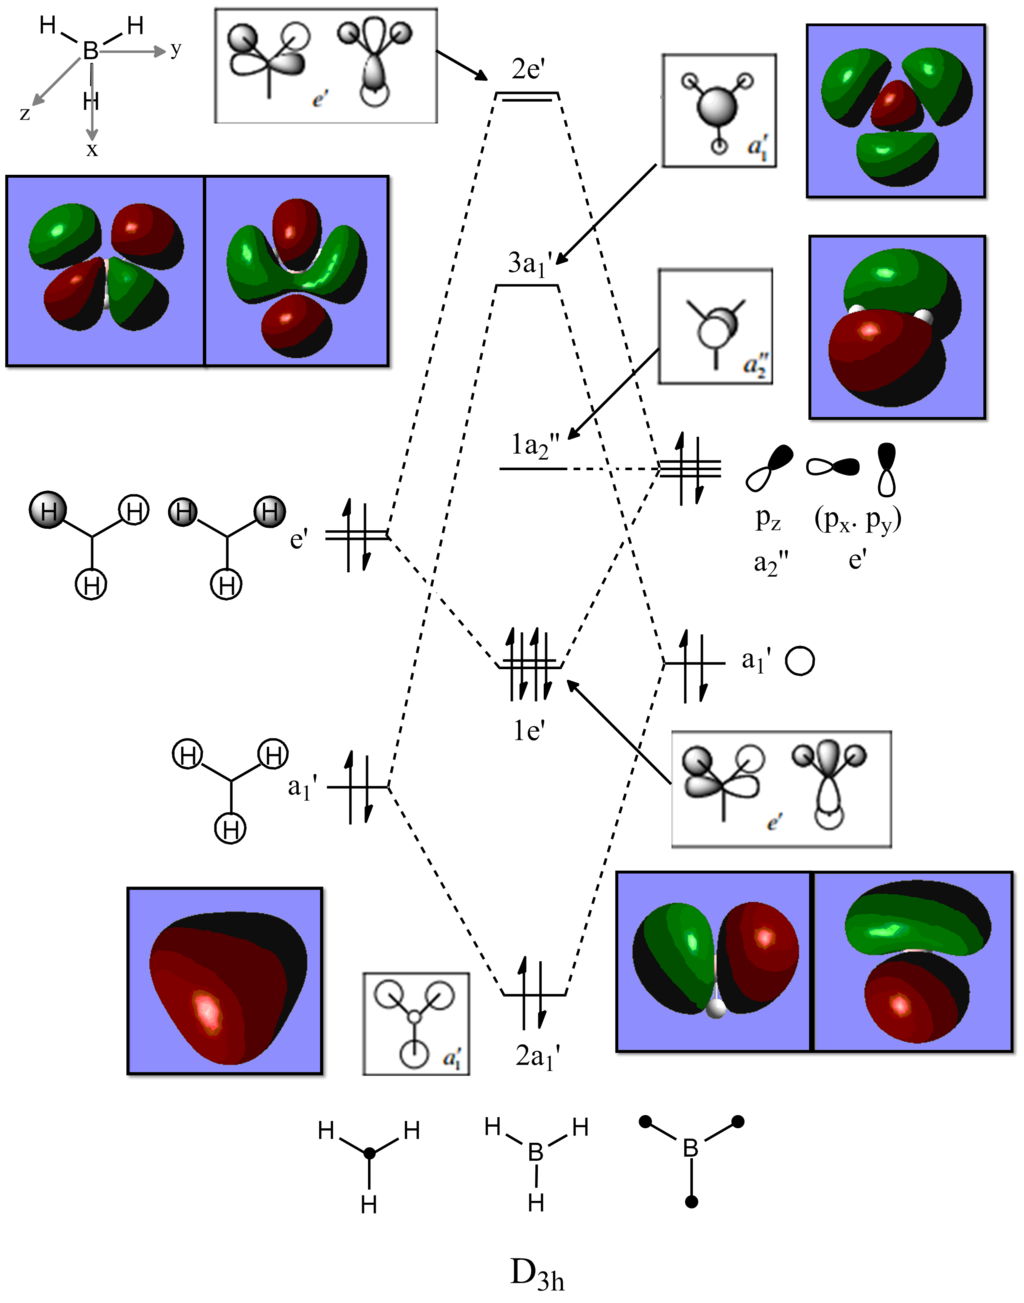
Black and White Molecular orbital diagrams obtained from: [2]
There are very little differences between the computed MO's and the real ones. This indicates that qualitative MO theory is very effective in predicting the energy levels and relative shapes of the molecular orbitals of simple molecules. This becomes very useful for predicting reactivity and HOMO-LUMO interactions.
NBO Analysis
631G(d,p) optimisation of NH3
For JMol File:
Link to NH3 631G(d,p) optimisation on D-Space: DOI:10042/20526
Optimal Bond Distance: 1.02 Å
Optimal Bond Angle: 105.7°
NH3 631G(d,p) optimization results summary table:
| NH3 Optimisation | ||
| File Name | NH3_OPT_631G_dp | |
| File Type | .log | |
| Calculation Type | FOPT | |
| Calculation Method | RB3LYP | |
| Basis Set | 6-31G(d,p) | |
| Charge | 0 | |
| Spin | Singlet | |
| E(RB3LYP) | -56.55776856 | a.u. |
| RMS Gradient Norm | 0.00000885 | a.u. |
| Imaginary Freq | ||
| Dipole Moment | 1.8464 | Debye |
| Point Group | C1 | |
| Job cpu time: 20.9 seconds | ||
Calculation Log: 'Item' table of converged forces and distances for 631G(d,p) optimisation of NH3:
         Item               Value     Threshold  Converged?
 Maximum Force            0.000024     0.000450     YES
 RMS     Force            0.000012     0.000300     YES
 Maximum Displacement     0.000079     0.001800     YES
 RMS     Displacement     0.000053     0.001200     YES
 Predicted change in Energy=-1.629727D-09
 Optimization completed.
    -- Stationary point found.
Intermediate geometry optimisation plots:
 |
 |
Total Energy Minimum Value for 631G(d,p) optimisation of NH3 Molecule: -56.55776856 a.u.
631G(d,p) frequency Analysis of NH3
For JMol File:
Link to NH3 631G(d,p) frequency analysis on D-Space: DOI:10042/20528
Optimal Bond Distance: 1.02 Å
Optimal Bond Angle: 105.7°
NH3 631G(d,p) frequency analsyis results summary table:
| NH3 Freq | ||
| File Name | NH3_FREQ_631G_dp | |
| File Type | .log | |
| Calculation Type | FREQ | |
| Calculation Method | RB3LYP | |
| Basis Set | 6-31G(d,p) | |
| Charge | 0 | |
| Spin | Singlet | |
| E(RB3LYP) | -56.55776856 | a.u. |
| RMS Gradient Norm | 0.00000878 | a.u. |
| Imaginary Freq | 0 | |
| Dipole Moment | 1.8464 | Debye |
| Point Group | C1 | |
| Job cpu time: 14.2 seconds | ||
Calculation Log: 'Item' table of converged forces and distances for Frequency Analysis of NH3:
         Item               Value     Threshold  Converged?
 Maximum Force            0.000021     0.000450     YES
 RMS     Force            0.000009     0.000300     YES
 Maximum Displacement     0.000077     0.001800     YES
 RMS     Displacement     0.000039     0.001200     YES
 Predicted change in Energy=-1.592773D-09
 Optimization completed.
    -- Stationary point found.
Low Frequencies:
Low frequencies ---  -30.8045   -0.0015   -0.0013    0.0008   20.2188   28.2150
 Low frequencies --- 1089.5530 1694.1235 1694.1861
Computed IR Spectrum for NH3:

631G(d,p) NBO analysis of NH3
Link to NH3 631G(d,p) energy calculation on D-space: DOI:10042/20529
Charge Distribution of NH3 molecule:
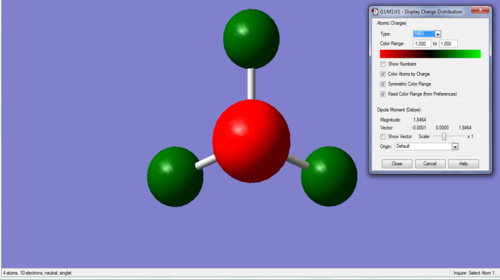
Charge range -1.0 - +1.0
Specific charges on atoms: N = -1.125, H = +0.375
Association energies: Ammonia-Borane
631G(d,p) optimisation of NH3BH3
For JMol File:
Link to NH3BH3 631G(d,p) optimisation on D-Space: DOI:10042/20539
Optimal N-B Bond Distance: 1.67 Å
Optimal Bond Angle: N-B-H ≈ 104.6°, B-N-H ≈ 111.0°
NH3BH3 631G(d,p) optimization results summary table:
| NH3BH3 Optimisation | ||
| File Name | NH3_BH3_OPT_631G_dp | |
| File Type | .log | |
| Calculation Type | FOPT | |
| Calculation Method | RB3LYP | |
| Basis Set | 6-31G(d,p) | |
| Charge | 0 | |
| Spin | Singlet | |
| E(RB3LYP) | -83.22469002 | a.u. |
| RMS Gradient Norm | 0.00006847 | a.u. |
| Imaginary Freq | ||
| Dipole Moment | 5.5654 | Debye |
| Point Group | C1 | |
| Job cpu time: 1 minutes 26.2 seconds | ||
Calculation Log: 'Item' table of converged forces and distances for Frequency Analysis of NH3BH3:
         Item               Value     Threshold  Converged?
 Maximum Force            0.000139     0.000450     YES
 RMS     Force            0.000063     0.000300     YES
 Maximum Displacement     0.000761     0.001800     YES
 RMS     Displacement     0.000339     0.001200     YES
 Predicted change in Energy=-2.028975D-07
 Optimization completed.
    -- Stationary point found.
Intermediate geometry optimisation plots:
 |
 |
Total Energy Minimum Value for 631G(d,p) optimisation of NH3BH3 Molecule: -83.22469002 a.u.
631G(d,p) frequency analysis of NH3BH3
For JMol File:
Link to NH3BH3 631G(d,p) frequency analysis on D-Space: DOI:10042/20541
Optimal Bond Distance: 1.67 Å
Optimal Bond Angle: N-B-H ≈ 104.6°, B-N-H ≈ 111.0°
NH3BH3 frequency analsyis results summary table:
| NH3BH3 Frequency | ||
| File Name | NH3_BH3_FREQ_631G_dp | |
| File Type | .log | |
| Calculation Type | FREQ | |
| Calculation Method | RB3LYP | |
| Basis Set | 6-31G(d,p) | |
| Charge | 0 | |
| Spin | Singlet | |
| E(RB3LYP) | -83.22469006 | a.u. |
| RMS Gradient Norm | 0.00006851 | a.u. |
| Imaginary Freq | 0 | |
| Dipole Moment | 5.5654 | Debye |
| Point Group | C1 | |
| Job cpu time: 56.5 seconds | ||
Calculation Log: 'Item' table of converged forces and distances for Frequency Analysis of NH3BH3:
         Item               Value     Threshold  Converged?
 Maximum Force            0.000127     0.000450     YES
 RMS     Force            0.000069     0.000300     YES
 Maximum Displacement     0.000801     0.001800     YES
 RMS     Displacement     0.000532     0.001200     YES
 Predicted change in Energy=-2.128467D-07
 Optimization completed.
    -- Stationary point found.
Low frequencies:
Low frequencies ---   -0.0012   -0.0010    0.0009   19.0734   23.7378   42.9981
 Low frequencies ---  266.5957  632.3884  639.5018
Computed IR Spectrum for NH3BH3:

Association Energies:
E(NH3)= -56.55776856 a.u. E(BH3)= -26.61532374 a.u. E(NH3BH3)= -83.22469006 a.u.
ΔE=E(NH3BH3)-[E(NH3)+E(BH3)]
ΔE= -83.22469006 - (-56.55776856-26.61532374)= -83.22469006 + 83.1730923 = -0.0515983 a.u.
ΔE= -0.0515983 a.u. x 2625.50 KJ.mol-1.au-1 [3] = -135.47 (+/-10) KJ.mol-1
This is the value of the dissociation energy for the N-B bond and thus the association energy is simply: ΔEAssociation = +135.47 (+/-10) KJ.mol-1
This value is in very good agreement with the literature value of +130 KJ.mol-1 [4].
Mini Project
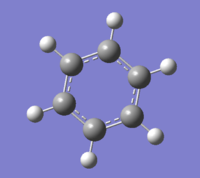
Benzene
631G(d,p) optimisation of Benzene
For JMol File:
Link to Benzene 631G(d,p) optimisation on D-Space: DOI:10042/20616
Optimal Bond Distance: 1.40 Å
Optimal Bond Angle: 120.0°
Benzene 631G(d,p) optimization results summary table:
| Benzene Optimisation | ||
| File Name | MS_Benzene_OPT_631Gdp | |
| File Type | .log | |
| Calculation Type | FOPT | |
| Calculation Method | RB3LYP | |
| Basis Set | 6-31G(d,p) | |
| Charge | 0 | |
| Spin | Singlet | |
| E(RB3LYP) | -232.2582055 | a.u. |
| RMS Gradient Norm | 0.00009549 | a.u. |
| Imaginary Freq | ||
| Dipole Moment | 0.0001 | Debye |
| Point Group | C1 | |
| Job cpu time: 1 minutes 25.4 seconds | ||
Calculation Log: 'Item' table of converged forces and distances for optimisation of Benzene:
         Item               Value     Threshold  Converged?
 Maximum Force            0.000212     0.000450     YES
 RMS     Force            0.000085     0.000300     YES
 Maximum Displacement     0.000991     0.001800     YES
 RMS     Displacement     0.000315     0.001200     YES
 Predicted change in Energy=-5.157405D-07
 Optimization completed.
    -- Stationary point found.
Intermediate geometry optimisation plots:
 |
 |
Total Energy Minimum Value for 631G(d,p) optimisation of Benzene Molecule: -232.2582055 a.u
631G(d,p) frequency analysis of Benzene
For JMol File:
Link to Benzene 631G(d,p) frequency analysis on D-Space: DOI:10042/20641
Optimal Bond Distance: 1.40 Å
Optimal Bond Angle: 120.0 °
Benzene 631G(d,p) frequency analsyis results summary table:
| Benzene Optimisation | ||
| File Name | MS_Benzene_FREQ_631Gdp | |
| File Type | .log | |
| Calculation Type | FREQ | |
| Calculation Method | RB3LYP | |
| Basis Set | 6-31G(d,p) | |
| Charge | 0 | |
| Spin | Singlet | |
| E(RB3LYP) | -232.25820533 | a.u. |
| RMS Gradient Norm | 0.00009549 | a.u. |
| Imaginary Freq | ||
| Dipole Moment | 0.0001 | Debye |
| Point Group | C1 | |
| Job cpu time: 4 minutes 40.1 seconds | ||
Calculation Log: 'Item' table of converged forces and distances for frequency analysis of Benzene:
         Item               Value     Threshold  Converged?
 Maximum Force            0.000195     0.000450     YES
 RMS     Force            0.000095     0.000300     YES
 Maximum Displacement     0.001065     0.001800     YES
 RMS     Displacement     0.000381     0.001200     YES
 Predicted change in Energy=-5.069198D-07
 Optimization completed.
    -- Stationary point found.
Low frequencies:
Low frequencies ---  -17.3954  -14.6988   -9.7872   -0.0003    0.0005    0.0006
 Low frequencies ---  413.7961  414.4656  620.8509
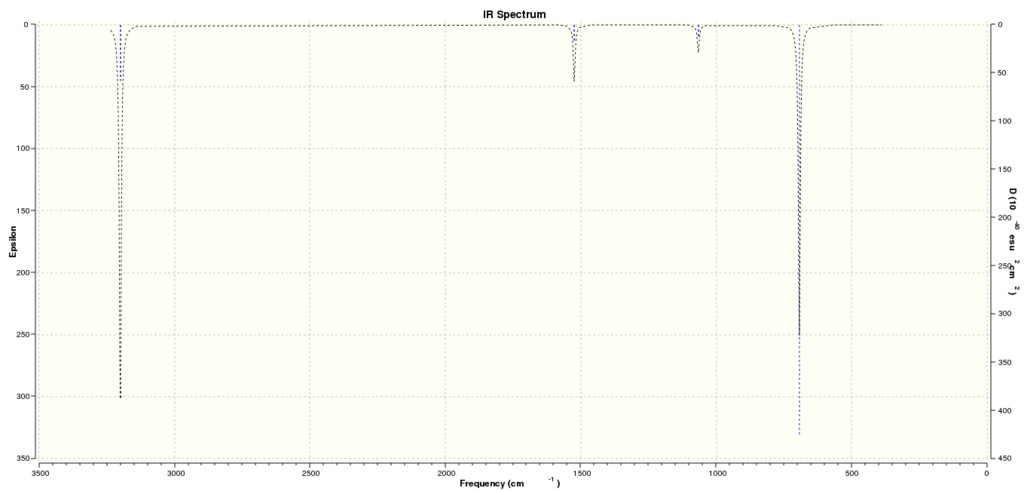
Computed IR Spectrum for Benzene:
MO analysis of Benzene
Link to MO and NBO analysis on D-Space: DOI:10042/20649
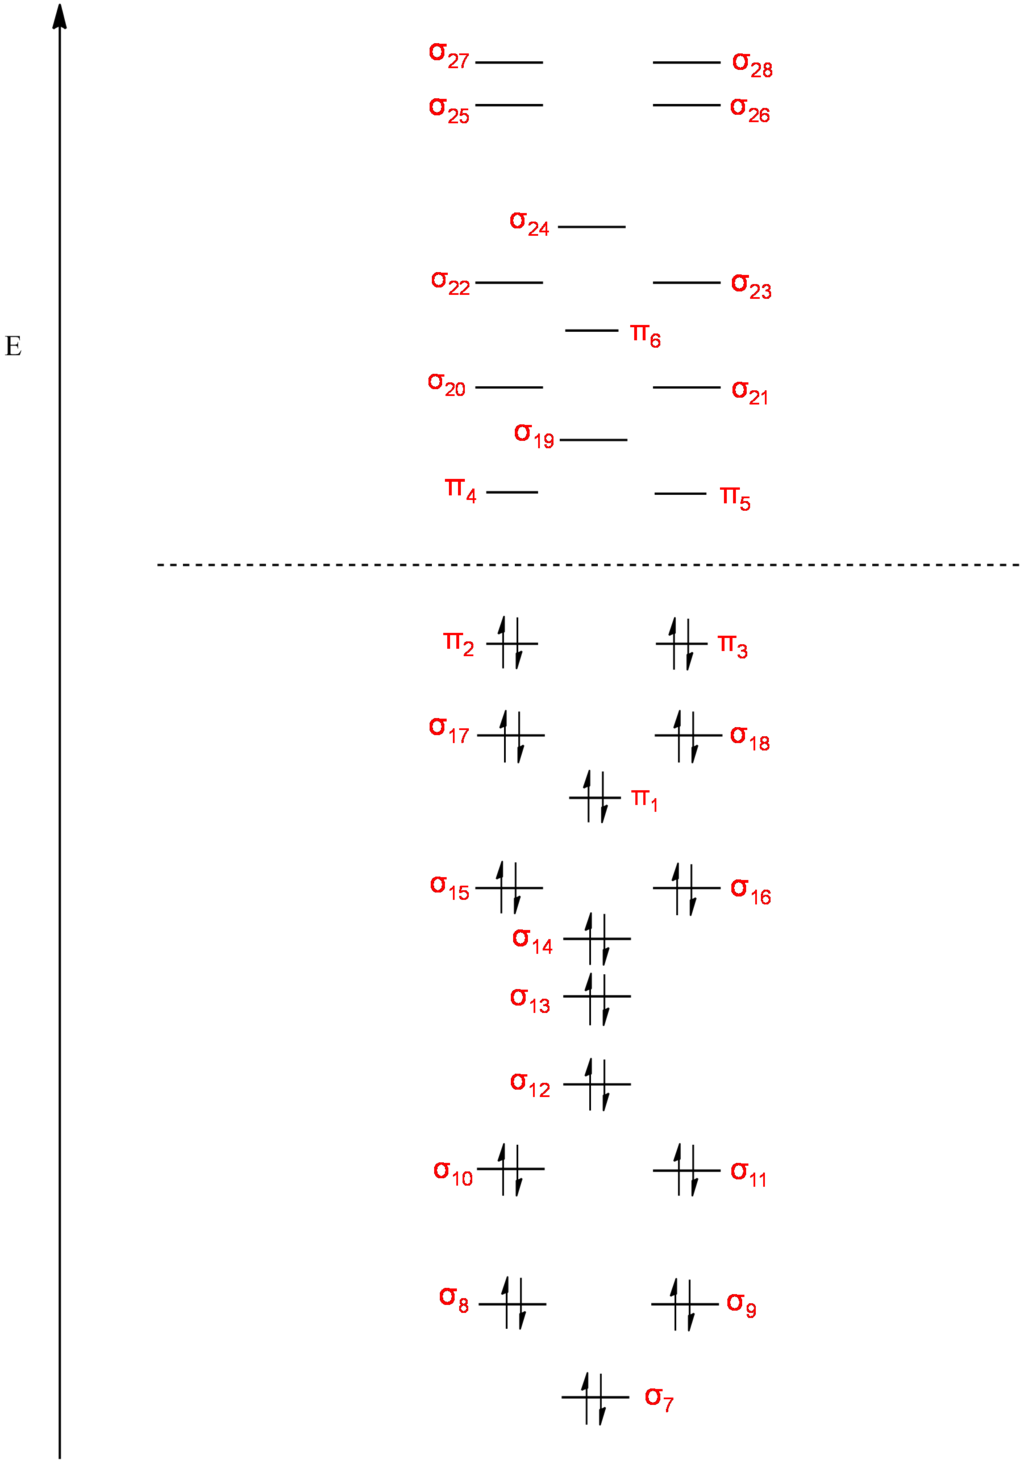
MO Diagram for Benzene: Pi Orbitals Only:
Black and White Molecular orbital diagrams obtained from: [5]
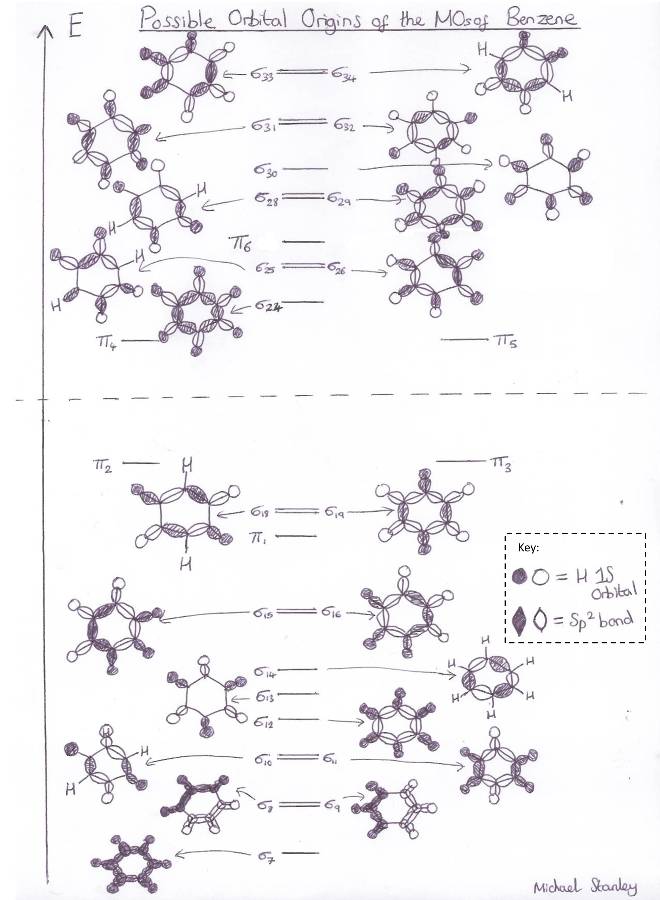
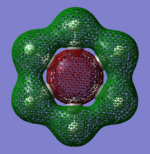
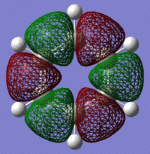
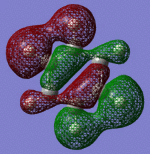
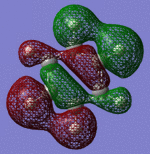
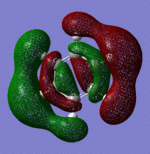
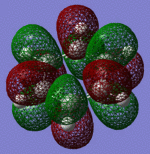
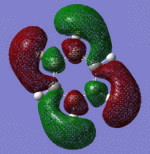
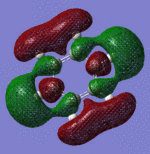
MO Diagram for Benzene: Sigma and Pi orbitals (Orbital pictures follow):
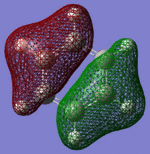
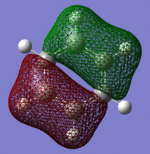
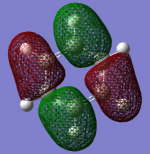
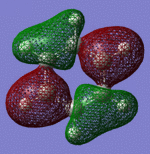
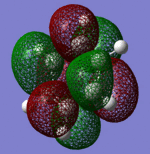
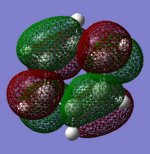
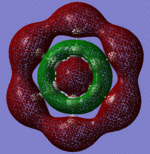
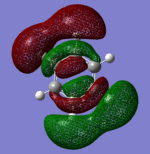
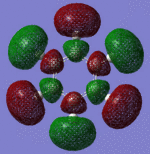
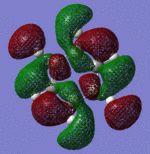
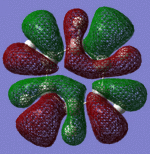
Molecular Orbitals of Benzene: Pi and Sigma:
 |
 |
 |
|
| Sigma Orbital 7 | Sigma Orbital 8 | Sigma Orbital 9 | Sigma Orbital 10 |
|---|
 |
 |
 |
|
| Sigma Orbital 11 | Sigma Orbital 12 | Sigma Orbital 13 | Sigma Orbital 14 |
|---|
 |
 |
 |
|
| Sigma Orbital 15 | Sigma Orbital 16 | Pi Orbital 17 | Sigma Orbital 18 |
|---|
 |
 |
 |
|
| Sigma Orbital 19 | Pi Orbital 20 | Pi Orbital 21 | Pi Orbital 22 |
|---|
 |
 |
 |
|
| Pi Orbital 23 | Sigma Orbital 24 | Sigma Orbital 25 | Sigma Orbital 26 |
|---|
 |
 |
 |
|
| Pi Orbital 27 | Sigma Orbital 28 | Sigma Orbital 29 | Sigma Orbital 30 |
|---|
 |
 |
 |
|
| Sigma Orbital 31 | Sigma Orbital 32 | Sigma Orbital 33 | Sigma Orbital 34 |
|---|
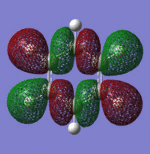
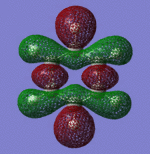
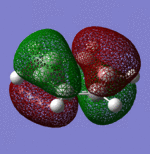
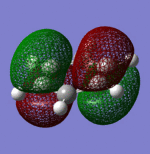
From inspection of the molecular orbitals calculated by Gaussian we can make a guess as to the AO's that were combined to make them.
Obviously the Pi symmetry orbitals are Pi in origin however guessing as to the origin of the sigma orbitals becomes quite difficult.
Below is an MO diagram I have constructed which displays what I believe to be the atomic orbitals responsible for the sigma MO's in Benzene:
NBO analysis of Benzene
Link to NBO analysis on D-Space: DOI:10042/20649
Charge Distribution of Benzene molecule:
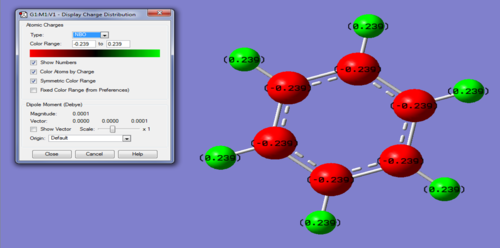
Charge range: -0.239 - 0.239
Specific charges on atoms: C = -0.239, H = 0.239
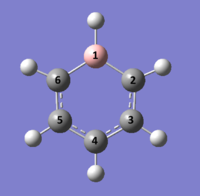
Boratabenzene
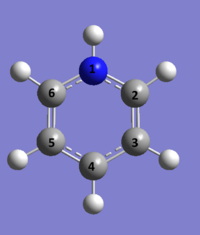
631G(d,p) optimisation of Boratabenzene
For JMol File:
Link to Boratabenzene 631G(d,p) optimisation on D-Space: DOI:10042/20800
Optimal Bond Distances: B1-C2 = 1.51 Å, C2-C3 = 1.40 Å, C3-C4 = 1.41 Å, C4-C5 = 1.41 Å, C5-C6 = 1.40 Å, C6-B1 = 1.51 Å.
Optimal Bond Angle: C6-B1-C1 = 115.11°
Boratabenzene 631G(d,p) optimization results summary table:
| Boratabenzene_Optimisation | ||
| File Name | MS_Boratabenzene_OPT_631Gdp | |
| File Type | .log | |
| Calculation Type | FOPT | |
| Calculation Method | RB3LYP | |
| Basis Set | 6-31G(d,p) | |
| Charge | -1 | |
| Spin | Singlet | |
| E(RB3LYP) | -219.0205299 | a.u. |
| RMS Gradient Norm | 0.00015729 | a.u. |
| Imaginary Freq | ||
| Dipole Moment | 2.8465 | Debye |
| Point Group | C1 | |
| Job cpu time: 3 minutes 2.4 seconds | ||
Calculation Log: 'Item' table of converged forces and distances for optimisation of Boratabenzene:
         Item               Value     Threshold  Converged?
 Maximum Force            0.000159     0.000450     YES
 RMS     Force            0.000068     0.000300     YES
 Maximum Displacement     0.000888     0.001800     YES
 RMS     Displacement     0.000326     0.001200     YES
 Predicted change in Energy=-6.533587D-07
 Optimization completed.
    -- Stationary point found.
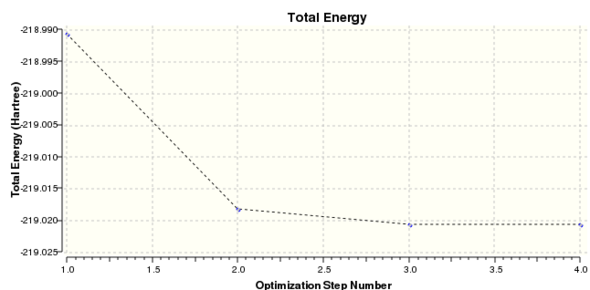 |

|
Total Energy Minimum Value for 631G(d,p) optimisation of Boratabenzene Molecule: -219.0205299 a.u.
631G(d,p) frequency analysis of Boratabenzene
For JMol File:
Link to Boratabenzene 631G(d,p) frequency analysis on D-Space: DOI:10042/20642
Boratabenzene 631G(d,p) frequency analysis results summary table:
| Boratabenzene_Frequency | ||
| File Name | MS_Boratabenzene_FREQ_631Gdp | |
| File Type | .log | |
| Calculation Type | FREQ | |
| Calculation Method | RB3LYP | |
| Basis Set | 6-31G(d,p) | |
| Charge | -1 | |
| Spin | Singlet | |
| E(RB3LYP) | -219.0205299 | a.u. |
| RMS Gradient Norm | 0.00015726 | a.u. |
| Imaginary Freq | 0 | |
| Dipole Moment | 2.8465 | Debye |
| Point Group | C1 | |
| Job cpu time: 4 minutes 22.8 seconds | ||
Calculation Log: 'Item' table of converged forces and distances for frequency analysis of Boratabenzene:
         Item               Value     Threshold  Converged?
 Maximum Force            0.000432     0.000450     YES
 RMS     Force            0.000157     0.000300     YES
 Maximum Displacement     0.000889     0.001800     YES
 RMS     Displacement     0.000394     0.001200     YES
 Predicted change in Energy=-7.120649D-07
 Optimization completed.
    -- Stationary point found.
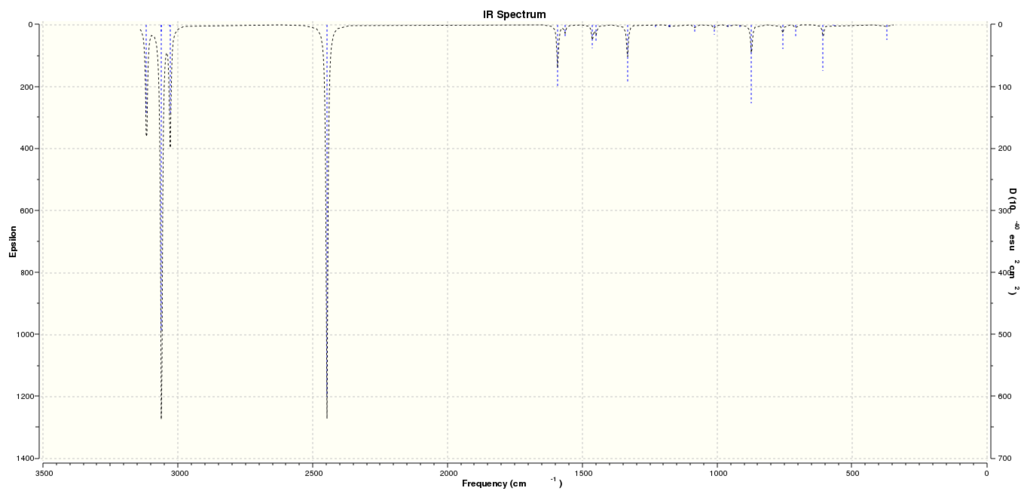
Low Frequencies:
Low frequencies ---  -13.1286   -0.0008   -0.0007    0.0005   15.0635   18.1734
 Low frequencies ---  371.3453  404.2332  565.2514
Computed IR Spectrum for Boratabenzene:
MO and NBO analysis of Boratabenzene
Link to Boratabenzene MO calculation on D-Space: DOI:10042/20876
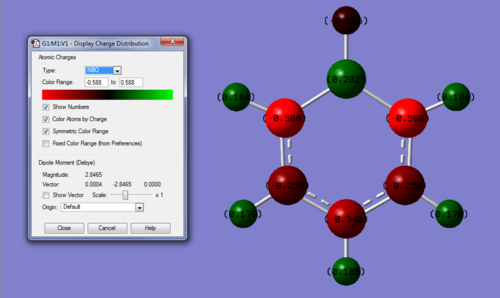
NBO analysis:
Charge range: -0.588 - +0.588
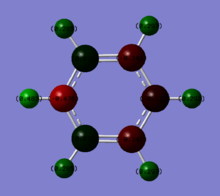
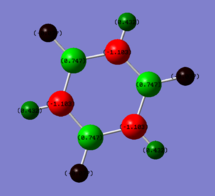
Specific charges on atoms: C(2,6) = -0.588, C(3,5) = -0.250, C(4) = -0.340, B = +0.202, H(1) = -0.096, H(2,6) = +0.184, H(3,5) = +0.179, H(4) = +0.186
Pyridinium
631G(d,p) optimisation of Pyridinium
For JMol File:
Link to Pyridinium 631G(d,p) optimisation on D-Space: DOI:10042/20801
Optimal Bond Distances: N1-C2 = 1.40 Å, C2-C3 = 1.39 Å, C3-C4 = 1.40 Å, C4-C5 = 1.39 Å, C5-C6 = 1.40 Å, C6-N1 = 1.39 Å.
Optimal Bond Angle: C6-N1-C1 = 120.0°
Pyridinium 631G(d,p) optimization results summary table:
| Pyridinium_Optimisation | ||
| File Name | MS_Pyridinium_OPT_631Gdp | |
| File Type | .log | |
| Calculation Type | FOPT | |
| Calculation Method | RB3LYP | |
| Basis Set | 6-31G(d,p) | |
| Charge | 1 | |
| Spin | Singlet | |
| E(RB3LYP) | -248.668074 | a.u. |
| RMS Gradient Norm | 0.0000391 | a.u. |
| Imaginary Freq | ||
| Dipole Moment | 1.8727 | Debye |
| Point Group | C1 | |
| Job cpu time: 3 minutes 0.1 seconds | ||
Calculation Log: 'Item' table of converged forces and distances for optimisation of Pyridinium:
         Item               Value     Threshold  Converged?
 Maximum Force            0.000064     0.000450     YES
 RMS     Force            0.000023     0.000300     YES
 Maximum Displacement     0.000822     0.001800     YES
 RMS     Displacement     0.000175     0.001200     YES
 Predicted change in Energy=-6.913998D-08
 Optimization completed.
    -- Stationary point found.
Intermediate geometry optimisation plots:
 |
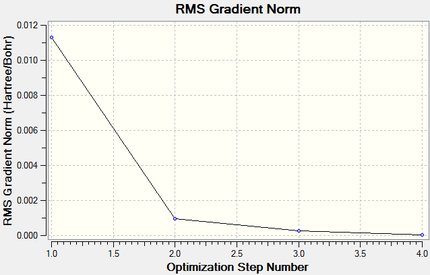 |
Total Energy Minimum Value for 631G(d,p) optimisation of Pyridinium Molecule: -248.668074 a.u.
631G(d,p) frequency analysis of Pyridinium
For JMol File:
Link to Pyridinium 631G(d,p) frequency analysis on D-Space: DOI:10042/20802
Pyridinium 631G(d,p) frequency analysis results summary table:
| Pyridinium_Frequency | ||
| File Name | MS_Pyridinium_FREQ_631Gdp | |
| File Type | .log | |
| Calculation Type | FREQ | |
| Calculation Method | RB3LYP | |
| Basis Set | 6-31G(d,p) | |
| Charge | 1 | |
| Spin | Singlet | |
| E(RB3LYP) | -248.668074 | a.u. |
| RMS Gradient Norm | 0.00003905 | a.u. |
| Imaginary Freq | 0 | |
| Dipole Moment | 1.8727 | Debye |
| Point Group | C1 | |
| Job cpu time: 5 minutes 52.4 seconds | ||
Calculation Log: 'Item' table of converged forces and distances for frequency analysis of Pyridinium:
         Item               Value     Threshold  Converged?
 Maximum Force            0.000155     0.000450     YES
 RMS     Force            0.000039     0.000300     YES
 Maximum Displacement     0.000775     0.001800     YES
 RMS     Displacement     0.000228     0.001200     YES
 Predicted change in Energy=-7.452539D-08
 Optimization completed.
    -- Stationary point found.
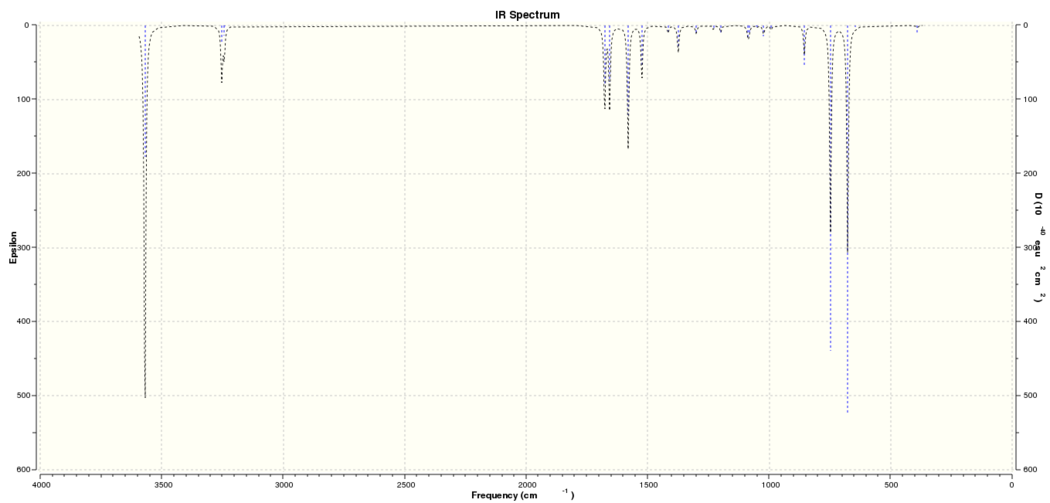
Low Frequencies:
Low frequencies ---   -7.2067   -0.0012   -0.0009   -0.0009   17.3396   18.5390
 Low frequencies ---  392.4558  404.0617  620.4714
Computed IR Spectrum for Pyridinium:
MO and NBO analysis of Pyridinium
Link to Pyridinium MO calculation on D-Space: DOI:10042/20878
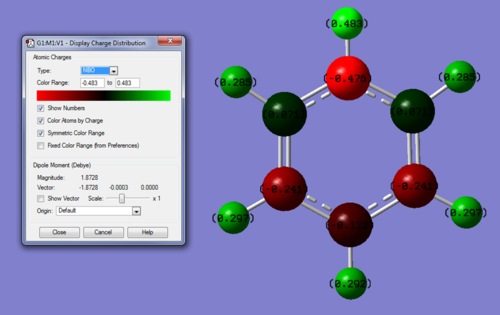
NBO anlaysis:
Charge range: -0.483 - +0.483
Specific charges on atoms: C(2,6) = +0.071, C(3,5) = -0.241, C(4) = -0.122, N = +0.202, H(1) = +0.483, H(2,6) = +0.285, H(3,5) = +0.297, H(4) = +0.292
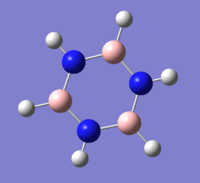
Borazine
631G(d,p) optimisation of Borazine
For JMol File:
Link to Borazine 631G(d,p) optimisation on D-Space: DOI:10042/20827
Optimal Bond Distance: 1.39 Å
Optimal Bond Angle: 120.0°
Borazine 631G(d,p) optimization results summary table:
| Borazine_Optimisation | ||
| File Name | MS_Borazine_OPT_631Gdp | |
| File Type | .log | |
| Calculation Type | FOPT | |
| Calculation Method | RB3LYP | |
| Basis Set | 6-31G(d,p) | |
| Charge | 0 | |
| Spin | Singlet | |
| E(RB3LYP) | -242.6845975 | a.u. |
| RMS Gradient Norm | 0.00017356 | a.u. |
| Imaginary Freq | ||
| Dipole Moment | 0.0003 | Debye |
| Point Group | C1 | |
| Job cpu time: 4 minutes 19.4 seconds | ||
Calculation Log: 'Item' table of converged forces and distances for optimisation of Borazine:
         Item               Value     Threshold  Converged?
 Maximum Force            0.000176     0.000450     YES
 RMS     Force            0.000078     0.000300     YES
 Maximum Displacement     0.000758     0.001800     YES
 RMS     Displacement     0.000289     0.001200     YES
 Predicted change in Energy=-8.301264D-07
 Optimization completed.
    -- Stationary point found.
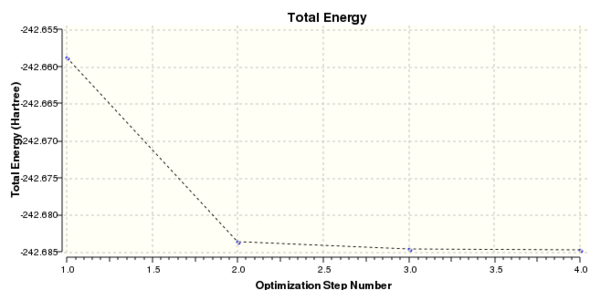
Intermediate geometry optimisation plots:
 |
 |
Total Energy Minimum Value for 631G(d,p) optimisation of Borazine Molecule: -242.6845975 a.u.
631G(d,p) frequency analysis of Borazine
For JMol File:
Link to Borazine 631G(d,p) frequency analysis on D-Space: DOI:10042/20828
Borazine 631G(d,p) frequency analysis results summary table:
| Borazine_Frequency | ||
| File Name | MS_Borazine_FREQ_631Gdp | |
| File Type | .log | |
| Calculation Type | FREQ | |
| Calculation Method | RB3LYP | |
| Basis Set | 6-31G(d,p) | |
| Charge | 0 | |
| Spin | Singlet | |
| E(RB3LYP) | -242.6845978 | a.u. |
| RMS Gradient Norm | 0.00017347 | a.u. |
| Imaginary Freq | 0 | |
| Dipole Moment | 0.0003 | Debye |
| Point Group | C1 | |
| Job cpu time: 5 minutes 38.8 seconds | ||
Calculation Log: 'Item' table of converged forces and distances for frequency analysis of Borazine:
         Item               Value     Threshold  Converged?
 Maximum Force            0.000426     0.000450     YES
 RMS     Force            0.000173     0.000300     YES
 Maximum Displacement     0.000902     0.001800     YES
 RMS     Displacement     0.000402     0.001200     YES
 Predicted change in Energy=-9.360321D-07
 Optimization completed.
    -- Stationary point found.
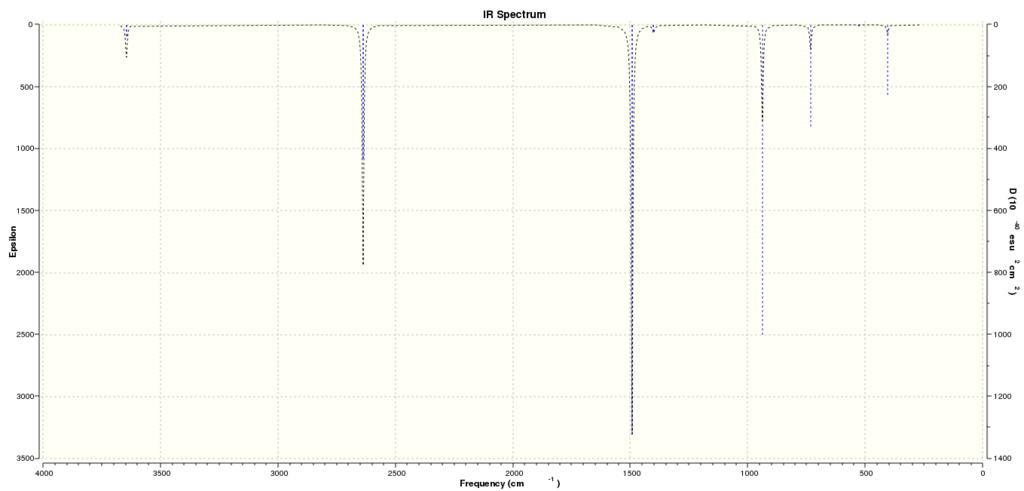
Low Frequencies:
Low frequencies ---   -0.0005    0.0006    0.0014    7.2644    8.6683   11.4869
 Low frequencies ---  289.3474  289.9361  404.2566
Computed IR Spectrum for Borazine:
MO and NBO analysis of Borazine
Link to Borazine MO calculation on D-Space: DOI:10042/20877
NBO anlaysis:
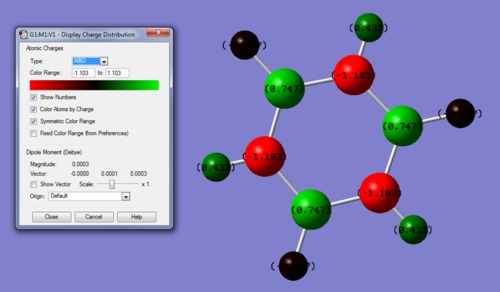
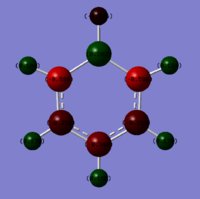
Charge range: -1.103 - +1.103
Specific charges on atoms: B = -1.103, N = +0.747, Boron Hydrogen's = +0.432, Nitrogen Hydorgen's = -0.077
Charge distribution and MO comparison
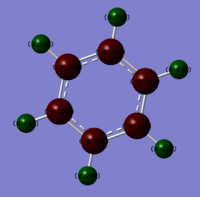
Charge distributions of Benzene, Boratobenzene, Pyridinium and Borazine:
| Benzene | Boratobenzene | Pyridinium | Borazine |
|---|---|---|---|
 |
 |
 |
|
Charge range set to -1.0 and +1.0 for comparison.
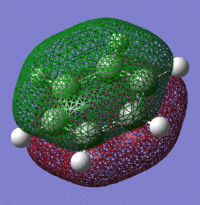
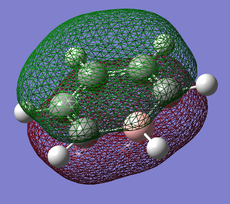
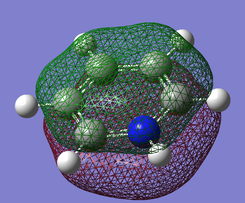
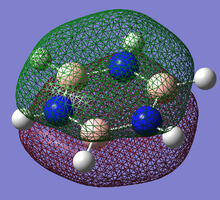
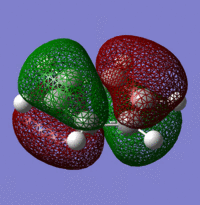
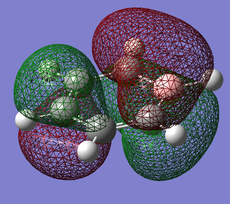
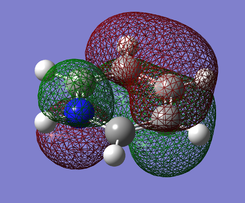
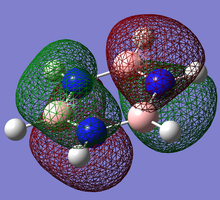
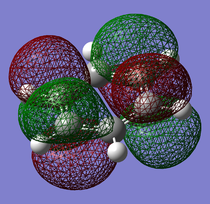
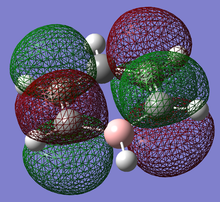
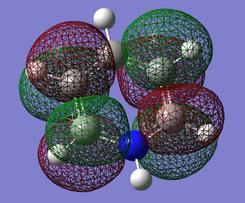
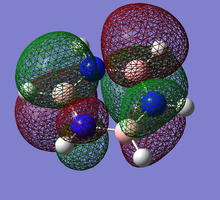
For the MO comparison I decided to compare the Pi(1) totally bonding orbital, the Pi(2) and Pi(5) orbitals as these would be the most important orbitals in terms of reactivity and aromaticity:
Pi(1) totally bonding orbital
| Benzene | Boratobenzene | Pyridinium | Borazine |
|---|---|---|---|
 |
 |
 |
|
Pi(2) orbital
| Benzene | Boratobenzene | Pyridinium | Borazine |
|---|---|---|---|
 |
 |
 |
|
Pi(5) orbital
| Benzene | Boratobenzene | Pyridinium | Borazine |
|---|---|---|---|
 |
 |
 |
|
Discussion
When we consider the totally bonding Pi(1) orbitals for Benzene, Boratabenzene, Pyridinium and Borazine we do not see any marked differences. This is understandable since the molecular orbital is made up of a cyclic array of p-orbitals which do not differ greatly in Carbon, Boron and Nitrogen.
Moving to the Pi(2) orbitals we begin to see differences emerging. In Boratabenzene there is a much larger cloud of electrons around the boron atom than in Benzene and conversely there is a much smaller cloud around the Nitrogen atom in Pyridinium. If we consider that in Boratabenzene the Boron atom has a formal negative charge, this explains the increased concentration of electron density around this part of the molecule. In Pyridinium there is a formal positive charge on the Nitrogen atom and thus we can now understand why there is a low density of electrons around this part of the molecule. In Borazine we see less of a marked difference from Benzene largely due to the high symmetry of the molecule.
Finally if we consider the Pi(5) orbital we do not see much of a marked change upon moving from Benzene to Boratabenzene and Pyridinium, however we do see a change in the molecular orbital for Borazine. The relative size of the lobes in the Borazine Pi(5) orbitals are different from that of benzene. Instead of symmetrical orbitals we observe two sets of differently sized lobes on either side of the molecule.
Effects of the Substitution on the MO diagram for Benzene:
On going from Benzene to Boratabenzene we would observe an increase in energy of the LCAOs containing Boron orbitals that contribute to the MOs. This is because Boron is less electronegative than Carbon. As a result the energy of the bonding MO's would increase and the energy of the anti-bonding MO's would decrease. This is due to poor overlap of the LCAOs contributing to the MO's due to the change in energy. Due to the reduction in symmetry on going from Benzene to Boratabenzene we would expect there to be less degenerate MO's.
On going from Benzene to Pyridinium we would observe an decrease in energy of the LCAOs containing Nitrogen orbitals that contribute to the MOs. This is because Nitrogen is more electronegative than Carbon. As a result the energy of the bonding MO's would increase and the energy of the anti-bonding MO's would decrease. This is due to poor overlap of the LCAOs contributing to the MO's due to the change in energy. Due to the reduction in symmetry on going from Benzene to Pyridinium we would expect there to be less degenerate MO's.
On going from Benzene to Borazene we would expect to see a dramatic change in the relative energy levels of the MOs. This can be rationalised by the large difference in energy of the Nitrogen and Boron LCAOs that contribute to the overall MO and would result in poor orbital overlap between the LCAOs. We can expect to see much smaller splitting of the energy levels in the MO due to this orbital mismatch.
References
- ↑ J.Glaser, G.Johansson.On the Structures of the Hydrated Thallium(III) Ion and it's Bromide Complexes in Aqueous Solution. Department of Inorganic Chemistry, Royal Institute of Technology, Sweden. [Online] 1982: 125. Available from: http://actachemscand.dk/pdf/acta_vol_36a_p0125-0135.pdf [Accessed: 19th October 2012]
- ↑ Dr. Hunt, Hunt Research Group, Department of Chemistry, Imperial College London, BH3 Tutorial Problem [ONLINE]. Available from: http://www.huntresearchgroup.org.uk/teaching/teaching_comp_lab_year3/Tut_MO_diagram_BH3.pdf [Accessed 18th October 2012].
- ↑ Dr. Antonio Tilocca, Royal Society Uinversity Research Fellow, University College London, Main Energy conversion factors [ONLINE]. Available from: http://www.ucl.ac.uk/~uccaati/Energy.html [Accessed 19th October 2012].
- ↑ S.Xie, Y.Song, Z.Liu, In situ high-pressure study of ammonia borane by Raman and IR spectroscopy [ONLINE]. Available from: http://publish.uwo.ca/~ysong56/Publications/Pub40_NH3BH3_CJC.pdf [Accessed 19th October 2012].
- ↑ Department of Chemistry, University of Western Ontario, Aromaticity. [ONLINE]. Available from: http://instruct.uwo.ca/chemistry/373f/Nifty%20Stuff/aromaticity%201.htm [Accessed 18th October 2012].

