Rep:Mod:ss7009mod2
SNEHA SHAH: Computational Lab Module 2
BH3
Quantum chemistry has been used to analyse the structure of borane. This structure was created on GaussView 5.0.9. The trigonal planar structure was manipulated so that each of the B-H bond distances was set to 1.5Å.
BH3 Optimisation DOI:10042/to-10746
An optimisation calculation was carried out for BH3. This involved altering the molecular geometry to an energy minimum. The following criterion was followed for the calculation for the optimised geometry:
- Method: B3LYP
- Basic Set: 3-21G
- Type of Calculation: OPT (Optimisation)
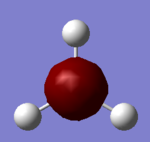
The method determines the type of approximations that are made in solving the Schrodinger equation [1]. There are different basis sets which can be used, which correspond to the accuracy of the calculation. 3-21G has a very low accuracy; however, this indicates that the calculations are very quick [1], enabling the optimisation to be run on Gaussian. The structure of the molecule is shown below (Figure 1), highlighting the corresponding optimised bond angle and equilibrium bond length. These values calculated computationally reflect the literature values [2]. This indicates that the results are reliable; suggesting the low accuracy of the basic set has not affected the calculation. It can be inferred that this is due to the fact the BH3 is a small molecule; hence the optimised molecule can be easily determined. Please note that the calculated bond distances are accurate to 0.01Å and the bond angles are accurate to 0.1° [1].
| BH3 | ||
| Image | ||
| Bond Distance/ Å | 1.19 | |
| Bond Angle/ ° | 120 | |
Analysis of Output
Figure 2 shows a summary of the important information related to the optimisation, indicating whether or not the calculation has been run. The file type: FOPT indicates that a full optimisation has been requested by the program [3]. The calculation type, calculation method, basis set and job computing time have been recorded. The minimum energy is shown in atomic units. The gradient is close to zero (less than 0.001 a.u.). This can be used as supporting evidence that the calculation was run successfully [1]. A gradient on the potential energy curve less than 0.001 a.u. is considered to be the minimum. It can be assumed that as an energy minimum has been established, the optimisation has in fact been carried out. The dipole moment has been recorded as zero Debye; this is consistent with the symmetry of the molecule. The point group of the molecule has been calculated as D3h which again is consistent with the symmetry assignments of the molecule, and corresponds to the literature [2].
BH3 Optimisation
File Name    OPTIMIZED MOLECULE
File Type    .log
Calculation Type    FOPT
Calculation Method    RB3LYP
Basis Set    3-21G
Charge    0
Spin    Singlet
E(RB3LYP)    -26.46226338     a.u.
RMS Gradient Norm    0.00020672     a.u.
Imaginary Freq
Dipole Moment    0.0000     Debye
Point Group    D3H
Job cpu time:  0 days  0 hours  0 minutes  6.0 seconds.
The “real” output shown in Figure 3 below, provides further evidence that the optimization calculation was successful. The figure shows that the forces and displacements have converged. The force is the gradient of the energy vs. distance graph and the fact that the placements have converged indicates that a small displacement will not affect the energy. This is an indication that the optimisation had proceeded [1]. Furthermore, the calculated derivative values shown in Figure 3 correlate with the gradient value in Figure 2 of less than 0.001 a.u. Analysis of the BH3 optimisation indicates that the calculation was successful and the results that will now be formed are reliable.
         Item               Value     Threshold  Converged?
 Maximum Force            0.000413     0.000450     YES
 RMS     Force            0.000271     0.000300     YES
 Maximum Displacement     0.001610     0.001800     YES
 RMS     Displacement     0.001054     0.001200     YES
 Predicted change in Energy=-1.071764D-06
 Optimization completed.
    -- Stationary point found.
                           ----------------------------
                           !   Optimized Parameters   !
                           ! (Angstroms and Degrees)  !
 --------------------------                            --------------------------
 ! Name  Definition              Value          Derivative Info.                !
 --------------------------------------------------------------------------------
 ! R1    R(1,2)                  1.1935         -DE/DX =    0.0004              !
 ! R2    R(1,3)                  1.1935         -DE/DX =    0.0004              !
 ! R3    R(1,4)                  1.1935         -DE/DX =    0.0004              !
 ! A1    A(2,1,3)              120.0            -DE/DX =    0.0                 !
 ! A2    A(2,1,4)              120.0            -DE/DX =    0.0                 !
 ! A3    A(3,1,4)              120.0            -DE/DX =    0.0                 !
 ! D1    D(2,1,4,3)            180.0            -DE/DX =    0.0                 !
 --------------------------------------------------------------------------------
 GradGradGradGradGradGradGradGradGradGradGradGradGradGradGradGradGradGrad
Graphical Representation of Output
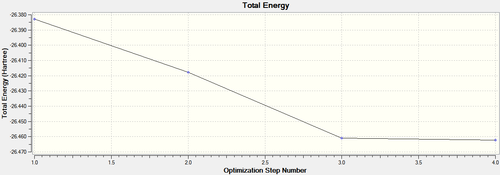
The optimisation calculation can also be illustrated graphically. Figure 3 shows the Total Energy Curve and the Root Mean Square (RMS) Gradient Curve. GuassView has carried out the optimisation procedure by traversing the Potential Energy Surface (PES) of BH3 in order to determine the energy minimum structure. There are four points on the energy graph indicating that three different structures were calculated before the optimised structure (fourth point) was determined. The nuclei and electrons in the optimised structure are in equilibrium. They experience no forces trying to push them one way or another. Therefore, the optimised structure is the most stable structure [1], the structure with the lowest energy. The gradient graph shows the gradient coming to zero as the minimum is approached. This is consistent with the theory as when the system is in equilibrium, the first derivative of the PES is zero [1].
| Energy Graph | Gradient Graph |
|---|---|
 |
 |
Figure 4 shows the structure, energy value and gradient of BH3 at each optimisation step. Optimisation step four has the lowest energy value and a gradient of zero. Please note, the structure of the first step doesn’t have any bonds, however the bonds are still there! A suitable definition for a bond is an attraction between atoms that allows the formation of chemical substances. However, in computational chemistry this definition is not complete. Gausview defines a bond as a structural convenience. As stated above, the B-H bond distance has been set at 1.5Å. Therefore, the bonds are not seen in GaussView because the bond distance in the optimised structure exceeds the specified value, however, the interaction between the atoms is still present [1].
Vibrational Analysis DOI:10042/to-10747
A frequency calculation was carried out for borane. This involved determining the second derivative of the potential energy surface and the IR and Raman modes to support the BH3 structure. The following criterion was followed for the calculation for the vibrational analysis:
- Type of Calculation: Frequency
- Method: B3LYP
- Basic Set: 3-21G
- Additional Keywords: pop=(full, nbo)
Analysis of Output
The additional keywords inputted indicate that a full analysis of the electron density and MOs has been requested by the program [1]. Figure 5 shows a summary of the important information related to the frequency calculation, indicating whether or not the calculation has been run. The energy of the structure after the frequency calculation is the same as the energy of the BH3 structure after the optimisation calculation (-26.46 a.u.). This shows that the structures are the same and that the calculation was successful [1].
BH3 Frequency
File Name    SS7009_BH3_FREQ
File Type    .log
Calculation Type    FREQ
Calculation Method    RB3LYP
Basis Set    3-21G
Charge    0
Spin    Singlet
E(RB3LYP)    -26.46226338     a.u.
RMS Gradient Norm    0.00020662     a.u.
Imaginary Freq    0
Dipole Moment    0.0000     Debye
Point Group    C3H
Job cpu time:  0 days  0 hours  0 minutes  5.0 seconds.
The “real” output shown in Figure 6 below, provides further evidence that the frequency calculation was successful. The first row of “low frequencies” corresponds to the 3N-6 vibrational frequencies. These are the motions of the center of mass of a molecule [1]. These values are all much smaller than the frequency value of the first vibration listed (1144.15 cm-1) which is what is expected. Analysis of the BH3 frequency calculation indicates that the calculation was successful and the results that will now be formed are reliable.
Low frequencies ---  -66.7625  -66.3592  -66.3589   -0.0020    0.0031    0.2123
 Low frequencies --- 1144.1483 1203.6413 1203.6424
 Harmonic frequencies (cm**-1), IR intensities (KM/Mole), Raman scattering
 activities (A**4/AMU), depolarization ratios for plane and unpolarized
 incident light, reduced masses (AMU), force constants (mDyne/A),
 and normal coordinates:
                     1                      2                      3
                    A"                     E'                     E'
 Frequencies --  1144.1483              1203.6413              1203.6424
 Red. masses --     1.2531                 1.1085                 1.1085
 Frc consts  --     0.9665                 0.9462                 0.9462
 IR Inten    --    92.8665                12.3148                12.3173
  Atom  AN      X      Y      Z        X      Y      Z        X      Y      Z
     1   5     0.00   0.00   0.16     0.00   0.10   0.00    -0.10   0.00   0.00
     2   1     0.00   0.00  -0.57     0.00   0.08   0.00     0.81   0.00   0.00
     3   1     0.00   0.00  -0.57    -0.38  -0.59   0.00     0.14   0.38   0.00
     4   1     0.00   0.00  -0.57     0.38  -0.59   0.00     0.14  -0.38   0.00
Graphical Representation of Output
Figure 7 tabulates each of the six vibrations and the corresponding intensities, frequencies and symmetry labels. The frequency calculation can also be illustrated graphically, Figure 8. Remember, the frequency analysis is essentially determining the second derivative of the PES. The frequencies are all positive indicating that a minimum has been established, which is what was requested by the program. This shows that the frequency calculation was successful. If one of the frequencies was negative, this would mean a transition state has been established and if more than one negative frequency is seen, this would mean that the calculation was not successful [1].
| Results of Frequency Calculation | ||||||
| Number | Form of Vibration | Description of Vibrational Mode | Frequency/ cm-1 | Intensity | Symmetry D3h Point Group | |
| 1 |  |
Out-of-plane bending (wagging): All the hydrogens move up and down, along the z axis in a concerted motion. The boron atom moves in the opposite direction to the hydrogen atoms to preserve the centre of mass of the molecule [4]. | 1144 | 92.87 | A2' | |
| 2 |  |
In-plane bending (scissoring): Two of the hydrogen atoms (as shown) come together and move apart in a concerted manner. The final hydrogen and the boron atom move together in and out to preserve the centre of mass during the vibration. | 1204 | 12.31 | E' | |
| 3 | 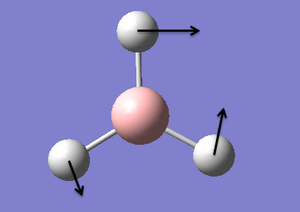 |
In-plane bending (rocking): The boron and two hydrogens "rock" in a concerted manner in the plane of the molecule. The top hydrogen "rocks" in the opposite direction. | 1204 | 12.32 | E' | |
| 4 | 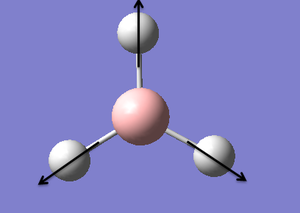 |
Symmetrical Stretch: All the hydrogen atoms move in and out in a concerted motion. The Boron atom is stationary. | 2598 | 0.00 | A1' | |
| 5 |  |
Asymmetric Stretch: Two of the hydrogens move in and out in an asymmetrical motion. The top hydrogen in stationary. The born atom moves in an opposing manner to preserve the centre of mass. | 2737 | 103.74 | E' | |
| 6 | 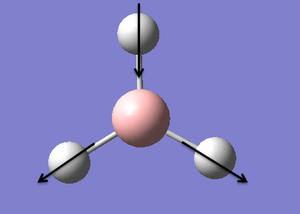 |
Asymmetric Stretch: Two of the hydrogens move in and out in a concerted motion. The other hydrogen moves out and in (in the opposite direction). The boron atom is stationary. | 2737 | 103.73 | E' | |
Please note frequencies in wavenumbers (cm-1) are tabulated with no decimal places by convention. There is a known systematic error of ca. 10% (10cm-1) due to the fact that a harmonic approximation for the vibrations has been used for an anharmonic vibration calculation [1]. This systematic error is more prominent for higher energy vibrations than lower energy vibrations.
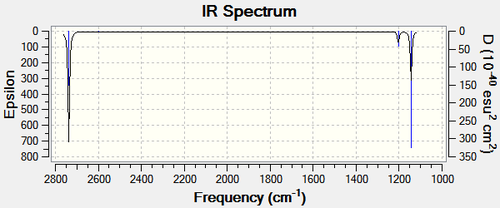
The 3N-6 rule, when N=4 results in six fundamental vibrational frequencies. This is consistent with the frequency calculation carried out on Guassview as shown in Figure 7. However, Figure 8 shows only 3 distinct vibrational bands. Trigonal planar BH3 is an example of why one does not always observe as many bands as implied by the simple calculation. The two in-plane bending vibrations are equivalent (they have the same symmetry, E’) and therefore, have the same frequency; they are considered to be degenerate appearing in the IR spectrum at 1204 cm-1. Therefore, these two vibrational modes are seen as one band [4]. This is also the case with the two asymmetrical stretches, with symmetry of E’ as well, appearing at 2737 cm-1. The symmetrical stretch of BH3 is inactive in the infrared spectrum because this vibration produces no change in the dipole moment. In order to be IR active, the dipole moment of the molecule must change during the act of a vibration [4]. It can be theoretically proven that this symmetrical stretch ( A1') is IR inactive as the calculation produces an intensity of zero (Figure 7). Therefore, analysis of the frequency calculation shows that although there are six fundamental vibrational modes for BH3, only three distinct bands are observed.
Molecular Orbitals of BH3
Qualitative Approach
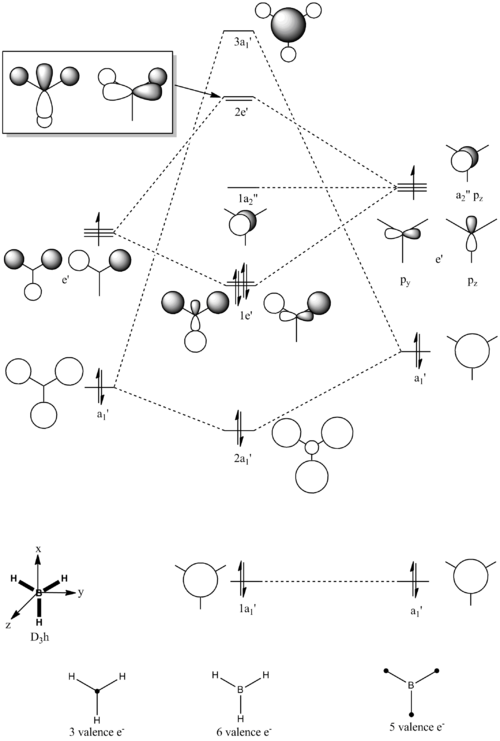
Figure 9 shows the molecular orbital diagram for BH3, produced on ChemDraw Pro 12.0. The symmetry adapted orbitals of the fragment H3 were derived from the Reduction and Projection formulas. The relative energy levels of the fragment orbitals (H3 and B) were estimated based on the theory: the more electronegative the atom the lower the orbital energies. The boron atom is considered to be only slightly more electropositive than hydrogen; however, the actual energy difference shown is only a qualitative prediction [5]. The 1s boron AO was considered to be too low in energy to interact. Fragment orbitals of the same symmetry were then combined to form the molecular orbitals via the LCAO approach. The size of each fragment orbital in the corresponding MO is a reflection of the magnitude of the coefficient in the LCAO equation [5]. The energy levels, and hence the ordering of the MOs were determined based upon the relative splitting energy. The splitting energy is the overall amount of energy by which the MOs are shifted from the FOs [5]. Again, the splitting energies shown in Figure 9 are only a qualitative approximation; a full calculation is necessary before a definitive energy ordering can be obtained [5].
Computational Approach DOI:10042/to-10750
An energy calculation was carried out for borane. This involved solving the electronic structure which would further allow computed MOs to be visualized. The following criterion was followed for the calculation:
- Type of Calculation: Energy
- Method: B3LYP
- Basic Set: 3-21G
- NBO: Full NBO
- Additional Keywords: pop= (full)
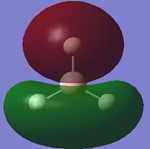
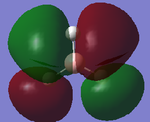
The additional keywords inputted indicate that an MO analysis has been requested by the program [1]. Figure 10 tabulates the relevant molecular orbitals and their corresponding energy levels. These are the quantitative or computed MOs which can be compared and contrasted to the qualitative or approximate MOs produced via the MO diagram (Figure 9)[1].
The first prediction, “the 1s boron AO was considered to be too low in energy to interact”, is supported by the computational calculation. This can be seen by the 1a1’ computed MO of the boron atom, the spherical orientation of the electron density is only on the boron suggesting that there is no interaction with the hydrogen fragment, justified by the significantly low energy level, -6.73.
The shapes of each of the real MOs can be matched well with the approximated diagrams by the LCAO approach. Please note: the computed diagrams do not show the individual s and/or p orbitals involved in each molecular orbital. However, the shapes and sizes of the MOs are similar and the nodal planes are clearly accurate. This shows that the LCAO equation is a good approximation for determining the molecular orbitals.
However, determining the splitting energy and hence, the relative ordering of the molecular orbitals was the most difficult to evaluate qualitatively. This is because different factors need to be considered: the energy difference between the orbitals, the orbital coupling and the extent of orbital overlap [5]. How much each factor contributes will determine the stability of each molecular orbital. Computational methods solve the Schrodinger Equation to determine the exact energy of each molecular orbital [5]. Therefore, this quantitative approach is more accurate at determining the ordering of the molecular orbitals.
Overall, the computational method supports the qualitative method well. This indicates that the MO diagram produced based on simple chemistry is a good representation for BH3. However, this MO diagram had a number of approximations which were difficult to predict; more complex molecules would be better modeled using computational methods as well as a qualitative analysis.
Natural Bond Orbital Analysis
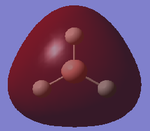
The energy calculation carried out above for the MO analysis can also be used for the NBO analysis; however, the .log output file was used this time. NBO analysis is usual as it provides a greater understanding of each of the orbitals involved. Figure 11 depicts the charge distribution in BH3 presented by GuassView.
| Charge Distribution by colour | Individual Charge Values |
|---|---|
 |
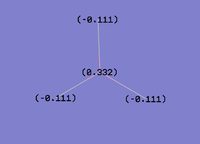 |
The bright green colour indicates the highly positive charge of boron; the calculated value (+0.333) is consistent with its Lewis deficient nature [1]. This can also be seen by the MO diagram, showing the LUMO as the empty boron pz orbital (Figure 9). Figure 11 shows the hydrogens to be coloured red corresponding with their negative charge. The calculated value (-0.111) for each hydrogen indicates that the negative charge is distributed evenly amongst the hydrogens. Figure 12 (below) illustrates the charge distribution across the molecule as well. However, it also shows that the addition of all the individual natural charges equals a total overall charge of zero; agreeing with the overall dipole moment of the molecule.
Summary of Natural Population Analysis:

                                       Natural Population
                Natural  -----------------------------------------------
    Atom  No    Charge         Core      Valence    Rydberg      Total
 -----------------------------------------------------------------------
      B    1    0.33161      1.99903     2.66935    0.00000     4.66839
      H    2   -0.11054      0.00000     1.11021    0.00032     1.11054
      H    3   -0.11054      0.00000     1.11021    0.00032     1.11054
      H    4   -0.11054      0.00000     1.11021    0.00032     1.11054
 =======================================================================
   * Total *    0.00000      1.99903     6.00000    0.00097     8.00000
Figure 13 (below) details the individual contributions to the bonding in borane. This is important as it helps describe the nature of each type of bond. All three B-H bonds are equivalent. Boron contributes 49.49% to this bond and hydrogen contributes 55.51%. The boron orbital in this bond consists of 33.33% s character and 66.67% p character, indicating a sp2 hybridisation. The hydrogen orbital in this bond is 100.00% s character. To summarize, the boron atom has formed three sp2 hybrid orbitals which each interact with the s orbital of hydrogen [1].
Orbital 4 is the core 1s boron orbital which does not interact with hydrogen, therefore as expected this consists of 100.00% s character. Orbital 5 is the boron lone pair, the star indicates that it is unoccupied. This is expected to be the pz orbital of boron (which is consistent with the MO diagram, Figure 9). However, Figure 13 shows that the orbital is 100.00% s character. The origin of this inconsistency is unknown; it is possible that it could be a result of the low accuracy basic set used during the calculation [1].
       (Occupancy)   Bond orbital/ Coefficients/ Hybrids
 ---------------------------------------------------------------------------------
     1. (1.99853) BD ( 1) B   1 - H   2
                ( 44.48%)   0.6669* B   1 s( 33.33%)p 2.00( 66.67%)
                                            0.0000  0.5774  0.0000  0.0000  0.0000
                                            0.8165  0.0000  0.0000  0.0000
                ( 55.52%)   0.7451* H   2 s(100.00%)
                                            1.0000  0.0000
     2. (1.99853) BD ( 1) B   1 - H   3
                ( 44.48%)   0.6669* B   1 s( 33.33%)p 2.00( 66.67%)
                                            0.0000  0.5774  0.0000  0.7071  0.0000
                                           -0.4082  0.0000  0.0000  0.0000
                ( 55.52%)   0.7451* H   3 s(100.00%)
                                            1.0000  0.0000
     3. (1.99853) BD ( 1) B   1 - H   4
                ( 44.48%)   0.6669* B   1 s( 33.33%)p 2.00( 66.67%)
                                            0.0000  0.5774  0.0000 -0.7071  0.0000
                                           -0.4082  0.0000  0.0000  0.0000
                ( 55.52%)   0.7451* H   4 s(100.00%)
                                            1.0000  0.0000
     4. (1.99903) CR ( 1) B   1           s(100.00%)
                                            1.0000  0.0000  0.0000  0.0000  0.0000
                                            0.0000  0.0000  0.0000  0.0000
     5. (0.00000) LP*( 1) B   1           s(100.00%)
Figure 14 (below) outlines interactions between various MOs. An energy value in the E(2) column greater than 20 kcal/mol would highlight any mixing that occurs [1]. BH3 does not undergo mixing, as shown by the MO analysis in Figure 9 and 10 and supported by the NBO analysis below (Figure 14).
 Second Order Perturbation Theory Analysis of Fock Matrix in NBO Basis

     Threshold for printing:   0.50 kcal/mol
                                                                              E(2)  E(j)-E(i) F(i,j)
         Donor NBO (i)                     Acceptor NBO (j)                 kcal/mol   a.u.    a.u.
 ===================================================================================================

 within unit  1
   4. CR (   1) B   1                / 10. RY*(   1) H   2                    1.51    7.54    0.095
   4. CR (   1) B   1                / 11. RY*(   1) H   3                    1.51    7.54    0.095
   4. CR (   1) B   1                / 12. RY*(   1) H   4                    1.51    7.54    0.095
Figure 15 below shows the energy and population/occupation of the B-H bonds, and the boron lone pair (B(LP*))[1].
 Natural Bond Orbitals (Summary):

                                                            Principal Delocalizations
           NBO                        Occupancy    Energy   (geminal,vicinal,remote)
 ====================================================================================
 Molecular unit  1  (H3B)
     1. BD (   1) B   1 - H   2          1.99853    -0.43712
     2. BD (   1) B   1 - H   3          1.99853    -0.43712
     3. BD (   1) B   1 - H   4          1.99853    -0.43712
     4. CR (   1) B   1                  1.99903    -6.64476  10(v),11(v),12(v)
     5. LP*(   1) B   1                  0.00000     0.67666
     6. RY*(   1) B   1                  0.00000     0.37177
     7. RY*(   2) B   1                  0.00000     0.37177
     8. RY*(   3) B   1                  0.00000    -0.04532
     9. RY*(   4) B   1                  0.00000     0.43446
    10. RY*(   1) H   2                  0.00032     0.90016
    11. RY*(   1) H   3                  0.00032     0.90016
    12. RY*(   1) H   4                  0.00032     0.90016
    13. BD*(   1) B   1 - H   2          0.00147     0.41201
    14. BD*(   1) B   1 - H   3          0.00147     0.41201
    15. BD*(   1) B   1 - H   4          0.00147     0.41201
       -------------------------------
              Total Lewis    7.99463  ( 99.9329%)
        Valence non-Lewis    0.00441  (  0.0551%)
        Rydberg non-Lewis    0.00097  (  0.0121%)
       -------------------------------
            Total unit  1    8.00000  (100.0000%)
           Charge unit  1    0.00000
TlBr3
Quantum chemistry has been used to analyze the structure of TlBr3. This structure was created on GaussView 5.0.9. The symmetry of the structure was restricted to D3h. This will ensure that there are no problems when carrying out the vibrational analysis [1].
TlBr3 Optimisation DOI:10042/to-10748
An optimisation calculation was carried out for TlBr3. This involved altering the molecular geometry to an energy minimum. The following criterion was followed for the calculation for the optimised geometry:
▪ Method: B3LYP
▪ Basic Set: LANL2DZ
▪ Type of Calculation: OPT (Optimisation)
There are different basis sets, which can be used, which correspond to the number of functions used to determine the electronic structure [1]. LANL2DZ is a larger basis set than any that has been previously used and is better suited to treating second row elements and above. It uses pseudo potentials for heavier atoms; pseudo potentials are able to recover some of the relativistic effects, which arise from the large electron count of the atoms [1]. The structure of the molecule is shown below (Figure 16), highlighting the corresponding optimised bond angle and equilibrium bond length. These values calculated computationally reflect the literature values [6], indicating that the results are not unreasonable. Please note that the calculated bond distances are accurate to 0.01Å and the bond angles are accurate to 0.1°.
| TlBr3 | ||
| Image | ||
| Bond Distance/ Å | 2.65 | |
| Bond Angle/ ° | 120 | |
Analysis of Output
Figure 17 shows a summary of the important information related to the optimisation, indicating whether or not the calculation has been run. The file type: FOPT indicates that a full optimisation has been requested by the program [3]. The calculation type, calculation method, basis set and job computing time have been recorded. The minimum energy is shown in atomic units. The gradient is close to zero (less than 0.001 a.u.). This can be used as supporting evidence that the calculation was run successfully. A gradient on the potential energy curve less than 0.001 a.u. is considered to be the minimum [1]. It can be assumed that as an energy minimum has been established, the optimisation has in fact been carried out. The dipole moment has been recorded as zero Debye; this is consistent with the symmetry of the molecule. The point group of the molecule has been calculated as D3h which again is consistent with the symmetry assignments of the molecule, and corresponds to the literature [6].
TlBr3 Optimisation
File Name    TLBR3 OPTIMIZATION
File Type    .log
Calculation Type    FOPT
Calculation Method    RB3LYP
Basis Set    LANL2DZ
Charge    0
Spin    Singlet
E(RB3LYP)    -91.21812851     a.u.
RMS Gradient Norm    0.00000090     a.u.
Imaginary Freq
Dipole Moment    0.0000     Debye
Point Group    D3H
Job cpu time:  0 days  0 hours  0 minutes 13.0 seconds.
The “real” output shown in Figure 18 below, provides further evidence that the optimization calculation was successful. The figure shows that the forces and displacements have converged. The force is the gradient of the energy vs. distance graph and the fact that the placements have converged indicates that a small displacement will not affect the energy [1]. This is an indication that the optimisation had proceeded, the calculation was successful and the results that will now be formed are reliable.
 Item               Value     Threshold  Converged?
 Maximum Force            0.000002     0.000450     YES
 RMS     Force            0.000001     0.000300     YES
 Maximum Displacement     0.000022     0.001800     YES
 RMS     Displacement     0.000014     0.001200     YES
 Predicted change in Energy=-6.082801D-11
 Optimization completed.
    -- Stationary point found.
Vibrational AnalysisDOI:10042/to-10749
A frequency calculation was carried out for the trigonal planar molecule. This involved determining the second derivative of the potential energy surface and the IR and Raman modes to support the TlBr3 structure. The following criterion was followed for the calculation for the vibrational analysis:
- Type of Calculation: Frequency
- Method: B3LYP
- Basis Set: LANL2DZ
The same calculation method and basis set MUST be used for both calculations. This is because the same level of accuracy must be requested by the program for both calculations in order for correct results to be obtained. The vibrational calculation must be run on the optimsied structure of TlBr3 [1].
Analysis of Output
Figure 19 shows a summary of the important information related to the frequency calculation, indicating whether or not the calculation has been run. The energy of the structure after the frequency calculation is the same as the energy of the optimised TlBr3 structure (-91.22 a.u.). This shows that the structures are the same and that the calculation was successful [1].
TlBr3 Frequency
File Name    log_50621
File Type    .log
Calculation Type    FREQ
Calculation Method    RB3LYP
Basis Set    LANL2DZ
Charge    0
Spin    Singlet
E(RB3LYP)    -91.21812851     a.u.
RMS Gradient Norm    0.00000088     a.u.
Imaginary Freq    0
Dipole Moment    0.0000     Debye
Point Group    D3H
Job cpu time:  0 days  0 hours  0 minutes 15.4 seconds.
The low frequencies from the “real” output are shown in Figure 20 below; this data provides further evidence that the frequency calculation was successful. The low frequencies correspond to the 3N-6 vibrational frequencies. These are the motions of the center of mass of a molecule [1]. These values are all much smaller than the frequency value of the first vibration (the lowest real mode) listed (46.43 cm-1), which is what is expected [1]. In addition, the largest "zero" frequency (3.94 cm-1) is approximately an order of magnitude smaller than the lowevst real mode (46.43 cm-1), which again is what is expected [1]. Therefore, analysis of the TlBr3 frequency calculation indicates that the calculation was successful and the results that will now be formed are reliable.
Low frequencies ---   -3.4213   -0.0026   -0.0004    0.0015    3.9367    3.9367
Low frequencies ---   46.4289   46.4292   52.1449
Graphical Representation of Output
Figure 21 tabulates each of the six vibrations and the corresponding intensities, frequencies and symmetry labels. The frequency calculation can also be illustrated graphically, Figure 22. Remember, the frequency analysis is essentially determining the second derivative of the PES. The frequencies are all positive indicating that a minimum has been established, which is what was requested by the program [1]. This shows that the frequency calculation was successful. Therefore, it can be inferred that a frequency analysis MUST be carried out in order to determine the energy minimum which corresponds to whether or not the calculation was successful.
| Results of Frequency Calculation | ||||||
| Number | Form of Vibration | Description of Vibrational Mode | Frequency/ cm-1 | Intensity | Symmetry D3h Point Group | |
| 1 | Vibration Image | In-plane bending (scissoring):Two of the bromine atoms (as shown) come together and move apart in a concerted manner. The final bromine and the thallium atom move together in and out to preserve the centre of mass during the vibration. | 46 | 3.69 | E' | |
| 2 | Vibration Image | In-plane bending (rocking):The thallium and two bromines "rock" in a concerted manner in the plane of the molecule. The top bromine "rocks" in the opposite direction. | 46 | 3.69 | E' | |
| 3 | Vibration Image | Out-of-plane bending (wagging):All the bromines move up and down, along the z axis in a concerted motion. The thallium atom moves in the opposite direction to the bromine atoms to preserve the centre of mass of the molecule [4] | 52 | 5.85 | A2" | |
| 4 | Vibration Image | Symmetric Stretch: All the bromine atoms move in and out in a concerted motion. The thallium atom is stationary. | 165 | 0.00 | A1' | |
| 5 | Vibration Image | Asymmetric Stretch:Two of the bromines move in and out in an asymmetrical motion. The top hydrogen in stationary. The thallium atom moves in an opposing manner to preserve the centre of mass. | 211 | 25.48 | E' | |
| 6 | Vibration Image | Asymmetric StretchTwo of the bromines move in and out in a concerted motion. The other hydrogen moves out and in (in the opposite direction). The boron atom is stationary. | 211 | 25.48 | E' | |
Please note frequencies in wavenumbers (cm-1) are tabulated with no decimal places by convention. There is a known systematic error of ca. 10% (10cm-1)which is more prominent for higher energy vibrations than lower energy vibrations [1].
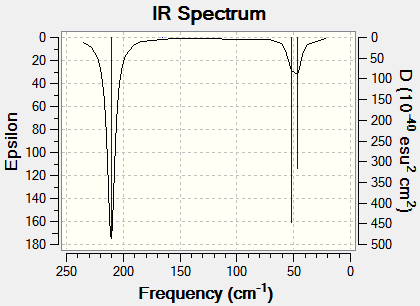
The 3N-6 rule, when N=4 results in six fundamental vibrational frequencies. This is consistent with the frequency calculation carried out on Guassview as shown in Figure 21. However, similar to BH3, Figure 22 shows only 3 distinct vibrational bands. The two in-plane bending vibrations are equivalent and the two asymmetrical stretches are also equivalent, all with symmetry of E’ , appearing at 46 cm-1 and 211 cm-1, respectively. The symmetrical stretch of TlBr3 is inactive in the infrared spectrum because this vibration produces no change in the dipole moment, resulting in an intensity of 0.00. Therefore, analysis of the frequency calculation shows that although there are six fundamental vibrational modes for TlBr3, only three distinct bands are observed.
Definition of a Bond
Similar to BH3,in many structures GuassView does not show all the expected bonds. A suitable definition for a bond, as stated above, is based on attraction between atoms dependent upon the electron density between them. However, in computational terms a bond is a parameter which has a set value. Therefore, a bond may not be seen in GaussView if the distance actually exceeds the specified value. This is not an accurate definition as a bond distance may vary as it depends on many factors such as attraction, electron density, nature of the atoms involved, follow on effects from other atoms (e.g. backbonding) and strength of the bond. Therefore, it must be noted that although GaussView may not show the bond, the interaction between the atoms is still present [1].
MO(CO)4(PCl3)2
Mo(CO)4(PPh3)2 can form two isomers: cis- and trans- isomer (wrt to the PPh3 ligands). These isomers have been extensively studied, especially the vibrational spectra retrieved from the compounds. This is because the number of carbonyl bands corresponds to the symmetry of the molecule. Four carbonyl bands are seen for the isomer with cis ligands and only one carbonyl band is seen for the trans isomer [1].
Disubstitued molybdenum carbonyl complexes have been modeled via computational methods. However, the PPh3 groups are large and require extensive computational resources. Therefore, PCl3 ligands, which are sterically and computationally less demanding have replaced these ligands. The electronic contribution from both groups is similar and therefore, it is possible to compare the geometric isomers of Mo(CO)4(PCl3)2 and rationalize this to the Mo(CO)4(PPh3)2. Computational methods have been used to determine the relative stability of the two isomers. Spectroscopic analysis has been used to characterize the isomers.
MO(CO)4(PCl3)2 Optimisation
An optimization calculation was carried out for both isomers of Mo(CO)4(PCl3)2. This involved altering the molecular geometry to an energy minimum. The following criterion was followed for the calculation for the optimized geometry:
- Type of Calculation: OPT (Optimisation)
- Additional Keywords: opt=loose
- Method: B3LYP
- Basic Set: LANLAMB
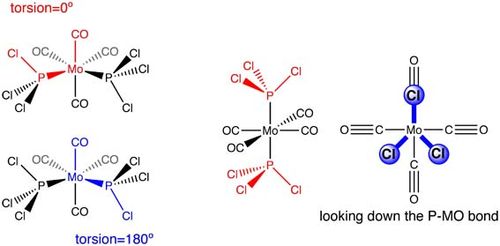
The basis set used is a low level basis set, using pseudo potentials to obtain roughly the correct geometry. The additional keywords inputted indicate a loose convergence. A loose convergence is necessary because the normal convergence level is too accurate and the accuracy of the method employed will not be able to match this [1]. GaussView showed the optimized isomer structures with “no PCl3 bonds”. As explained in previous sections, GaussView is limited in the sense that it codes a bond as a specific value. The optimized structure has a bond length, which exceeds this specified value, resulting in the Mo-P bonds to disappear on GaussView. However, from a chemical point of view, the attraction between the atoms is still there, hence the bond is still there! Using the above calculation method results in an optimized structure where the PCl3 ligands are not fully in the correct orientation to obtain an energy minimum. This implies that the dihedral angle is not well described [1].The PCl3 groups were directly rotated by setting the dihedral angle to a specified value as shown in Figure 23. For the cis isomer, the torsion angle was set to 180°, this lead to the isomer showing a staggered conformation. For the trans isomer, the angle was set to 0°, forming an eclipsed conformation.
Now that the dihedral angle has been well defined, a second optimization was carried out on the new geometries to obtain more accurate results. The following optimization criteria was inputted:
- Type of Calculation: OPT (Optimisation)
- Method: B3LYP
- Basic Set: LANLADZ
- Additional Keywords: int=ultrafine scf=conver=9
A high level basis set and pseudo potential has been used in order to obtain the correct geometries. The additional keywords indicate a tighter convergence is required than the normal level. A tight convergence is necessary in order to keep up with the better basis sets and pseudo potentials [1]. The structure of the two isomers is shown in Figure 24. The staggered (cis isomer) and eclipsed (trans isomer) orientation of the PCl3 ligands can be clearly seen, indicating that the optimization was accurate.
| MO(CO)4(PCl3)2 | |||
| Isomer | Cis-Isomer DOI:10042/to-10769 | Trans-IsomerDOI:10042/to-10770 | |
| Image | 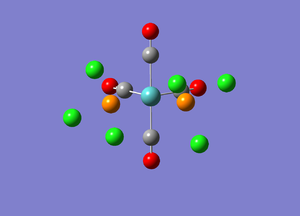 |
 | |
| 3D Image | |||
Analysis of Output
Figure 25 shows a summary of the important information related to the second optimizations for both isomers. The calculation type, calculation method, basis set, minimum energy and job computing time have been recorded. The gradient is close to zero; this can be used as supporting evidence that the calculation has been run successfully. As shown in Figure 25, the energies of the two isomers can be directly compared as the same calculation method has been employed. Therefore, it can be seen that the cis isomer is calculated to be more stable than the trans isomer by 2.73 kJ/mol-1 (0.00104a.u.).
File Name    secondoptcis(2)
File Type    .log
Calculation Type    FOPT
Calculation Method    RB3LYP
Basis Set    LANL2DZ
Charge    0
Spin    Singlet
E(RB3LYP)    -623.57707193     a.u.
RMS Gradient Norm    0.00000878     a.u.
Imaginary Freq
Dipole Moment    1.3096     Debye
Point Group    C1
Job cpu time:  0 days  1 hours 14 minutes 19.0 seconds.
File Name    secondopttrans
File Type    .log
Calculation Type    FOPT
Calculation Method    RB3LYP
Basis Set    LANL2DZ
Charge    0
Spin    Singlet
E(RB3LYP)    -623.57603097     a.u.
RMS Gradient Norm    0.00003621     a.u.
Imaginary Freq
Dipole Moment    0.3053     Debye
Point Group    C1
Job cpu time:  0 days  0 hours 44 minutes 41.2 seconds.
However, this computational calculation is based only on the data that was inputted. The basis set used only takes into consideration the valence s and p orbitals of the phosphorus atoms. In theory, phosphorus adopts a hypervalent structure and likes to use its low-lying d atomic orbitals [1]. Therefore, a more accurate account of the energies can be determined by considering the d orbitals. A manual edit of the Gaussian input file is required. Figure 26 shows a summary of the important information related to the fully optimized isomers from the adulterated file. Computational methods calculate the trans isomer to be more stable than the cis isomer by 3.27 kJ/mol-1 (0.00124 a.u.) when considering the d orbitals on a fully optimized structure. The literature states that the cis isomer is kinetically stable and isomerizes readily to the thermodynamically stable trans form at room temperature [7]. This supports the computational calculations and provides further evidence that the d orbitals need to be considered in order to obtain the correct results. Vibrational and geometric analysis will now be used to rationalise why the trans isomer is more stable than then cis isomer.
File Name    dorbitacisoptimisation
File Type    .log
Calculation Type    FOPT
Calculation Method    RB3LYP
Basis Set    Gen
Charge    0
Spin    Singlet
E(RB3LYP)    -623.69291205     a.u.
RMS Gradient Norm    0.00005416     a.u.
Imaginary Freq
Dipole Moment    0.0712     Debye
Point Group    C1
Job cpu time:  0 days  0 hours 32 minutes  8.5 seconds.
File Name    dorbitaltransoptimsation
File Type    .log
Calculation Type    FOPT
Calculation Method    RB3LYP
Basis Set    Gen
Charge    0
Spin    Singlet
E(RB3LYP)    -623.69415607     a.u.
RMS Gradient Norm    0.00000555     a.u.
Imaginary Freq
Dipole Moment    0.2294     Debye
Point Group    C1
Job cpu time:  0 days  0 hours 42 minutes 28.5 seconds.
Vibrational Analysis
A frequency calculation was carried out for the both isomers. This involved determining the second derivative of the potential energy surface and the IR and Raman modes to support the structure. The following criterion was followed for the calculation for the vibrational analysis:
- Type of Calculation: Frequency
- Method: B3LYP
- Basis Set: LANL2DZ
- Additional Keywords: int=ultrafine scf=conver=9
The same calculation method and basis set MUST be used for both calculations. This is because the same level of accuracy must be requested by the program for both calculations in order for correct results to be obtained. The vibrational calculation must be run on the optimsied structure of each isomer [1].
Analysis of Output
Figure 26 shows a summary of the important information related to the frequency calculation for each isomer, indicating whether or not the calculation has been run. The energy of the cis and trans isomer after the frequency calculation is the same as the energy of its optimised structure. This shows that the structures are the same and that the calculation was successful [1].
File Name    IRcis
File Type    .fch
Calculation Type    FREQ
Calculation Method    RB3LYP
Basis Set    LANL2DZ
Charge    0
Spin    Singlet
Total Energy    -623.57707193     a.u.
RMS Gradient Norm    0.00000881     a.u.
Imaginary Freq
Dipole Moment    1.3096     Debye
Point Group
File Name    IR_trans
File Type    .fch
Calculation Type    FREQ
Calculation Method    RB3LYP
Basis Set    LANL2DZ
Charge    0
Spin    Singlet
Total Energy    -623.57603097     a.u.
RMS Gradient Norm    0.00003622     a.u.
Imaginary Freq
Dipole Moment    0.3053     Debye
Point Group
Graphical representation of Output
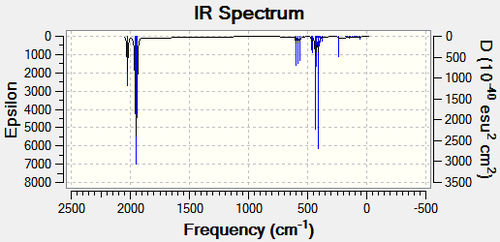
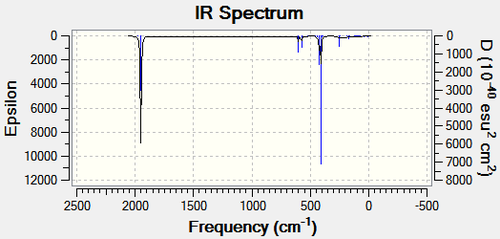
Figure 27 tabulates the relevant vibrations, the corresponding intensities and frequencies for each isomer. The frequency calculation can also be illustrated graphically, Figure 28. Remember, the frequency analysis is essentially determining the second derivative of the PES. The frequencies are all positive indicating that a minimum has been established, which is what was requested by the program. This shows that the frequency calculation was successful. Therefore, it can be inferred that a frequency analysis MUST be carried out in order to determine the energy minimum which corresponds to whether or not the calculation was successful.
| Infrared Stretching Frequencies | |||||
| Cis Isomer: Image of Vibration | Cis Isomer: Frequency/ cm-1 | Cis Isomer: Intensity | Trans Isomer: Image of Vibration | Trans Isomer: Frequency/ cm-1 | Trans Isomer: Intensity |
| C=O stretch (b2') | 1945 | 762.52 | C=O stretch (eu) | 1951 | 1475.41 |
| C=O stretch (b2") | 1948 | 1499 | C=O stretch (eu) | 1952 | 1466.76 |
| C=O stretch (a1') | 1958 | 633.08 | C=O stretch (b1) | 1977 | 0.64 |
| C=O stretch (a1') | 2023 | 597.54 | C=O stretch (a1) | 2031 | 3.77 |
The data shows that there are 4 distinct vibrational modes for the cis isomer do to the low symmetry of the isomer. The trans isomer also shows four vibrational modes, however, the vibrations with a1' symmetry have a very low intensity and are therefore, not seen, corresponding to the literature: two vibrational bands, this is in agreement with the high symmetry of the trans isomer.
| Cis Isomer DOI:10042/to-10771 | Trans isomer DOI:10042/to-10772 | |
|---|---|---|
 |
 |
Geometry Analysis
Comparison of the bond lengths between the two isomers provides a greater understanding for why the trans isomer is more stable. The calculated values correspond to the literature values well, indicating that the results from the computational method are reasonable. The Mo-P bond length is shorter for the trans isomer rather than the cis isomer. A shorter bond indicates a stronger bond, resulting in a more stable compound. A possible explanation for this observation is the PCl3 groups are relatively large. In the cis isomer, these groups would encounter steric effects and repulsions, as the lone pairs of the chlorines are too close together. Therefore, a longer bond length in the cis form would result in the atoms being as far apart as possible. This problem does not occur with the trans isomer, and therefore, rationalizes the stability of this form.
| Bond Lengths of Mo(CO)4(PCl3)2 | ||||
| Cis Isomer (concerning C=O ligand cis to PCl3 ligand) | Cis Isomer (concerning C=O ligand trans to PCl3 ligand) | Trans Isomer | ||
| Mo-P | 2.51 [2.58] | - | 2.44[2.50] | |
| Mo-C | 2.06 [1.97] | 2.01 [2.06] | 2.06[2.01] | |
| P-Cl | 2.24 [-] | - | 2.24[-] | |
| C=O | 1.17 [1.16] | 1.18 [1.13] | 1.17[1.17] | |
It must be note that the Mo-C bond length is shorter for the cis isomer, (when the PCl3 ligand is trans) than for the trans isomer. This can be explained by metal – ligand bonding. Initially, the carbon coordinates to the molybdenum via sigma (σ) donation. Consequently, the filled metal d orbitals donate electron density back to the empty π* orbitals on the carbon, known as π back donation [4]. This “extra” bonding between the M-C increases the strength of this bond, as is the case for the trans isomer. However, for the cis isomer, which has a PCl3 ligand opposite, the trans effect becomes more prominent. The chlorine atoms withdraw the electron density away from the phosphorus atom. In turn this inductive effect results in the metal centre holding less electron density. As there is less electron density available at the metal centre, this will result in less back donation. However, this factor is not the dominant factor as the bond length for Mo-C is not as varied as for Mo-P between the isomers.
Further Experiments
A computational chemist can “fine-tune” the behavior of a specific catalyst. For example, in the above molybdenum example if the cis isomer is the more desired, efficient isomer to be used as a catalyst: using computational methods, the catalyst can be altered to make it the more stable form. For example, the ligand -PR3, for which the trans form is more stable when R=Cl, Ph, can be altered. The trans-effect described above can be used in our favour. If R equals a strong electron-donating group then the electron density around the metal centre will increase due to the inductive effect. This will result in a greater degree of backbonding and a stronger and more stable Mo-C bond. Examples of electron donating R groups are –OH and –NH2. In addition, a small group should also be chosen to avoid the repulsive interactions between the ligands. If time permitted, these examples would have been modelled computationally and the results would have been evaluated.
Mini Project
Quantum chemistry will now be used to investigate the energetic outcome of the reaction scheme shown in Figure 30. This involves comparing and contrasting the two tin organometallic compounds, leading to a conclusion for which compound is more stable.
PREDICTION: On first thought, one would expect the dihalogen substituted compound to be LESS stable. The electron withdrawing nature of the chlorine substituents would produce a highly reactive, positively charge metal centre. The effect of two chlorines is greater than the effect of one.
Investigating this prediction is the basis of this mini project. Optimisation, vibrational and MO calculations have been used which will provide a thorough account of the electronic and energetic factors that contribute to the energetic outcome of the reaction.

Optimsations
Each of the structures was created on GaussView 5.0.9. An optimisation calculation was carried out for each of the four molecules. This involved altering the molecular geometry to an energy minimum. The following criterion was followed for the calculation for the optimised geometry for Me3SnCl and Me2SnCl2:
- Method: B3LYP
- Basic Set: GEN
- Type of Calculation: OPT (Optimisation)
- Additional Keywords: pseudo=cards gfinput
As explained in previous sections, different basis sets need to be used for heavier atoms, such as tin, therefore, in this case GEN is used. However, pseudo potentials can ONLY be used for heavier atoms; carbon, hydrogen and chlorine do not fit into this category. Therefore, the input file (.gif) was edited as shown in Figure 31. This edited version now specifies the basis sets for all atoms and the pseudo-potential for the Sn atom. This is done after the coordinates and connectivity information on the input file [1].
Sn 0
LanL2DZ
****
C H Cl 0
6-311G(d,p)
****

Sn 0
LanL2DZ
The following criterion was followed for the calculation for the optimised geometry for HCl and CH4:
- Method: B3LYP
- Basic Set: 6-311G (d, p)
- Type of Calculation: OPT (Optimisation)
It is not necessary to use the same code as used for tin compounds, as pseudo potentials will not be needed. Figure 31 codes the basis set for C, H and Cl atoms as 6-311G (d, p). This basis set is used for small molecules for an accurate calculation. Therefore, in order to keep the optimisation calculations consistent so that comparisons can be made and accurate results can be obtained, the same basis set has been used.
Please note, initially, all the optimisation calculations were carried out using the following criteria:
- Method: B3LYP
- Basic Set: LANL2DZ
- Type of Calculation: OPT (Optimisation)
It was then realised that this would not form accurate results as explained above, tin is a heavier atom and would need to be considered specifically. This resulted in all the calculations having to be run again in order to obtain accurate results, leading to time constraints. As advised by Dr. Hunt, the vibrational, MO and NBO analysis would not have to be redone and the LANL2DZ basis set would be sufficient to carry out these calculations.
Analysis of Output
The structure of each of the molecules is shown below (Figure 32), highlighting the corresponding optimised bond length. These values calculated computationally reflect the literature values, indicating that the results are not unreasonable. Please note that the calculated bond distances are accurate to 0.01Å.
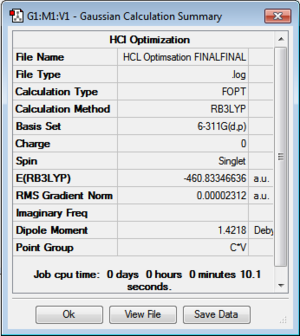
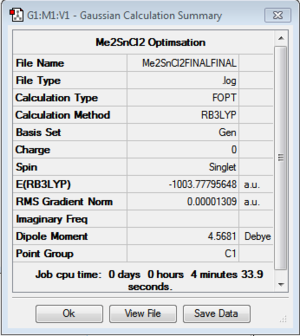
Figure 31 also shows a summary of the important information related to the optimisation, indicating whether or not the calculation has been run. The file type: FOPT indicates that a full optimisation has been requested by the program [3]. The calculation type, calculation method, basis set and job computing time have been reported. The minimum energy is shown in atomic units. The gradient is close to zero (less than 0.001 a.u.). This can be used as supporting evidence that the calculation was run successfully [1]. A gradient on the potential energy curve less than 0.001 a.u. is considered to be the minimum. It can be assumed that as an energy minimum has been established, the optimisation has in fact been carried out.
In addition, the “real” output, which was obtained from the .log file of each optimised structure, provides further evidence that the optimization calculation was successful. The output file showed that the forces and displacements have converged; indicating that the optimisation had proceeded, the calculation was successful and the results that will now be formed are reliable.
| Optimised Structures from Reaction Scheme | |||||
| Reactant: Me3SnClDOI:10042/to-10977 | Reactant: HClDOI:10042/to-10980 | Product: Me2SnCl2DOI:10042/to-10978 | Product: CH4DOI:10979/to-10971 | ||
| 3D Image | |||||
| Summary File | 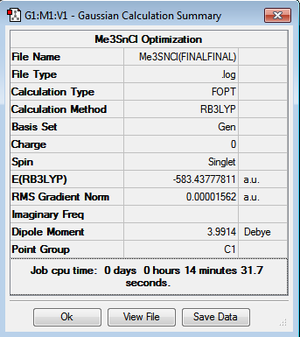 |
 |
 |
 | |
| Bond Distance [literature]/ Å | Sn-C: 2.12 [2.14][8] | H-Cl: 1.29 [1.27][9] | Sn-C: 2.14 [2.14][8] | C-H 1.09 [1.09][9] | |
Determination of equilibirum position
As the electron count of Me3SnCl and Me2SnCl2 is different, the energy values cannot be directly compared. Figure 33 shows the equation that was used to determine which side the equilibrium lies on, products or reactants.

There are no literature results to compare this energy value to. Figure 33 shows a positive value was obtained, which means that the reactants have a higher energy than the products. Therefore, the forward reaction is thermodynamically favourable. The dominating factor determining the equilibrium position is obviously the stability of the tin compounds. Hence, it can be concluded that the Me2SnCl2 compound is MORE stable. This does not agree with the prediction, spectroscopic analysis will now be used to explain this observation.
In addition, the energy values of HCl and CH4 must also be considered. Dissociating the H-Cl ionic bond to form a covalent C-H bond is thermodynamically favoured, therefore, this bonding preference will also contribute a significant amount to the high energy value, 160 kJ mol-1.
Vibrational Analysis
A frequency calculation was carried out for the tin compounds. This involved determining the second derivative of the potential energy surface and the IR and Raman modes to support the structures. The following criterion was followed for the calculation for the vibrational analysis:
- Type of Calculation: Frequency
- Method: B3LYP
- Basis Set: LANL2DZ
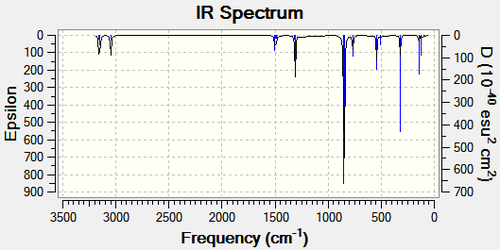
Figure 34 tabulates the relevant vibrations, the corresponding intensities and frequencies for each compound. The frequency calculation can also be illustrated graphically, Figure 35. The frequency analysis is essentially determining the second derivative of the PES. The frequencies are all positive indicating that a minimum has been established, which is what was requested by the program. This shows that the frequency calculation was successful. Therefore, it can be inferred that a frequency analysis MUST be carried out in order to determine the energy minimum which corresponds to whether or not the calculation was successful.
| Infrared Stretching Frequencies | |||||
| Me3SnCl: Image of Vibration | Me3SnCl: Frequency/ cm-1 | Me3SnCl: Intensity | Me2SnCl2: Image of Vibration | Me2SnCl2: Frequency/ cm-1 | Me2SnCl2: Intensity |
| Sn-Cl stretch (symmetric) | 321 | 34.76 | Sn-Cl stretch (symmetric) | 328 | 25.63 |
| - | - | - | Sn-Cl stretch(asymmetric) | 324 | 48.37 |
| Sn-C stretch | 543 | 20.48 | Sn-C stretch | 557 | 15.06 |
| C-H stretch | 851 | 141.54 | C-H stretch | 852 | 110.95 |
| Me3SnCl DOI:10042/to-10987 | Me2SnCl2 DOI:10042/to-10985 | |
|---|---|---|
 |
 |
Only the most relevant vibrational modes have been tabulated. The most important is the Sn-Cl symmetric stretch. The Me2SnCl 2has a higher stretching frequency by (7Å) indicating that it is a stronger bond. This can be rationalized by the fact that the two chlorine substituents increase the positive charge on the metal centre. This increased positive charge results in a greater degree of back bonding and hence a stronger bond. This could be a possible explanation as to why the Me2SnCl2 is more stable. The Sn-C bond also has a significantly stronger vibrational frequency by (14 Å), which corresponds to the more stable dihalogen tin compound. NBO analysis will now be used to explain this observation.
NBO Analysis
Charge Distribution
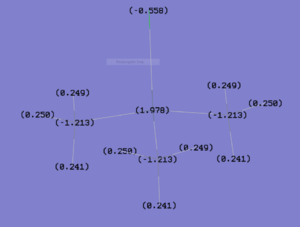
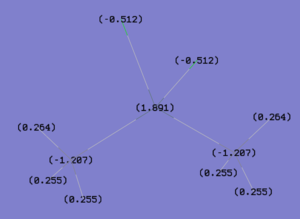
NBO analysis is usual as it provides a greater understanding of each of the orbitals involved. Figure 36 depicts the charge distribution in Me3SnCl and Me2SnCl2 presented by GuassView. As expected, for both compounds, the tin metal centre has a high positive charge compared to its substituents. This supports the analysis of back bonding which renders the bonding in Me2SnCl2 more stable. The calculated value for each carbon in both compounds indicates that the negative charge is distributed evenly amongst the methyl substituents. In addition, for Me2SnCl2, the negative charge is also distributed evenly between the chlorines. On the contrary, the tin metal centre in Me2SnCl2 is actually less positively charged than the metal centre on Me3SnCl. This does not correlate with the above analysis and it is unknown why this could be.
| Me3SnCl DOI:10042/to-10984 | Me2SnCl2 DOI:10042/to-10978 | |
|---|---|---|
 |
 |
Covalency
Figure 37(below) details the individual contributions to the bonding in Me3SnCl. This is important as it helps describe the nature of each type of bond. All three Sn-C bonds are equivalent. Tin contributes 25.35% to this bond and carbon contributes 74.65%. The tin orbital in this bond consists of 28.21% s character and 71.79% p character. The carbon orbital consists of 22.81% s character and 77.19% p character.
 (Occupancy)   Bond orbital/ Coefficients/ Hybrids
 ---------------------------------------------------------------------------------
     1. (1.96109) BD ( 1)Sn   1 - C   2
                ( 25.35%)   0.5035*Sn   1 s( 28.21%)p 2.54( 71.79%)
                                            0.5311  0.0042  0.2255 -0.0041 -0.6247
                                           -0.0065 -0.5260 -0.0055
                ( 74.65%)   0.8640* C   2 s( 22.81%)p 3.38( 77.19%)
                                            0.0002  0.4768 -0.0276 -0.2188 -0.0067
                                            0.6504  0.0313  0.5470  0.0263
     2. (1.96111) BD ( 1)Sn   1 - C   6
                ( 25.35%)   0.5034*Sn   1 s( 28.21%)p 2.55( 71.79%)
                                           -0.5311 -0.0042 -0.2267  0.0041  0.1434
                                            0.0015 -0.8037 -0.0084
                ( 74.65%)   0.8640* C   6 s( 22.82%)p 3.38( 77.18%)
                                           -0.0002 -0.4769  0.0275  0.2205  0.0067
                                           -0.1499 -0.0072  0.8361  0.0403
     3. (1.96107) BD ( 1)Sn   1 - C  10
                ( 25.35%)   0.5035*Sn   1 s( 28.22%)p 2.54( 71.78%)
                                           -0.5312 -0.0042 -0.2266  0.0041 -0.7675
                                           -0.0081  0.2780  0.0029
                ( 74.65%)   0.8640* C  10 s( 22.81%)p 3.38( 77.19%)
                                           -0.0002 -0.4768  0.0276  0.2205  0.0067
                                            0.7989  0.0385 -0.2887 -0.0139
     4. (1.97311) BD ( 1)Sn   1 -Cl  14
                ( 17.77%)   0.4215*Sn   1 s( 15.38%)p 5.50( 84.62%)
                                            0.3918 -0.0167 -0.9198 -0.0151  0.0006
                                            0.0000  0.0006  0.0000
                ( 82.23%)   0.9068*Cl  14 s( 16.26%)p 5.15( 83.74%)
                                            0.4032 -0.0002  0.9151  0.0050 -0.0001
                                            0.0000 -0.0005  0.0000
Figure 38(below) details the individual contributions to the bonding in Me2SnCl2. All three Sn-C bonds are equivalent just as for Me3SnCl. However, the individual contributions are slightly different. Tin contributes 27.04% to this bond and carbon contributes 72.96%. The tin orbital in this bond consists of slightly more s character (%32.11) and slightly less p character (67.89%). The carbon orbital consists of 21.14% s character and 78.86% p character.
      (Occupancy)   Bond orbital/ Coefficients/ Hybrids
 ---------------------------------------------------------------------------------
     1. (1.94617) BD ( 1)Sn   1 - C   2
                ( 27.04%)   0.5200*Sn   1 s( 32.11%)p 2.11( 67.89%)
                                            0.5666  0.0084  0.0000  0.0000  0.4230
                                            0.0052  0.7067  0.0233
                ( 72.96%)   0.8542* C   2 s( 21.14%)p 3.73( 78.86%)
                                            0.0002  0.4588 -0.0299  0.0000  0.0000
                                           -0.4288 -0.0157 -0.7767 -0.0340
     2. (1.94617) BD ( 1)Sn   1 - C   6
                ( 27.04%)   0.5200*Sn   1 s( 32.11%)p 2.11( 67.89%)
                                            0.5666  0.0084  0.0000  0.0000  0.4230
                                            0.0052 -0.7067 -0.0233
                ( 72.96%)   0.8542* C   6 s( 21.14%)p 3.73( 78.86%)
                                            0.0002  0.4588 -0.0299  0.0000  0.0000
                                           -0.4288 -0.0157  0.7767  0.0340
     3. (1.96543) BD ( 1)Sn   1 -Cl  10
                ( 19.31%)   0.4394*Sn   1 s( 17.91%)p 4.58( 82.09%)
                                            0.4230 -0.0112  0.7066  0.0256 -0.5661
                                           -0.0213  0.0000  0.0000
                ( 80.69%)   0.8983*Cl  10 s( 14.74%)p 5.79( 85.26%)
                                            0.3839 -0.0014 -0.7627 -0.0050  0.5204
                                            0.0048  0.0000  0.0000
     4. (1.96543) BD ( 1)Sn   1 -Cl  11
                ( 19.31%)   0.4394*Sn   1 s( 17.91%)p 4.58( 82.09%)
                                            0.4230 -0.0112 -0.7066 -0.0256 -0.5661
                                           -0.0213  0.0000  0.0000
                ( 80.69%)   0.8983*Cl  11 s( 14.74%)p 5.79( 85.26%)
                                            0.3839 -0.0014  0.7627  0.0050  0.5204
                                            0.0048  0.0000  0.0000
The increased s character would result in greater overlap and therefore, a stronger bond. This could potentially explain the higher bond strength of the Sn-C shown in the vibrational analysis. However, the values are not significant enough and the reason for this change is still unknown. MO analySis will now be considered.
MO Analysis
An energy calculation was carried out for Me3SnCl. This involved solving the electronic structure which would further allow computed MOs to be visualized. The following criterion was followed for the calculation:
- Type of Calculation: Energy
- Method: B3LYP
- Basic Set: LANL2DZ
- NBO: Full NBO
- Additional Keywords: pop= (full)
The additional keywords inputted indicate that an MO analysis has been requested by the program. Figure 36 tabulates the relevant molecular orbitals and their corresponding energy levels. These are the quantitative or computed MOs.
Figure 39 shows few of the interesting molecular orbitals. These orbitals will help to rationalise the stability of Me2SnCl2. The lowest energy bonding orbital shown at -0.80283 highlights a strong bonding contribution from the chlorine substituents. The orbital shown at -0.35646 again, shows a strong bonding interaction, in particular a strong ligand interaction. It seems that this is a p orbital overlap. However, this ligand interaction can form in phase interactions and out of phase interactions as shown by the orbital at -0.5574.
The HUMO of Me2SnCl2 again shows inter-ligand bonding interactions, which is considerably favoured. The LUMO shows strong antibonding interactions between all the substituents and the metal centre, which are not favoured. This results in there being a large energy gap between the HUMO and LUMO for Me2SnCl2 (0.24527). For Me3SnCl, the HUMO is -0.28039 and the LUMO is -0.028037, resulting in a very small energy gap of 0.00002. A possible reason for the small energy gap could be because the methyl substituents do not for a nodal plane between them, therefore, less antibonding character. Whereas, for Me2SnCl2, there is a nodal plane between each substituent resulting in a high level of antibonding character. A small HOMO-LUMO gap indicates that it is easier to excite an electron into the LUMO, rendering the molecule more reactive. Therefore, the stability of Me2SnCl2 can be rationalised, as the large energy gap results in less reactivity and hence increase in stability.
Conclusion
Comparisons of the substituted tin compounds resulted in many interesting results. Overall, the Me2SnCl2 was rendered the more stable compound. This was supported by vibrational analysis and molecular orbitals analysis. The main distinguishing feature being the HOMO - LUMO gap. NBO analysis, did not analyse the compounds in the way that was expected and an explanation for this is unknown. There are no literature values to compare the calculated results from. If more time permitted, the calculations would have been more extensively investigated.
<references>
- ↑ 1.00 1.01 1.02 1.03 1.04 1.05 1.06 1.07 1.08 1.09 1.10 1.11 1.12 1.13 1.14 1.15 1.16 1.17 1.18 1.19 1.20 1.21 1.22 1.23 1.24 1.25 1.26 1.27 1.28 1.29 1.30 1.31 1.32 1.33 1.34 1.35 1.36 1.37 1.38 1.39 1.40 1.41 1.42 Third year Chemistry Computation Lab Module 1:Inorganic
- ↑ 2.0 2.1 http://onlinelibrary.wiley.com/doi/10.1002/jcc.20238/pdf
- ↑ 3.0 3.1 3.2 http://www.gaussian.com/g_tech/g_ur/k_opt.htm
- ↑ 4.0 4.1 4.2 4.3 http://orgchem.colorado.edu/hndbksupport/irtutor/IRtheory.pdf
- ↑ 5.0 5.1 5.2 5.3 5.4 5.5 P. Hunt, Molecular Orbitals in Inorganic Chemistry: Constructing MO Diagrams (Lecture 4), 2010, 1-7
- ↑ 6.0 6.1 http://pubs.acs.org/doi/pdf/10.1021/jp004511j
- ↑ http://www.sciencedirect.com/science?_ob=MiamiImageURL&_cid=271401&_user=217827&_pii=S002016939605133X&_check=y&_origin=&_coverDate=01-Jan-1997&view=c&wchp=dGLbVBA-zSkzV&md5=c7f37fd48e2874f587b6b5adb8b9070b/1-s2.0-S002016939605133X-main.pdf
- ↑ 8.0 8.1 Handbook of Chemistry & Physics (65th ed.). CRC Press. ISBN 0-8493-0465-2.
- ↑ 9.0 9.1 http://www.science.uwaterloo.ca/~cchieh/cact/c120/bondel.html


