Rep:Mod:smistry77
Conformational Analysis Using Molecular Mechanics
Hydrogenation of Cyclopentadiene Dimer
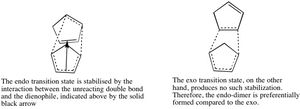
Dimerisation of cyclopentadiene produces the endo-dimer in preference to the exo-dimer, despite the lower energy of the exo-dimer in comparison to the endo-dimer (as can be seen from the table above). Therefore, whilst the exo-dimer is the thermodynamic product, the endo-dimer (kinetic product) is preferentially formed due to the formation of a more stable transition state, and hence a lower activation energy barrier. However, the product of the dimerisation is dependent on solvent and reaction conditions (such as temperature).
Cyclopentadiene dimerisation is a [4+2]-cycloaddition, involving one cyclopentadiene as the diene (incorporating both double bonds within the cycloaddition mechanism), and the other as a dienophile (only one double bond is involved within the mechanism). The transition state forming the endo-dimer is stabilized by an attractive interaction between the HOMO of the diene and the LUMO of the dienophile,[1] incorporating the double bond of the dienophile not explicitly involved in the cycloaddition reaction. This is exemplified by Fig. 1 to the right.
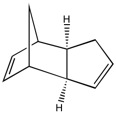
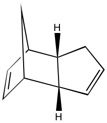
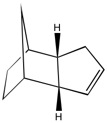
The table below shows the relative energies calculated for the two possible hydrogenated products of the endo-cyclopentadiene dimer.
| Hydrogenated Product 1 | Hydrogenated Product 2 | |||||||
|---|---|---|---|---|---|---|---|---|
| 3D Structure |
|
| ||||||
| 2D Structure |  |
 | ||||||
| Total Energy/kcal mol-1 | 50.4 | 41.3 | ||||||
| Total Bond Stretching Energy/kcal mol-1 | 3.31 | 2.82 | ||||||
| Total Angle Bending Energy/kcal mol-1 | 31.9 | 24.7 | ||||||
| Total Torsional Energy/kcal mol-1 | -1.47 | -0.378 | ||||||
| Total van der Waals Energy/kcal mol-1 | 13.6 | 10.6 | ||||||
| Total Electrostatic Energy/kcal mol-1 | 5.12 | 5.15 |
As indicated from the table above, hydrogenation of the endo-cyclopentadiene dimer is expected to produce isomer 2 compared to isomer 1 initially (before complete reduction occurs). This is because, overall, isomer 2 is lower in energy than isomer 1 (i.e. isomer 2 is the thermodynamically stable product). This is confirmed by literature,[2] which states that the double bond in the bicycloheptene cycle is more reactive than the double bond in the adjacent cyclopentene ring. This is due to the increased bond angle strain adopted by the double bond in the bicycloheptene ring compared to the cyclopentene ring, indicated by the higher angle bending strain of the hydrogenated isomer 1 compared to isomer 2, as it retains the double bond in the bicycloheptene ring and is subsequently bent away from the normal bond angle around sp2 hybridised centres (1200). Indeed, the thermodynamic stability of isomer 2 compared to isomer 1 is a result of the lower energy of the isomer in nearly all departments, and therefore the hydrogenation of the endo-cyclopentadiene dimer initially forms isomer 2. However, as above, the kinetic hydrogenated isomer 1 can be produced by alteration of the reaction conditions.
Atropisomerism in an Intermediate Related to the Synthesis of Taxol
| Intermediate 1 | Intermediate 2 | |||||||
|---|---|---|---|---|---|---|---|---|
| 3D Structure |
|
| ||||||
| 2D Structure | 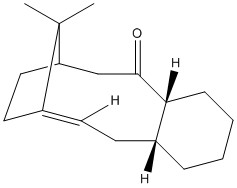 |
 | ||||||
| Total Energy/kcal mol-1 | 70.6 | 60.6 | ||||||
| Total Bond Stretching Energy/kcal mol-1 | 7.73 | 7.59 | ||||||
| Total Angle Bending Energy/kcal mol-1 | 28.5 | 18.8 | ||||||
| Total Torsional Energy/kcal mol-1 | 0.157 | 0.261 | ||||||
| Total van der Waals Energy/kcal mol-1 | 33.0 | 33.2 | ||||||
| Total Electrostatic Energy/kcal mol-1 | 0.300 | -0.0516 |
As indicated by the table above, intermediate 2 is the most stable isomer in the synthesis of taxol. This is confirmed by literature,[3] which displays an isomerisation at room temperature to produce the intermediate 2 only. It should be noted that, as expected, the chair conformers of the two intermediates above are more stable than their twist-boat counterparts, displayed in the table below:
| Intermediate 1 | Intermediate 2 | |||||||
|---|---|---|---|---|---|---|---|---|
| 3D Structure |
|
| ||||||
| Total Energy/kcal mol-1 | 77.9 | 66.3 | ||||||
| Total Bond Stretching Energy/kcal mol-1 | 8.00 | 7.76 | ||||||
| Total Angle Bending Energy/kcal mol-1 | 30.2 | 19.0 | ||||||
| Total Torsional Energy/kcal mol-1 | 2.72 | 3.77 | ||||||
| Total van der Waals Energy/kcal mol-1 | 35.8 | 35.0 | ||||||
| Total Electrostatic Energy/kcal mol-1 | 0.294 | -0.0614 |
The main contributions to the raise in energy of the twist-boat conformation relative to the chair is the higher angle bending and torsional energy, suggesting the twist-boat structure is conformationally locked and the free rotation of the bonds in the twist-boat structure is more restricted than in the chair. This is a result of greater stearic interactions in the twist-boat structure relative to the chair. However, intermediate 2 retains a lower energy than intermediate 1 even in the twist-boat conformation, confirming its overall stability as an isomer in comparison to the chair conformers.
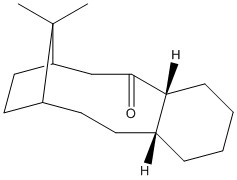
Both intermediates also belong to a class of compounds known as hyperstable alkenes. Hyperstable alkenes are alkenes which are less strained than the alkane,[4] predominantly due to the bridging isopropyl group present nearby to the double bond. Hyperstability of alkenes can be measured using the olefinic strain (OS), which is the difference between the overall strain energy of the alkene in its most stable state, and the total strain energy of the corresponding alkane, also in its most stable conformer. The total strain energy is the sum of the total angle bending energy and the total torsional energy.
| Hydrogenated Intermediate 1 | Hydrogenated Intermediate 2 | |||||||
|---|---|---|---|---|---|---|---|---|
| 3D Structure |
|
| ||||||
| 2D Structure |  |
 | ||||||
| Total Energy/kcal mol-1 | 79.9 | 69.6 | ||||||
| Total Bond Stretching Energy/kcal mol-1 | 6.40 | 6.39 | ||||||
| Total Angle Bending Energy/kcal mol-1 | 29.5 | 22.3 | ||||||
| Total Torsional Energy/kcal mol-1 | 11.5 | 9.31 | ||||||
| Total van der Waals Energy/kcal mol-1 | 32.2 | 31.2 | ||||||
| Total Electrostatic Energy/kcal mol-1 | 0.00 | 0.00 |
The OS calculated for intermediate 1 is -12.3 kcal mol-1, and for intermediate 2 is -12.5 kcal mol-1. A negative OS is indicative of hyperstability, as it suggests the alkane possesses greater total angle bending and torsional energy than the alkene, and is therefore unstable in comparison. Therefore, both intermediates are hyperstable alkenes.
Spectroscopic Simulation Using Quantum Mechanics
A Practice Molecule:Spectroscopy of an Intermediate Related to the Synthesis of Taxol

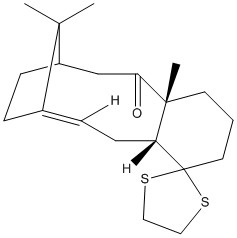
The 1H NMR of another intermediate in the synthesis of Taxol (intermediate 3, shown above) is shown below (DOI:10042/28223 ):
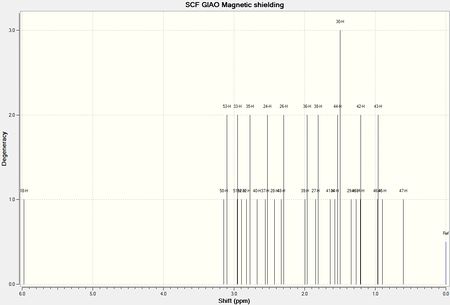
The spectrum was compared with the chemical shifts experimentally obtained,[3] as summarized in the table below:
| The numbering of the carbon atoms | ||

| ||
| Proton Number | Calculated Chemical Shift/δ ppm | Experimental Chemical Shift/δ ppm |
| 18 | 5.97 | 5.21 |
| 24 | 2.53 | 1.58 |
| 26 | 2.30 | 1.70-2.20 |
| 27 | 1.85 | |
| 28 | 2.43 | |
| 29 | 1.34 | |
| 30 | 1.50 | 1.20-1.50 |
| 31 | 1.21 | |
| 32 | 2.82 | 2.35-2.70 |
| 33 | 2.95 | |
| 34 | 1.57 | 2.70-3.00 |
| 35 | 2.77 | |
| 36 | 1.96 | 1.20-1.50 |
| 37 | 2.56 | 1.70-2.20 |
| 38 | 1.81 | |
| 39 | 2.00 | 2.35-2.70 |
| 40 | 2.67 | |
| 41 | 1.64 | 1.07 |
| 42 | 1.20 | |
| 43 | 0.96 | |
| 44 | 1.53 | 1.03 |
| 45 | 0.90 | |
| 46 | 0.97 | |
| 47 | 0.60 | 1.10 |
| 48 | 2.33 | |
| 49 | 1.27 | |
| 50 | 3.15 | 2.70-3.00 |
| 51 | 2.96 | |
| 52 | 2.89 | |
| 53 | 3.10 | |
As indicated from the table above, the calculated chemical shifts are in good agreement with literature. There are, however, some deviations from literature, in particular, protons 18, 24, 29, 34, 36, 41, 44, 47 and 48. These deviations can be explained by the lack of motion of the molecule during calculation of the predicted NMR, whereas, in reality, the protons are under continuous motion via ring-flipping and C-C bond rotation. Therefore, in reality, the NMR shows the average environment adopted by a dynamic proton, rather than the static, lowest-energy conformation adopted to calculate the predicted NMR. The alkenyl proton 18 has a higher predicted chemical shift compared to the literature assignment, suggesting its shielding is higher in reality than the calculated one. An explanation for this is the position of the proton inside the ring rather than statically outside the ring.
On the other hand, proton number 47 displays a higher chemical shift in reality than calculated, suggesting the proton is less shielded than predicted, possibly as a result of the free rotation of the methyl group. Hence, the proton would not be statically shielded by the cyclohexane ring, but more open and deshielded as it rotates between the bicyclic structures.
The 13C NMR of the Taxol intermediate 3 is diagrammed below:

The calculated and experimental 13C chemical shifts are reported below:[3]
| Diagram of Taxol Intermediate 3 With Numbered Atoms | ||
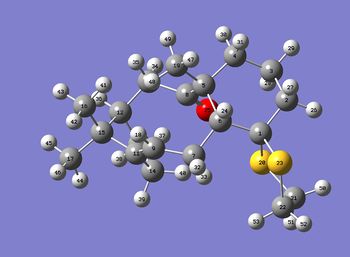
| ||
| Carbon Number | Calculated Chemical Shift/δ ppm | Experimental Chemical Shift/δ ppm |
| 1 | 92.85 | 74.61 |
| 2 | 48.04 | 43.28 |
| 3 | 24.01 | 21.39 |
| 4 | 41.47 | 36.78 |
| 5 | 54.76 | 50.94 |
| 6 | 65.94 | 60.53 |
| 7 | 32.47 | 30.00 |
| 8 | 211.92 | 211.49 |
| 9 | 120.12 | 120.90 |
| 10 | 38.51 | 35.47 |
| 11 | 147.86 | 148.72 |
| 12 | 54.94 | 51.30 |
| 13 | 24.44 | 22.21 |
| 14 | 28.36 | 25.56 |
| 15 | 49.53 | 45.53 |
| 16 | 22.58 | 19.83 |
| 17 | 26.50 | 25.35 |
| 19 | 33.69 | 30.84 |
| 21 | 45.65 | 40.82 |
| 22 | 44.01 | 38.73 |
As can be seen from the table above, the calculated 13C chemical shifts are in good agreement with those obtained experimentally. The only significant deviation is for carbon 1, containing a dithioethane substituent, and is therefore considered to be a anomeric centre, whereby the C-S bonds are shorter than normal due to an anomeric effect and so the central carbon atom is more shielded than is expected adjacent to an electronegative, deshielding sulfur atom.
Analysis of the Properties of the Synthesized Alkene Epoxides
The Crystal Structures of the Two Catalysts
Jacobsen Catalyst
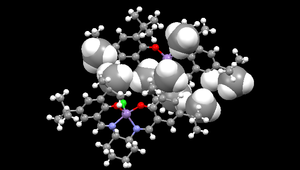
A crystal structure for Jacobsen catalyst is shown in the diagram to the right.[5] The space-filling regions in the structure indicate where the tBu groups between the two molecules are significantly close to one another for an interaction to be present. However, upon closer inspection, it was found no attractive interaction is present, yielding the question of how the two molecules are held together within the crystal structure.
There are, however, the presence of attractive interactions between tBu groups of molecules in adjacent unit cells. An attractive van der Waals interaction is the result of contact between the van der Waals radius of a hydrogen atom (i.e. 1.2 Å), and either the van der Waals radius of a hydrogen atom or a carbon atom (i.e. 1.7 Å) within the adjacent molecule. Therefore, the attractive distance between two hydrogen atoms is defined to be approximately 2.4 Å, or approximately 2.9 Å between a carbon atom and a hydrogen atom. These attractive van der Waals distances between tBu groups of molecules in adjacent unit cells is exemplified by the diagram below, which depicts only the interacting atoms of the adjacent unit cell with the crystal structure of the Jacobsen catalyst.

The C=N bond length in the Jacobsen catalyst is marginally longer (i.e. 1.30 Å) in comparison to the Salen ligand, which contains a C=N bond length of 1.27 Å.[6] This suggests that there is back-donation from the central Mn3+ ion, into the π* orbital of C=N.
The interaction between Jacobsen catalyst molecules in the crystal structure are not superimposed upon one another, which would allow a favourable van der Waals interaction between
Shi Catalyst
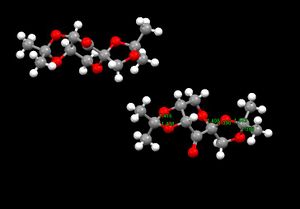
The crystal structure of the Shi catalyst, with the bond lengths for the anomeric centres in Å shown, is displayed on the right. In addition is the JMOL of the Shi catalyst crystal structure.
An interesting feature to note is the C-O bond lengths surrounding the anomeric centre involved in the fused cyclohexane and cyclopentane rings. The C-O bond length around this centre in the cyclohexane ring is 1.41 Å, and 0.2 Å longer than the C-O bond length in the cyclopentane system. This indicates that the cyclopentane oxygen donates a lone pair of electrons into the C-O σ* bond involved in the cyclohexane system, therefore elongating the C-O bond in the cyclohexane system, and decreasing the bond involved in the cyclopentane system. A possible reason for the donation of the oxygen lone pair from the cyclopentane ring rather than the cyclohexane system is the planar structure of the cyclopentane ring in comparison to the cyclohexane, so the overlap between the oxygen sp3 hybridised orbital containing the lone pair and the C-O σ* orbital is greater in the cyclopentane ring rather than in the cyclohexane ring.
Another interesting feature to note is the C-O bond lengths around the anomeric centre contained within the cyclopentane ring. The methylene C-O bond length is 1.38 Å, 0.6 Å shorter than the accompanying C-O bond (1.44 Å). This can be explained by the oxygen atom donating into the C-O σ* of the cyclohexane ring is less electron rich, and therefore cannot donate into the other C-O σ*. As a result, the methylene oxygen does so, shortening its bond length and increasing the accompanying one significantly.
The Calculated NMR Properties of the Epoxides
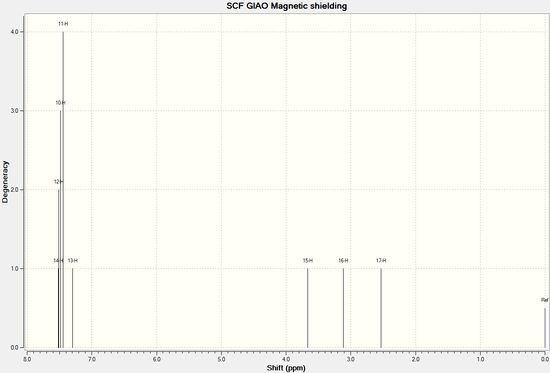
The calculated 1H NMR of (R)-styrene oxide is described below (DOI:10042/28222 ):
| Results | ||||
|---|---|---|---|---|
| 3D Structure |
| |||
| 2D Structure | 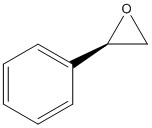 | |||
| Total Energy/kcal mol-1 | 21.6 | |||
| Ttoal Bond Stretching Energy/kcal mol-1 | 1.84 | |||
| Total Angle Bending Energy/kcal mol-1 | 1.42 | |||
| Total torsional Energy/kcal mol-1 | 2.35 | |||
| Total van der Waals Energy/kcal mol-1 | 13.7 | |||
| Total Electrostatic Energy/kcal mol-1 | 3.08 |
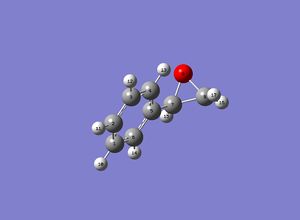
| The numbering of atoms in (R)-styrene oxide | ||
| ||
| Proton Number | Calculated Chemical Shift/δ ppm | Experimental Chemical Shift[7]/δ ppm |
| 10 | 7.48 | 7.27-7.38 |
| 11 | 7.45 | |
| 12 | 7.51 | |
| 13 | 7.30 | |
| 14 | 17.51 | |
| 15 | 3.66 | 3.87 |
| 16 | 3.11 | 2.81 |
| 17 | 2.53 | 3.16 |
As indicated above, the predicted 1H NMR of (R)-styrene oxide aligns well with the literature assigned 1H NMR. Therefore, the calculation can be used to predict the optical rotation of the enantiomer, and, as expected, the 1H NMR of (S)-styrene oxide is almost identical to the one shown above (DOI:10042/28220 ).
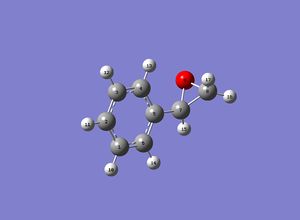
The 13C NMR for (R)-styrene oxide is shown below:

The chemical shifts for the above 13C NMR spectrum is tabulated below:
| The numbering of the carbon atoms in (R)-styrene oxide | |
| |
| Carbon Atom Number | Calculated Chemical Shift/δ ppm |
| 1 | 123.42 |
| 2 | 122.95 |
| 3 | 124.13 |
| 4 | 118.27 |
| 5 | 135.14 |
| 6 | 122.97 |
| 7 | 54.05 |
| 8 | 53.45 |
The 13C NMR spectrum of (S)-styrene oxide is almost identical to that of its enantiomer, as expected. Therefore, the optical rotation could also be calculated accurately.
The procedure used to obtain the 1H NMR of (2S,3S)-trans-β-methyl styrene oxide is described below (DOI:10042/28219 ):
| Results | ||||
|---|---|---|---|---|
| 3D Structure |
| |||
| 2D Structure | 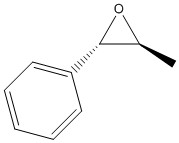 | |||
| Total Energy/kcal mol-1 | 23.1 | |||
| Total Bond Stretching Energy/kcal mol-1 | 1.89 | |||
| Total Angle Bending Energy/kcal mol-1 | 1.74 | |||
| Total torsional Energy/kcal mol-1 | 2.90 | |||
| Total van der Waals Energy/kcal mol-1 | 14.3 | |||
| Total Electrostatic Energy/kcal mol-1 | 3.04 |
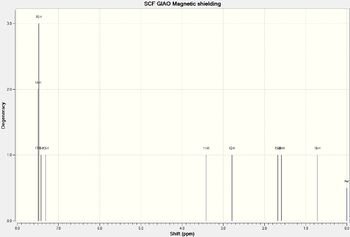
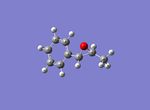
The calculated 1H NMR for (2S,3S)-trans-β-methyl styrene oxide is detailed below:
| The proton numbers in (2S,3S)-trans-β-methyl styrene oxide | ||
| ||
| Proton Number | Calculated Chemical Shift/δ ppm | Experimental Chemical Shift[8]/δ ppm |
| 11 | 3.41 | 3.58 |
| 12 | 2.79 | 3.00-3.05 |
| 13 | 7.31 | 7.25-7.36 |
| 14 | 7.50 | |
| 15 | 7.42 | |
| 16 | 7.48 | |
| 17 | 7.50 | |
| 18 | 0.72 | 1.45 |
| 19 | 1.68 | |
| 20 | 1.59 | |
As can be seen from the table above, the predicted 1H NMR shifts for (2S,3S)-trans-β-methyl styrene oxide is in good agreement with the literature reported values, allowing for the optical rotations of the two trans-β-methyl styrene epoxides to be calculated with a high anticipation in precision. The 1H NMR spectrum for (2R,3R)-trans-β-methyl styrene oxide is almost identical to its enantiomer reported above (DOI:10042/28221 ), as is expected.
The 13C NMR spectrum for (2S,3S)-trans-β-methyl styrene oxide is shown below:
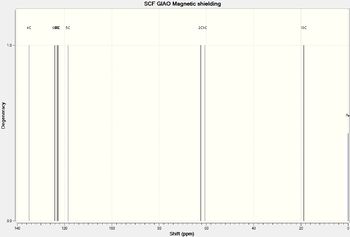
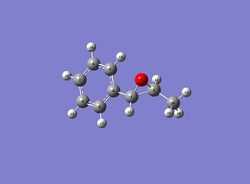
The 13C NMR chemical shifts are tabulated below:
| The numbers of the carbon atoms in (2S,3S)-trans-β-methyl styrene oxide | |
| |
| Carbon Atom Number | Calculated Chemical Shift/δ ppm |
| 1 | 60.58 |
| 2 | 62.32 |
| 4 | 134.98 |
| 5 | 118.49 |
| 6 | 124.07 |
| 7 | 122.73 |
| 8 | 123.33 |
| 9 | 122.80 |
| 10 | 18.84 |
The 13C NMR of (2R,3R)-trans-β-methyl styrene oxide is almost identical to (2S,3S)-trans-β-methyl styrene oxide, as expected.
Assigning the Absolute Configuration of the Products
The Calculated Chiroptical Properties of the Epoxides
| Epoxide | Computed Optical Rotation/° | D-Space Link | Experimental Optical Rotation/° |
|---|---|---|---|
| (R)-Styrene Oxide | -30.13 | DOI:10042/28218 | -33.30[9] |
| (S)-Styrene Oxide | 30.4 | DOI:10042/28217 | 32.1[10] |
| (2R,3R)-Trans-β-methyl Styrene Oxide | 47 | DOI:10042/28216 | 47[11] |
| (2S,3S)-Trans-β-methyl Styrene Oxide | -46.8 | DOI:10042/28215 | 47.8[8] |
The calculated optical rotations for all the epoxides are in good agreement with literature. As further confirmation of the accuracy of the calculated method, the optical rotation of both enantiomers are almost identically opposite one another.
However, looking at literature, the optical rotation for all epoxides vary greatly, dependent on concentration of sample used, the temperature of the measurement, the solvent used and the impurities. As a result, it is difficult to ascertain how well the literature reported values have been measured, and hence which are accurate and reliable. Therefore, computationally calculated optical rotations can be utilized to confirm which literature reported ones have been done so correctly, and with a high degree of enantiomeric excess (which can be a indicator of catalyst selectivity and efficiency, and the purification method employed by the author).
Using the Calculated Properties of Transition State for the Reaction
The difference in free energy, ΔG, between the two enantiomers for each alkene, trans-β-methyl styrene and styrene, epoxidised by each of the two catalysts, Jacobsen catalyst and Shi catalyst, was found by the difference in the sum of the electronic and thermal free energies. The conversion from Hartrees to kJ mol-1 is 2626 kJ mol-1. From this ΔG, the equilibrium constant, K, between the two enantiomers was determined using the equation Failed to parse (syntax error): {\displaystyle K=exp(\frac{-ΔG}{RT})} , where R is the universal gas constant (8.314x10⁻³ kJ K-1 mol-1), and T is the temperature (298.15 K). The mole fraction of the reactants (S-styrene oxide for the epoxidation of the styrene, and in the case of the trans-β-methyl styrene alkene, the (2S,3S)-trans-β-methyl styrene oxide enantiomer), x, is calculated using . The mole fraction of the product (the other enantiomer), y, is found by . Subsequently, the enantiomeric excess, ee, of the most stable enantiomer (the one with the lowest ΔG) is found using the equation . The results of this analysis is summarized in the table below:
| Alkene | Catalyst | Enantiomer | Sum of Electronic and Thermal Free Energies/Hartrees | ΔG/kJ mol-1 | K | x | y | ee/% | Enantiomer |
| Styrene | Jacobsen | R-styrene oxide | -3343.962162 | 18.47 | 5.799x10⁻⁴ | 0.9994 | 5.795x10⁻⁴ | 99.88 | S-styrene Oxide |
| S-styrene oxide | -3343.969197 | ||||||||
| Shi | R-styrene oxide | -1303.738044 | 1.205 | 0.6149 | 0.6192 | 0.3808 | 23.84 | S-styrene Oxide | |
| S-styrene oxide | -1303.738503 | ||||||||
| Trans-β-methyl Styrene | Jacobsen | (2R,3R)-trans-β-methyl Styrene Oxide | -3383.254344 | 21.37 | 1.804x10⁻⁴ | 0.9998 | 1.804x10⁻⁴ | 99.96 | (2S,3S)-trans-β-methyl Styrene Oxide |
| (2S,3S-trans-β-methyl Styrene Oxide | -3383.262481 | ||||||||
| Shi | (2R,3R)-trans-β-methyl Styrene Oxide | -1343.032443 | -20.22 | 3492 | 2.863x10⁻⁴ | 0.9997 | 99.94 | (2R,3R)-trans-β-methyl Styrene Oxide | |
| (2S,3S)-trans-β-methyl Styrene Oxide | -1343.024742 |
As can be seen from the table above, assuming the epoxidation of trans-β-methyl styrene and of styrene as well proceeds via a kinetic pathway (lowest energy transition state, so the activation energy is lowest), the stereoselectivity of the reaction is almost 100%, apart from the Shi catalyst epoxidation of styrene. The low ee in particular for this epoxidation can be explained by the low energy difference between the transition states to form this particular conformation of the epoxide, which are all accessible at room temperature (the conditions used to epxidise the alkenes).
The high ee achieved with the Jacobsen catalyst on styrene can be explained by the favourable π interactions between the phenyl rings of both substrates.
Investigating the Non-Covalent Interactions in the Active Site of the Reaction Transition State
The NCI analysis for the Shi catalyst epoxidation of (2R,3R)-trans-β-methyl styrene is shown below:
Orbital |
A large, attractive, van der Waals interaction exists between the acetal protecting group of the methylene hydroxyl group, and the double bond and methyl substituent of the trans-β-methyl styrene. This large interaction may be controlling the stereochemistry of epoxidation of the alkene, but this is unknown as the NCI analysis for the formation of (2S,3S)-trans-β-methyl styrene oxide has not been carried out. The significant interacting groups within this area of the transition state are the interactions between a methyl substituent of the protecting group and the alkenyl system bearing the methyl group, in addition to the alkenyl methyl group interacting with the methylene position within the protecting group. Although individual van der Waals interactions may be weak, the summation of a large number of these interactions are strong and therefore stabilizing and favourable.
Additionally, there are attractive van der Waals interactions between the methylidyne moeity adjacent to the epoxidising dioxirane group, and the phenyl ring of the trans-β-methyl styrene alkene.
Investigating the Electronic Topology (QTAIM) in the Active Site of the Reaction Transition State

A QTAIM analysis of the transition state involved in the Shi epoxidation of trans-β-methyl styrene to produce (2R,3R)-trans-β-methyl styrene oxide was carried out, the results of which is shown in the diagram on the right. A BCP is shown equidistant between a methylene proton protected and a methyl proton connected to the alkene, confirming a non-covalent interaction is present. A BCP is also shown between a methyl proton of the protecting group, and both of an alkenyl proton as well as an aromatic proton. This van der Waals interaction, however, is skewed slightly more to the methyl proton, so it is surrounded by a higher electron density in comparison to both the protons it interacts with.
The same two methine protons also display non-covalent interactions with an anomeric oxygen involved in the ketal protecting group. These interactions are also more electron dominant on the oxygen atom, as expected due to the high electronegativity of oxygen. This interaction could also be seen to hold the alkene in a specific stereoconformation for epoxidation, due to its polar nature. However, this cannot be verified as a stereo-defining interaction unless the transition state to form the (2S,3S)-trans-β-methyl styrene oxide is analysed via NCI and QTAIM.
A bond-forming interaction is also shown between an oxygen atom of the dioxirane group and the alkenyl carbon bearing the methyl substituent. The electron density in this interaction, however, is spread evenly between the two atoms. Subsequently, the electron density in the alkene is also distributed evenly between the two carbon atoms, indicating that bond isn't polarised and isn't about to break in the transition state, despite a interaction between a alkenyl carbon atom and a oxygen atom of the dioxirane moeity.
Suggesting New Candidates for Investigations
The epoxide 2,3-epoxy-2-methyl-1,4-naphthoquinone can be synthesized from 2-methyl-1,4-naphthalenedione, or menadione, as indicated below:

A 25 g bottle of menadione can be bought from Sigma-Aldrich for £24.20, corresponding to an appealing, cheap epoxidation.
In addition, optical rotatory power data for the epoxide is scarce: in chloroform at 405 nm and 20°C, one literature reports it as 356°;[12] another journal reports the optical rotation as -72°, but at 22°C and 436 nm.[13] The large deviations in these two reported values (despite the small changes in light wavelength applied and temperature) indicate a calculation would help serve as a basis so as to assign the real optical rotation of the epoxide.
References
<references> [1] [2] [3] [4] [5] [6] [7] [8] [9] [10] [11] [12] [13]
- ↑ 1.0 1.1 K. F. Williamson and Y. F. L. Hsu, J. Am. Chem. Soc., 1970, 92, 7385
- ↑ 2.0 2.1 Encyclopedia of Polymer Science and Technology, John Wiley and Sons, Inc., New York, 4th edn., 2014, pp. 761
- ↑ 3.0 3.1 3.2 3.3 L. A. Paquette, N. A. Pegg, D. Toops, G. D. Maynard and R. D. Rogers, J. Am. Chem. Soc., 1990, 112, 277
- ↑ 4.0 4.1 W. F. Maier and P. V. R. Schleyer, J. Am. Chem. Soc., 1981, 103, 1891
- ↑ 5.0 5.1 J. W. Yoon, T. S. Yoon, S. W. Lee and W. Shin, Acta Crystallogr. Sect. C-Cryst. Struct. Commun., 1999, 55, 1766
- ↑ 6.0 6.1 J. W. Yoon, T. S. Yoon and W. Shin, Acta Crystallogr. Sect. C-Cryst. Struct. Commun., 1997, 53, 1685
- ↑ 7.0 7.1 O. Boutureira, J. F. McGouran, R. L. Stafford, D. P. G. Emmerson and B. G. Davis, Org. Biomol. Chem., 2009, 7, 4285
- ↑ 8.0 8.1 8.2 P. C. B. Page, M. M. Farah, B. R. Buckley and A. J. Blacker, J. Org. Chem., 2007, 72, 4424
- ↑ 9.0 9.1 F. R. Jensen and R. C. Kiskis, J. Am. Chem. Soc., 1974, 97, 5825
- ↑ 10.0 10.1 H. Lin, Y. Liu and Z. L. Wu, Tetrahedron-Asymmetry, 2011, 22, 134
- ↑ 11.0 11.1 G. Fronza, C. Fuganti, P. Grasselli and A Mele, J. Org. Chem., 1991, 56, 6019
- ↑ 12.0 12.1 A. Berkessel, M. Guixà, F. Schmidt, J. M. Neudörfl and J. Lex, Chem. Eur. J., 2007, 13, 4483
- ↑ 13.0 13.1 A. Bunge, H. J. Hamann, E. McCalmont and J. Liebscher, Tetrahedron Lett., 2009, 50, 4629

