Rep:Mod:sm6416IMM2
NH3
Information
NH3 Optimisation
Calculation Type	OPT FREQ
Calculation Method	RB3LYP
Basis Set	6-31G(d,p)
Point Group	C3V
Charge	0
Spin	Singlet
E(RB3LYP)	-56.55776873	 a.u.
RMS Gradient Norm	0.00000485	 a.u.
Imaginary Freq	0
Dipole Moment	1.8466	 Debye
Optimised N-H bond distance 1.01798 Angstrom, compared to the literature value of 1.012 Angstrom.[1] An optimised H-N-H bond angle 105.741 degress, compared to the literature value of 106.7 degrees.[1] The value obtained through the optimisation is more accurate due to the rounding observed in the literature value.
Item Table
         Item               Value     Threshold  Converged?
 Maximum Force            0.000004     0.000450     YES
 RMS     Force            0.000004     0.000300     YES
 Maximum Displacement     0.000072     0.001800     YES
 RMS     Displacement     0.000035     0.001200     YES
 Predicted change in Energy=-5.986266D-10
 Optimization completed.
    -- Stationary point found.
                           ----------------------------
                           !   Optimized Parameters   !
                           ! (Angstroms and Degrees)  !
 --------------------------                            --------------------------
 ! Name  Definition              Value          Derivative Info.                !
 --------------------------------------------------------------------------------
 ! R1    R(1,2)                  1.018          -DE/DX =    0.0                 !
 ! R2    R(1,3)                  1.018          -DE/DX =    0.0                 !
 ! R3    R(1,4)                  1.018          -DE/DX =    0.0                 !
 ! A1    A(2,1,3)              105.7412         -DE/DX =    0.0                 !
 ! A2    A(2,1,4)              105.7412         -DE/DX =    0.0                 !
 ! A3    A(3,1,4)              105.7412         -DE/DX =    0.0                 !
 ! D1    D(2,1,4,3)           -111.8571         -DE/DX =    0.0                 !
 --------------------------------------------------------------------------------
 GradGradGradGradGradGradGradGradGradGradGradGradGradGradGradGradGradGrad
Structure
Optimised NH3 Molecule
Vibrations
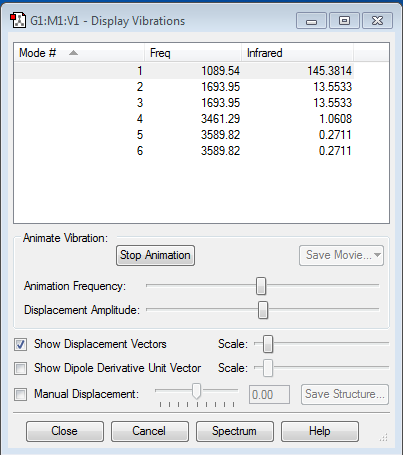
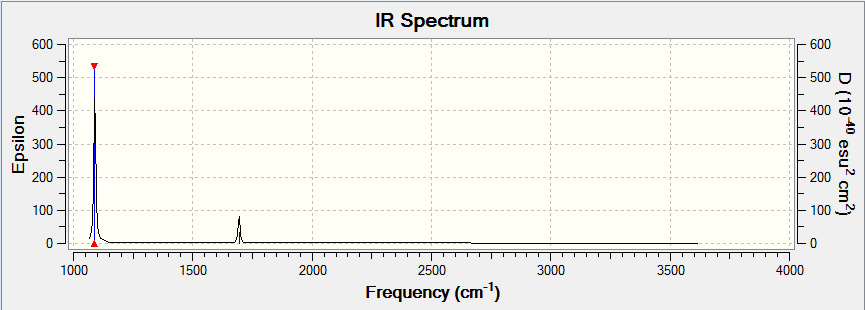
| Frequency (cm-1) | IR Intensity | Molecular Vibration | Comments | |||
|---|---|---|---|---|---|---|
| 1089.54 | 145.3814 |
|
This asymmetric bending results in the greatest change in dipole moment. | |||
| 1693.95 | 13.5533 |
|
This is an asymmetric bending motion, but with a smaller change in dipole moment, hence the smaller IR intensity. These two motions have the same change in dipole moment and are hence observed at the same frequency. | |||
| 1693.95 | 13.5533 |
| ||||
| 3461.29 | 1.0608 |
|
This symmetric stretch causes a small change in the dipole moment of NH3, hence the low IR intensity. | |||
| 3589.82 | 0.2711 |
|
These two asymmetric stretches are degenerate in energy and therefore are observed at the same frequency however, since these stretching motions result in a very small change in the dipole moment of NH3, the peaks are too small to be seen on the IR spectrum below. | |||
| 3589.82 | 0.2711 |
|
NH3 IR Spectrum
1. How many modes do you expect from the 3N-6 rule?
From the 3N-6 rule, 6 vibrational modes are expected. As can be seen from the NH3 Display Vibrations table, 6 vibrational modes were recorded.
2. Which modes are degenerate? Modes 2&3 are degenerate at a frequency of 1693.95cm-1. Modes 5&6 are also degenerate at a frequency of 3589.82cm-1.
3. Which modes are "bending" vibrations and which are "bond stretch" vibrations? Modes 1,2,3 are bending vibrations, with modes 4,5,6 being stretching vibrations.
4. Which mode is highly symmetric? Mode 4 is highly symmetric.
5. One mode is known as the "umbrella" mode, which one is this? Mode 1 is the 'umbrella' mode.
6. How many bands would you expect to see in an experimental spectrum of gaseous ammonia?
In the experimental spectrum of gaseous ammonia, 4 bands would be observed.
Charge Distribution
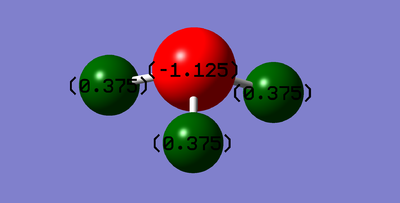
| Atom | Charge |
|---|---|
| Nitrogen | -1.125 |
| Hydrogen | +0.375 |
A negative charge would be expected on nitrogen due to its high electronegativity in comparison with oxygen. Therefore nitrogen is electron withdrawing and hence, due to its lower electronegativity, hydrogen assumes a positive charge.
N2
Information
N2 Optimisation
Calculation Type	OPT FREQ
Calculation Method	RB3LYP
Basis Set	6-31G(d,p)
Point Group	D∞H
Charge	0
Spin	Singlet
E(RB3LYP)	-109.52412868	 a.u.
RMS Gradient Norm	0.00000060	 a.u.
Imaginary Freq	0
Dipole Moment	0.0000	 Debye
Optimised length of 1.10550 Angstrom for the N2 triple bond, which is compared to a literature value of 1.0975 Angstrom.[2] The difference in the two values may have arisen from the assumptions the basis set made. Or in fact, different computer programs would yield slightly different results. However for the most case, these two bond lengths are very similar and only vary by 8 x 10⁻³ Angstroms.
Item Table
         Item               Value     Threshold  Converged?
 Maximum Force            0.000001     0.000450     YES
 RMS     Force            0.000001     0.000300     YES
 Maximum Displacement     0.000000     0.001800     YES
 RMS     Displacement     0.000000     0.001200     YES
 Predicted change in Energy=-3.400967D-13
 Optimization completed.
    -- Stationary point found.
                           ----------------------------
                           !   Optimized Parameters   !
                           ! (Angstroms and Degrees)  !
 --------------------------                            --------------------------
 ! Name  Definition              Value          Derivative Info.                !
 --------------------------------------------------------------------------------
 ! R1    R(1,2)                  1.1055         -DE/DX =    0.0                 !
 --------------------------------------------------------------------------------
 GradGradGradGradGradGradGradGradGradGradGradGradGradGradGradGradGradGrad
Structure
Optimised N2 Molecule
Vibrations
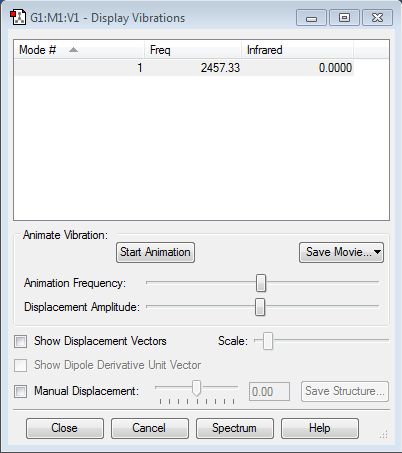
The above vibrations table shows that N2 follows the 3N - 5 rule, 3(2) - 5 = 1, as it is a linear molecule, hence only one vibration mode is present. However, this vibration mode is IR inactive as there is no change in the dipole moment of the molecule as both molecules have no charge and a symmetric stretch is observed.
Charge Distribution
| Atom | Charge |
|---|---|
| Nitrogen | 0.000 |
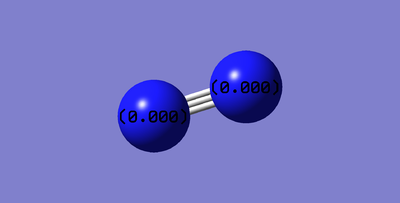
The electronegativities of both nitrogen atoms are the same, therefore the difference between them is zero, hence there is no permanent dipole present in the neutral molecule.
H2
Information
H2 Optimisation
Calculation Type	OPT FREQ
Calculation Method	RB3LYP
Basis Set	6-31G(d,p)
Point Group	D∞H
Charge	0
Spin	Singlet
E(RB3LYP)	-1.17853936	 a.u.
RMS Gradient Norm	0.00000017	 a.u.
Imaginary Freq	0
Dipole Moment	0.0000	 Debye
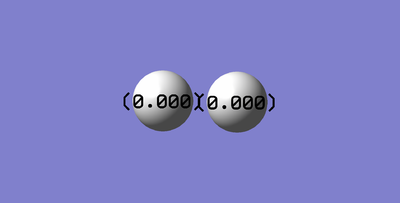
H-H bond length of 0.74279 Angstrom, confirmed with the literature value of 0.74 Angstrom.[3] This signifies that the basis set and method used for the optimisation was appropriate.
Item Table
         Item               Value     Threshold  Converged?
 Maximum Force            0.000000     0.000450     YES
 RMS     Force            0.000000     0.000300     YES
 Maximum Displacement     0.000000     0.001800     YES
 RMS     Displacement     0.000001     0.001200     YES
 Predicted change in Energy=-1.164080D-13
 Optimization completed.
    -- Stationary point found.
                           ----------------------------
                           !   Optimized Parameters   !
                           ! (Angstroms and Degrees)  !
 --------------------------                            --------------------------
 ! Name  Definition              Value          Derivative Info.                !
 --------------------------------------------------------------------------------
 ! R1    R(1,2)                  0.7428         -DE/DX =    0.0                 !
 --------------------------------------------------------------------------------
 GradGradGradGradGradGradGradGradGradGradGradGradGradGradGradGradGradGrad
Structure
Optimised H2 Molecule
Vibrations
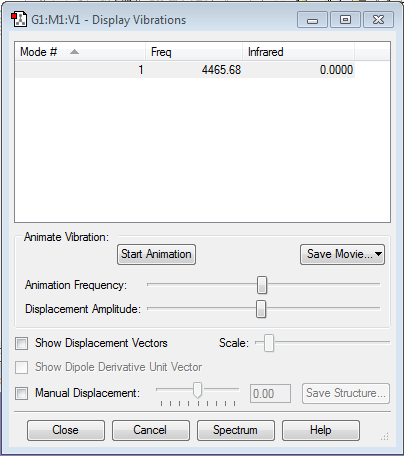
The above vibrations table shows that H2 follows the 3N - 5 rule, as it is a linear molecule, 3(2) - 5 = 1, hence only one vibration mode is present. However, this vibration mode is IR inactive as there is no change in the dipole moment of the molecule as both molecules have no charge and a symmetric stretch is observed.
Charge Distribution
| Atom | Charge |
|---|---|
| Hydrogen | 0.000 |
The electronegativities of both hydrogen atoms are the same, therefore the difference between them is zero, hence there is no permanent dipole present in the neutral molecule.
Energetics of the Haber-Bosch Process
Reaction
N2 + 3H2 → 2NH3
| E(NH3) | -56.55776873a.u. |
|---|---|
| 2*E(NH3) | -113.11553746a.u. |
| E(N2) | -109.52412868a.u. |
| E(H2) | -1.17853936a.u. |
| 3*E(H2) | -3.53561808a.u. |
| ΔE=2*E(NH3)-[E(N2)+3*E(H2)] | -0.05579070a.u. |
The energy change in kJ/mol: ΔE = -0.05579070 x 2625.5 = -145.47848285 kJ/mol. Therefore to 2d.p., the energy change ΔE = -145.48 kJ/mol. The negative sign associated with the enthalpy change indicates that this reaction is exothermic and therefore the products lie at a lower energy than the reactants, this implies that the ammonia product is more stable than the gaseous hydrogen and nitrogen reactants. The value of -145.48 kJ/mol compares to the literature value from ChemGuide of -92 kJ/mol.[4] The difference between the two values is due to GaussView making assumptions when calculating the energy of the molecules, this is determined by the basis set of 6-31G(d,p) being used. The experimental values are more reliable in this scenario as they take into account the true energetics of each molecule involved in the reaction.
CO
Information
CO Optimisation
Calculation Type	OPT FREQ
Calculation Method	RB3LYP
Basis Set	6-31G(d,p)
Point Group	C∞V
Charge	0
Spin	Singlet
E(RB3LYP)	-113.30945314	 a.u.
RMS Gradient Norm	0.00000433	 a.u.
Imaginary Freq	0
Dipole Moment	0.0599	 Debye
The optimised CO triple bond length is 1.13794 Angstrom.
Item Table
         Item               Value     Threshold  Converged?
 Maximum Force            0.000007     0.000450     YES
 RMS     Force            0.000007     0.000300     YES
 Maximum Displacement     0.000003     0.001800     YES
 RMS     Displacement     0.000004     0.001200     YES
 Predicted change in Energy=-2.221220D-11
 Optimization completed.
    -- Stationary point found.
                           ----------------------------
                           !   Optimized Parameters   !
                           ! (Angstroms and Degrees)  !
 --------------------------                            --------------------------
 ! Name  Definition              Value          Derivative Info.                !
 --------------------------------------------------------------------------------
 ! R1    R(1,2)                  1.1379         -DE/DX =    0.0                 !
 --------------------------------------------------------------------------------
 GradGradGradGradGradGradGradGradGradGradGradGradGradGradGradGradGradGrad
Structure
Optimised CO Molecule
Vibrations
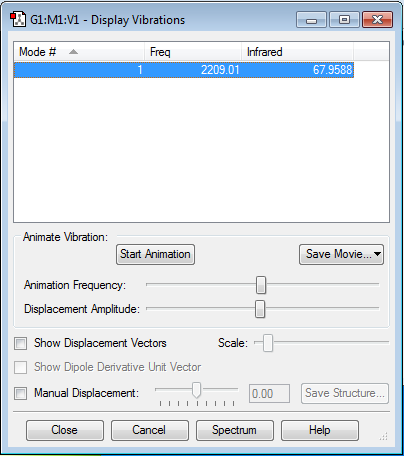
| Frequency (cm-1) | IR Intensity | Molecular Vibration | Comments | |||
|---|---|---|---|---|---|---|
| 2209.01 | 67.9588 |
|
Although a symmetric stretch is exhibited, the molecule is IR active as there is a change in dipole moment, which can be exhibited by the IR Intensity of 67.9588. This is due to the equal and oppositely charged carbon and oxygen atoms. As the bond stretches, the distance between the two atoms varies, resulting in a change in dipole moment. |
CO IR Spectrum
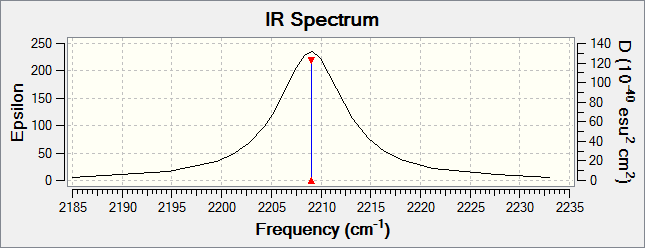 The IR information shows that there is only 1 active IR vibration in CO at 2209.01cm-1, this follows the 3N-5 rule as it is a linear molecule. 3(2) - 5 = 1.
Charge Distribution
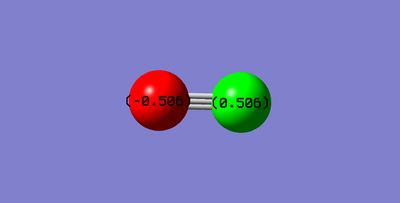
| Atom | Charge |
|---|---|
| Carbon | +0.506 |
| Oxygen | -0.506 |
The charge distribution shows that there are equal and opposite charges on every molecule of CO, therefore the overall molecule is neutral. It is expected that oxygen adopts the more negative charge as it is more electronegative than carbon.
Molecular Orbitals
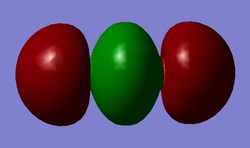
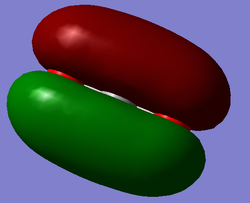
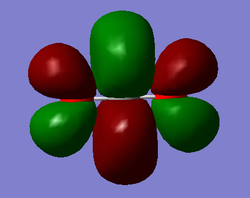
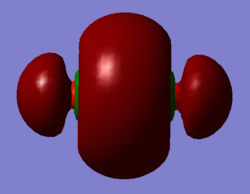
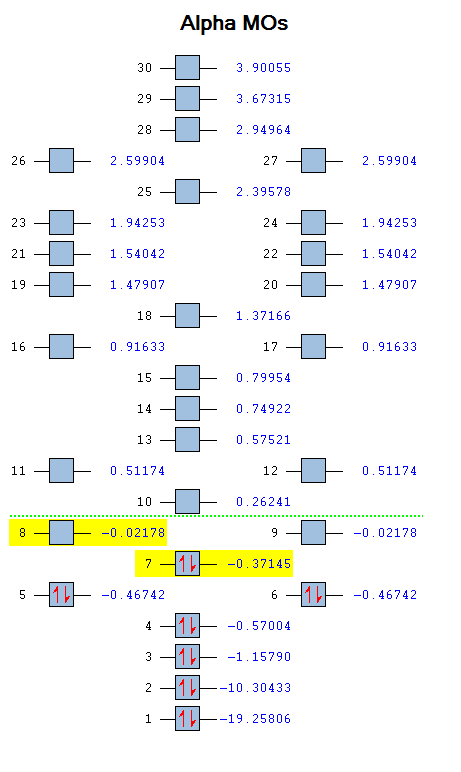
The molecular diagram below was created using a degeneracy threshold of 0.00001, which separated out all the energy levels, making it easy to identify degenerate molecular orbitals.
CO2
Information
CO2 Optimisation
Calculation Type	OPT FREQ
Calculation Method	RB3LYP
Basis Set	6-31G(d,p)
Point Group	D∞H
Charge	0
Spin	Singlet
E(RB3LYP)	-188.58093945	 a.u.
RMS Gradient Norm	0.00001154	 a.u.
Imaginary Freq	0
Dipole Moment	0.0000	 Debye
Optimised C=O bond length of 1.16915 Angstrom.
Item Table
         Item               Value     Threshold  Converged?
 Maximum Force            0.000024     0.000450     YES
 RMS     Force            0.000017     0.000300     YES
 Maximum Displacement     0.000021     0.001800     YES
 RMS     Displacement     0.000015     0.001200     YES
 Predicted change in Energy=-5.259645D-10
 Optimization completed.
    -- Stationary point found.
                           ----------------------------
                           !   Optimized Parameters   !
                           ! (Angstroms and Degrees)  !
 --------------------------                            --------------------------
 ! Name  Definition              Value          Derivative Info.                !
 --------------------------------------------------------------------------------
 ! R1    R(1,2)                  1.1691         -DE/DX =    0.0                 !
 ! R2    R(1,3)                  1.1691         -DE/DX =    0.0                 !
 ! A1    L(2,1,3,-2,-1)        180.0            -DE/DX =    0.0                 !
 ! A2    L(2,1,3,-3,-2)        180.0            -DE/DX =    0.0                 !
 --------------------------------------------------------------------------------
 GradGradGradGradGradGradGradGradGradGradGradGradGradGradGradGradGradGrad
Structure
Optimised CO2 Molecule
Vibrations
| Frequency (cm-1) | IR Intensity | Molecular Vibration | Comments | |||
|---|---|---|---|---|---|---|
| 639.99 | 30.7186 |
|
This is an asymmetric scissoring vibration that results in a change in dipole moment, hence IR active. | |||
| 639.99 | 30.7186 |
|
This is an asymmetric wagging vibration that results in a change in dipole moment, hence IR active. | |||
| 1372.08 | 0.0000 |
|
This is a symmetric stretch of the C=O bond. There is no change in dipole moment as the stretching occurs hence IR inactive. | |||
| 2436.37 | 545.8344 |
|
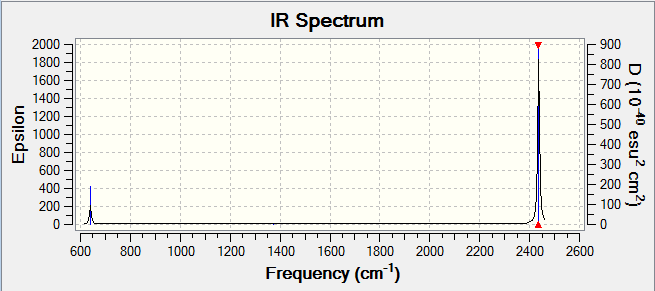
This is an asymmetric stretch of the C=O bond that results in the greatest change in dipole moment across the molecule, hence IR active. This is further shown by the high peak intensity in the IR Spectrum below. |
Charge Distribution
| Atom | Charge |
|---|---|
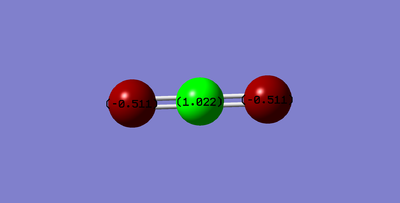
| Carbon | +1.022 |
| Oxygen | -0.511 |
The difference in electronegativity between carbon and oxygen indicates that oxygen would adopt a negative charge, with carbon a positive charge. Oxygen is more electronegative than carbon. It is also interesting to note how positively charged the carbon atom is.
Molecular Orbitals
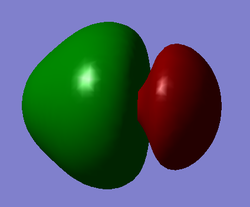
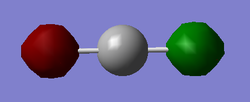
The molecular diagram below was created using a degeneracy threshold of 0.00001, which separated out all the energy levels, making it easy to identify degenerate molecular orbitals.
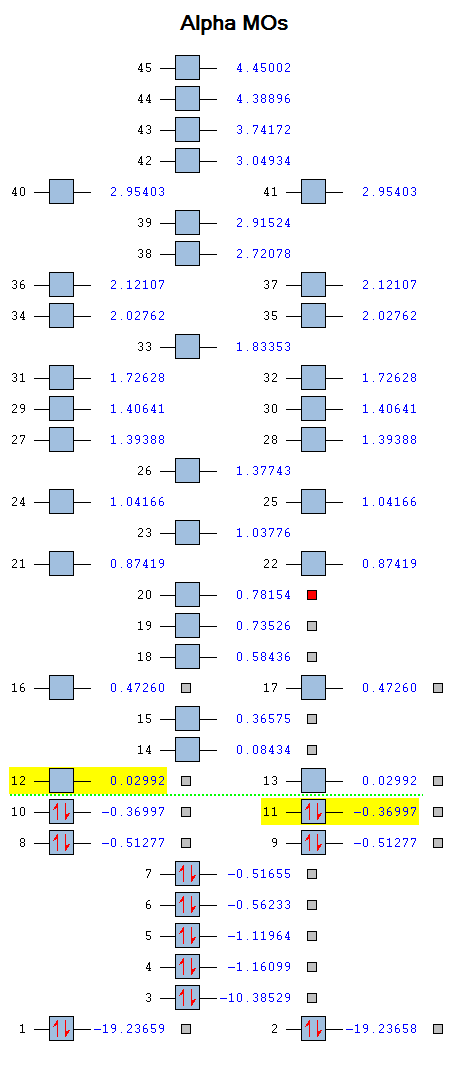
As can be seen from the Molecular Orbitals diagram, there are four unoccupied antibonding orbitals which allow the to C=O bonds to exist in CO2.
Bibliography
- ↑ 1.0 1.1 https://en.wikipedia.org/wiki/Ammonia_(data_page) (Accessed 24/2/17 at 15:15)
- ↑ http://www.wiredchemist.com/chemistry/data/nitrogen-compounds (Accessed 24/2/17 at 15:35)
- ↑ http://www.science.uwaterloo.ca/~cchieh/cact/c120/bondel.html (Accessed 24/2/17 at 15:30)
- ↑ http://www.chemguide.co.uk/physical/equilibria/haber.html (Accessed 24/2/17 at 11:00)

