
Rep:Mod:slau91
Computational Labs: Module 2
Samantha Lau
Bonding and Molecular Orbitals in Main Group Compounds [1]
The software GaussView 5.0.9. will be used throughout this lab in order to carry out optimisation, frequency and energy analysis on selected small molecules to appreciate the actual calculations that goes into the software as well as interpreting the numbers that comes out at the end. Comparison and analysis will be made throughout this investigation in order to relate computational chemistry to theory and 'real life' reactions.
BH3
Basis set: 3-21G
One molecule of BH3 was created on the software with initial inputted bond lengths of B-H changed to 1.5Å. Optimisation was now ready for the prepared molecule using method: DFT/B3LYP (this determines the type of approximations that are made in solving the Schrodinger equation) and basis set: 3-21G (which is low accuracy for this method but this is compensated by the speed of the calculation).
The following BH3 molecule is the generated jmol file from the above calculations.
Item               Value     Threshold  Converged?
 Maximum Force            0.000413     0.000450     YES
 RMS     Force            0.000271     0.000300     YES
 Maximum Displacement     0.001610     0.001800     YES
 RMS     Displacement     0.001054     0.001200     YES
 Predicted change in Energy=-1.071764D-06
 Optimization completed.
    -- Stationary point found.
| File type | .log |
| Calculation type | FOPT |
| Method | DFT/B3LYP |
| Basis set | 3-21G |
| Final Energy | -26.46226338 a.u. |
| Gradient | 0.0002 a.u. |
| Dipole moment | 0.00 |
| Point Group | D3H |
| Calculation time | 0mins 24.0secs |
When we optimise a molecule using Gaussian we are finding the point at which there is no net force exerted upon the nuclei or the the electrons i.e. all interactions are in equilibrium with each other. This basis set yielded the optimum bond length for B-H as 1.93Å and H-B-H bond angle of 120.0°.
Basis Set: 6-31G(d, p)
As stated previous the basis set determines the accuracy of the calculation; it determines the number of functions used to describe the electronic structure of the molecule. With the same method (DFT/B3LYP)but using basis set 6-31G we can build a better optimisation of BH3 yielding the following BH3 molecule and calculations. This basis set takes into account the core orbitals more than 3-21G. With other molecules the core orbitals becomes much more important when taken into consideration of calculation.
Item               Value     Threshold  Converged?
 Maximum Force            0.000433     0.000450     YES
 RMS     Force            0.000284     0.000300     YES
 Maximum Displacement     0.001702     0.001800     YES
 RMS     Displacement     0.001114     0.001200     YES
 Predicted change in Energy=-1.189019D-06
 Optimization completed.
    -- Stationary point found.


| File type | .log |
| Calculation type | FOPT |
| Method | DFT/B3LYP |
| Basis set | 6-31G (d,p) |
| Final Energy | -26.61532252 a.u. |
| Gradient | 0.0002 a.u. |
| Dipole moment | 0.00 |
| Point Group | D3H |
| Calculation time | 0mins 17.0secs |
The determined optimised B-H bond length calculated was 1.19Å and H-B-H angle of 120.0°.
It is worth noting one cannot compare the results in terms of energy for the two basis set carried out so far therefore one cannot say one computation is better purely as the final energy calculated using the 6-31G(d,p) is more negative than the final energy calculated using 3-21G.
The two graphs depicted for the optimisation and gradient vs optimisation step number shows qualitatively the change in energy and RMS gradient Norm as the molecule gets optimised. For BH3 there are 3 intermediate structures with the 4th structure being the optimised molecule.
These graphs can be found by opening the .LOG files for all the previous and subsequent calculations.
TlBr3
For heavier elements the high number of electrons means the atoms will exhibit relativistic effects which cannot be recovered by the standard Schrodinger equation but by using a pseudo-potential (PP). This function is based on the assumption that the valence electrons are dominant in the bonding interactions and therefore the core orbitals can be modeled using PP making calculations much more simple.
Basis Set: LANL2DZ
Using the model psuedo-potential function TlBr3 was optimised by first creating an input file using Gaussian. The symmetry label of the thallium bromide molecule was restricted to D3H with the tolerance increased to very tight (0.0001). Method chosen was DFT/B3LYP and basis set:LanL2DZ which is a medium level basis set. The input file was submitted to the Departmental SCAN Cluster that uses Density Functional theory (DFT). This yielded the following TlBr3 molecule with the calculations found here DOI:10042/21584
 Item               Value     Threshold  Converged?
 Maximum Force            0.000002     0.000450     YES
 RMS     Force            0.000001     0.000300     YES
 Maximum Displacement     0.000022     0.001800     YES
 RMS     Displacement     0.000014     0.001200     YES
 Predicted change in Energy=-6.084033D-11
 Optimization completed.
    -- Stationary point found.
| File type | .log |
| Calculation type | FOPT |
| Method | DFT/B3LYP |
| Basis set | LANL2DZ |
| Final Energy | -91.21812851 a.u. |
| Gradient | 0.0000 a.u. |
| Dipole moment | 0.00 |
| Point Group | D3H |
| Calculation time | 0mins 37.5secs |
The determined optimised Tl-Br length calculated was 2.65Å and Br-Tl-Br angle of 120.0° with literature quoting the bond length of Tl-Br as 2.52Â[2]. The calculated bond length is larger than the one quoted for literature showing the limitations of the method used for this optimisation. Even using mixed orbital basis set the results are out by around 0.10Å which is quite large revealing the inaccuracy of the basis set used.
BBr3
Basis Set: Mixed
With molecules that contain both heavy (Br) and light (B) atoms we need to be able to mix both basic sets and psuedo-potential functions. For BBr3 the original optimised output .LOG file for BH3 using basis set: 6-31G(d,p) was used but changing the basis set to GEN which allowed us to individually choose the basis set for each atom. The basis set were manually changed in another file so that boron was under basis set 6-31G and bromine was under basis set LanL2DZ. The now altered input file was saved and ran through the departmental SCAN cluster yielding the following BBr3 molecule with the calculations found here DOI:10042/21589
Item               Value     Threshold  Converged?
 Maximum Force            0.000008     0.000450     YES
 RMS     Force            0.000005     0.000300     YES
 Maximum Displacement     0.000036     0.001800     YES
 RMS     Displacement     0.000023     0.001200     YES
 Predicted change in Energy=-4.026780D-10
 Optimization completed.
    -- Stationary point found.
| File type | .log |
| Calculation type | FOPT |
| Method | DFT/B3LYP |
| Basis set | Gen |
| Final Energy | -64.43645296 a.u. |
| Gradient | 0.0000 a.u. |
| Dipole moment | 0.00 |
| Point Group | D3H |
| Calculation time | 0mins 18.1secs |
The determined optimised B-Br bond length calculated was 1.93Å and Br-B-Br angle of 120.0°
Comparison of Optimised Molecules
| Molecule | B-H3 (6-31G (d,p)) | Tl-Br3 | B-Br3 |
| Bond Length/Å | 1.19 | 2.65 | 1.93 |
It is evident from the tabulated data that changing the ligand connected to the central atom significantly changes the optimised bond lengths. Comparing B-H (basis set:6-31G(d,p)) to the B-Br bond lengths and we are thus actually comparing the hydride ligand to the bromide ligand. It seems the heavier the ligand the greater the bond length, given all other conditions are the same and the fact both hydride and bromide are one electron donors. This could be due to the energy mismatch between the heavy Br and the light B atom thus weaker bonding interactions and hence weaker bonds formed relative to B and H atoms. Spatially hydrogen is smaller than bromine so can pack more closer to the central boron atom as well so there is greater steric hindrance with bromide all which could explain why B-Br bond length (1.93Å) is longer than B-H bond length (1.19Å).
Another comparison that can be made is between Tl-Br and B-Br bond lengths with only the central atom different this time. Thallium is a heavy element relative to Br and B so the energy mismatch between itself and bromide ligands is much greater than the mismatch between boron and bromide. This again results in weaker bonding orbitals thus longer bond length than B-Br. The greater number of electrons surrounding the thallium makes the repulsive force between electrons between the central atom and ligand felt at greater distance for TlBr3 than BBr3 as well. The similarities between B and Tl are that they are both in group 3 and have empty p-orbitals where they can accept electrons into. Down towards group 3 the inert pair effect also comes into consideration whereby the energy gap between the outermost s and p orbitals becomes larger therefore the +1 oxidation state is more stable for large elements in group 3 like thallium whereas +3 oxidation state is more stable for lighter elements in group 3 like boron. The contraction of the 6s orbital to be involved in bonding for thallium makes the bond formed in Tl-Br weaker once more to the extent where TlBr3 is not stable at room temperature.
Gaussview draws bonds on the molecule based on distance criteria. In some of the structures drawn for the molecules above, Gaussview doesn't draw in the bond this however does not mean there isn't a bond between two atoms but the distance is beyond the Gaussview criteria. But what is a bond? One might suggest a conceptual devise made by man in order to understand and visualise molecules as our feeble minds struggle to grasp these abstract concepts of electron density, wave-functions and molecular orbitals. A chemical bond is merely a useful and convenient visual aid to 'see' the wavefunctions of atoms interacting with each other on a quantum level to form something entirely different from the starting material which at times can vastly change the chemical and physical properties of that new substance. Like Gaussview we ourselves set the criteria for when a bond is formed or not.
Vibrational analysis
So far all the optimisations carried out were to find the stationary points in the potential energy vs. molecular spacing graph. The first derivative allows us to find these stationary points however this could either be the ground state which is what we are looking for or a transition state. In order to calculate whether the stationary point is indeed a minimum and therefore the ground state one must carry out a second derivative of the potential energy vs molecular spacing graph which is the frequency analysis for Gaussian. A negative frequency calculation corresponds to a maximum and a positive frequency calculation corresponds to a minimum.
BH3
The original optimisation file for BH3 with basis set: 6-31G(d,p) was used with the file name changed and the Gaussian Calculation chosen to be 'frequency analysis' this time but keeping the method to DFT/3BLYP and basis set 6-31G (d,p). This was ran yielding the following BH3 molecule and calculations.
Item               Value     Threshold  Converged?
 Maximum Force            0.000003     0.000015     YES
 RMS     Force            0.000002     0.000010     YES
 Maximum Displacement     0.000013     0.000060     YES
 RMS     Displacement     0.000008     0.000040     YES
 Predicted change in Energy=-6.156982D-11
 Optimization completed.
    -- Stationary point found.
| File type | .log |
| Calculation type | FREQ |
| Method | DFT/B3LYP |
| Basis set | 6-31G(d,p) |
| Final Energy | -26.61532364 a.u. |
| Gradient | 0.0000 a.u. |
| Dipole moment | 0.00 |
| Point Group | D3H |
| Calculation time | 0mins 11.0secs |
 Low frequencies ---   -7.0794   -7.0439   -0.0279   -0.0006    0.7084    6.6303
 Low frequencies --- 1163.0023 1213.1577 1213.1579
Bond Length of B-H calculated was 1.192Å and bond angle of H-B-H was 120.0°
As a self check the final energy calculated should be the same for BH3 calculated in the optimisation analysis as only a frequency analysis was performed to ensure the stationary point found was a minimum. The first row of low frequencies are within ±15cm-1 with the second row of low frequencies being positive. This points towards a completed and converged optimisation to find the lowest point of energy for the configuration of the molecule submitted.
The first row of low frequencies have 6 numbers, these are the frequencies that we discount within the formula '3N-6' for a non linear molecule to find the number of vibrational frequencies as they are motions of the centre of mass of the molecule and should be significantly smaller than the second row of low frequencies which they are. The closer these 6 low frequency numbers are the better the method employed in the calculation.
The following table summaries the modes of vibrations calculated using the software, please click on images to see animation of vibrational modes.
| no. | Form of vibration | Description | Frequency | Intensity | Symmetry D3H point group |
|---|---|---|---|---|---|
| 1 |  |
Wagging of all 3 H atoms into the plane of symmetry σh | 1163 | 93 | A2 |
| 2 |  |
Rocking of all 3 H atoms on the plane of symmetry σh | 1213 | 14 | E' |
| 3 |  |
Scissoring of 2 H atoms on the plane of symmetry σh | 1213 | 14 | E' |
| 4 |  |
Symmetric stretching of all 3 H atoms on the plane of symmetry σh | 2582 | 0 | A'1 |
| 5 |  |
Antisymmetric stretching of 2 H atoms on the plane of symmetry σh | 2715 | 126 | E' |
| 6 |  |
Antisymmetric stretching of all 3 H atoms on the plane of symmetry σh | 2716 | 126 | E' |

Even though the calculation shows 6 different vibrational modes whereas opening the calculated IR spectrum only 3 peaks are evident is because only 5 out of the 6 stretches are IR active, within these 5 stretches there are two sets of degenerate stretches as shown in the table above summarising the stretches. This means only 3 distinct peaks can be seen in the spectrum. Vibration mode 4 has 0 intensity and therefore is the inactive stretch. Vibration mode 2 and 3 are one degenerate set and vibration mode 5 and 6 are the other degenerate set of vibrations. The intensity of vibrational mode 5 and 6 are much more intense than the other ones as 5 and 6 are stretching the actual bond causing a greater change in dipole moment of the bond whereas the other stretch are distorting the bonds out of plane making the change is dipole moment less varied.
TlBr3
The same procedure as above for BH3 of calculating the frequency analysis was performed on the optimised TlBr3 molecule and submitted to the departmental cluster computers yielding the following Tlbr3 molecule and calculations.
The calculation file performed on the cluster computers can be found here DOI:10042/21654
Item               Value     Threshold  Converged?
 Maximum Force            0.000000     0.000015     YES
 RMS     Force            0.000000     0.000010     YES
 Maximum Displacement     0.000000     0.000060     YES
 RMS     Displacement     0.000000     0.000040     YES
 Predicted change in Energy=-4.037767D-16
 Optimization completed.
    -- Stationary point found.
| File type | .log |
| Calculation type | FREQ |
| Method | DFT/B3LYP |
| Basis set | LANL2DZ |
| Final Energy | -91.21813024 a.u. |
| Gradient | 0.0000 a.u. |
| Dipole moment | 0.00 |
| Point Group | D3H |
| Calculation time | 0mins 31.2secs |
Low frequencies ---   -0.0012   -0.0006    0.0000    1.8732    2.6583    2.6583
 Low frequencies ---   46.6999   46.7000   51.9500
The lowest "real" normal mode of vibration is at 46.70cm-1
Bong Length of Br-Tl calculated was 2.65Å with Br-Tl-Br bond angles of 120.0°.
Again both rows of low frequencies satisfies the specification to ensure optimisation was performed correctly. The table below summarises the different modes of vibration found within the molecule.
| no. | Form of vibration | Description | Frequency | Intensity | Symmetry D3H point group |
|---|---|---|---|---|---|
| 1 |  |
Scissoring of 2 Br atoms in the plane of symmetry σh | 47 | 4 | E' |
| 2 |  |
Scissoring of all 3 Br atoms in the plane of symmetry σh | 47 | 4 | E' |
| 3 |  |
Symmetric wagging of all 3 Br atoms with Tl atom wagging in opposite direction into the plane of symmetry σh | 52 | 6 | A2 |
| 4 |  |
Symmetric stretching of all 3 Br atoms in the plane of symmetry σh | 165 | 0 | A'1 |
| 5 |  |
Symmetric stretching of 2 Br atoms with 1 Br stretching out of phase to the other two Br atoms in the plane of symmetry σh | 211 | 25 | E' |
| 6 |  |
Antisymmetric stretching of 2 Br atoms and the Tl atom with the remaining Br atom seemingly stationary in the plane of symmetry σh | 211 | 25 | E' |

Like BH3 the IR spectrum of TlBr3 only shows 3 distinct peaks with the peak at 47cm-1 and 52cm-1 almost superimposing onto each other as htye are very close in wavenumber. Again the number of calculated vibrational modes is 6 but vibrational mode 4 is IR inactive and vibrational mode 1 and 2 are one degenerate set with vibrational mode 5 and 6 the other degenerate set leaving 3 distinct peaks to be seen in the spectrum.
Comparison of vibrational frequencies of BH3 and TlBr3
| Vibrational mode no. | BH3 | TlBr3 | ||
| Frequency/cm-1 | Intensity | Frequency/cm-1 | Intensity | |
| 1 | 1163 | 93 | 47 | 4 |
| 2 | 1213 | 14 | 47 | 4 |
| 3 | 1213 | 14 | 52 | 6 |
| 4 | 2582 | 0 | 165 | 0 |
| 5 | 2715 | 126 | 211 | 25 |
| 6 | 2116 | 126 | 211 | 25 |
The most obvious difference between the vibrational modes of the two molecules is the frequency at which the vibrations occur. Higher wavenumber corresponds to greater energy required to vibrate the bond and therefore equates to stronger bond. This is shown through the following Plank's equation: (where is the Planck's constant and the frequency) where the frequency can be further deconstructed to: where is the spring constant of the bond, is the speed of light and is the centre of mass of system).
This would suggest the B-H bond is stronger than the Tl-Br which us conclusion from the optimisation analysis. This again can be explained through the energy mismatch of the orbitals as stated before. The intensity of the vibrational modes of BH3 are in general relatively high compared to TlBr3 which would suggest the change in dipole for the stretches associated with the borane molecule is greater than for TlBr3.
For both spectra as already stated they both have 3 distinct peaks even though the number of modes of vibration calculated should be 6 for both molecules using the 3N-6 equation. This was addressed individually in each frequency analysis for the molecules. An interesting aspect for both spectra is that there are two 'sets' of modes of vibration lying fairly close to each other in wavenumbers with symmetry labels (A2 and E') for one of the set with the other set at higher energy with symmetry labels (A'1 and E'). The set of modes at the lower energy are the rocking, wagging and scissoring bending modes whereas the set of modes at the higher energy are stretching modes of vibration. Stretching causes a greater change in dipole moment of the bond than bending resulting in higher wavenumber of vibrations and more energy to expand and contract the length of the bonds to overcome the attraction and repulsion of the electrons and nuclei. A interesting thing to take note of is the swapping of modes of the symetry label between bration modes 1-3 for ammonia compared to borane.
Molecular Orbitals (MO) of BH3
The original optimised file for BH3 using the basis set 6-31G(d,p) and B3LYP method was used to calculate the energy and therefore the molecular orbitals of the molecule. The energy of the optimised molecule was determined using the software set to "energy" and in additional keywords "pop=full" was inserted to switch on MO analysis and under NBO tab "Full NBO" was selected. From the calculations we can qualitatively view the occupied molecular orbitals and the lowest unoccupied molecular orbital (LUMO). These calculated orbitals can be corresponded to molecular orbitals derived from the linear combination of atomic orbital (LCAO) theory from constructing a molecular orbital diagram by combining boron's 1s, 2s and 2p atomic orbitals and H3 fragment molecular orbitals.
File:MO DIAGRAM BH3 SL2010.pdf
The calculations were submitted to the departmental cluster computers which can be found here DOI:10042/21971 . From comparing the theoretical MOs from the LCAO method and the MOs calculated using the software we can see they are in good agreement with one and another qualitatively. This shows the incredible power and usefulness of using GaussView and in general computational chemistry to view the HOMO and LUMO of molecules rather than having to construct molecular orbital diagrams every time.
The MO calculated are only really accurate for the occupied orbitals and the LUMO, above the LUMO the orbitals gets more diffused.
NH3
Optimisation method: B3LYP/DFT with the basis set: 6-31G(d,p) was used to determine the stationary point of the molecule followed by a frequency analysis calculation to ensure the stationary point found was a minimum yielding the following NH3 molecule with the calculations found here
Item               Value     Threshold  Converged?
 Maximum Force            0.000024     0.000450     YES
 RMS     Force            0.000012     0.000300     YES
 Maximum Displacement     0.000079     0.001800     YES
 RMS     Displacement     0.000053     0.001200     YES
 Predicted change in Energy=-1.629727D-09
 Optimization completed.
    -- Stationary point found.
| File type | .log |
| Calculation type | FOPT |
| Method | DFT/B3LYP |
| Basis set | 6-31G (d,p) |
| Final Energy | -56.55776856 a.u. |
| Gradient | 0.0000 a.u. |
| Dipole moment | 1.85 Debye |
| Point Group | C1 |
| Calculation time | 0mins 33.0secs |
The low frequencies obtained are within ±15cm-1 so are acceptable with the actual wavenumbers being positive and optimisation converged showing the stationary point found is indeed a minimum, calculations found here.
 Low frequencies ---   -9.3372   -8.1982   -6.2791   -0.0008   -0.0008   -0.0003
 Low frequencies --- 1089.3347 1693.9209 1693.9246
 Item               Value     Threshold  Converged?
 Maximum Force            0.000021     0.000450     YES
 RMS     Force            0.000009     0.000300     YES
 Maximum Displacement     0.000077     0.001800     YES
 RMS     Displacement     0.000039     0.001200     YES
 Predicted change in Energy=-1.592773D-09
 Optimization completed.
    -- Stationary point found.
 GradGradGradGradGradGradGradGradGradGradGradGradGradGradGradGradGradGrad
Bond Length of N-H calculated was 1.02Å and H-N-H bond angle of 105.7°
| no. | Form of vibration | Description | Frequency | Intensity | Symmetry C3V point group |
|---|---|---|---|---|---|
| 1 |  |
Wagging of all 3 H atoms parallel to σv plane of symmetry | 1089 | 145 | A2 |
| 2 |  |
Mixture of scissoring and rocking of all 3 H atoms with one H atom rocking parallel to σv plane of symmetry and the other two H atoms scissoring perpendicular σv | 1694 | 14 | E' |
| 3 |  |
Mixture of scissoring and rocking of all 3 H atoms in same σv plane | 1694 | 14 | E' |
| 4 |  |
Symmetric stretching of all 3 H atoms | 3461 | 1 | A'1 |
| 5 |  |
Antisymmetric stretching of 2 H atoms | 3590 | 0 | E' |
| 6 |  |
Antisymmetric stretching of all 3 H atoms | 35890 | 0.2698 | E' |

A population/energy analysis was performed on the optimised NH3 molecule with additional keywords section including "pop=full" to turn on MO analysis. Using the .LOG obtained from this calculation natural bond order (NBO) analysis was performed in order to find the charge distribution of the molecule. The charge range is from -1.125(red) to 1.125 (green). As expected the nitrogen is highly negatively charge AT -1.125 whereas the hydrogen are positively charged AT 0.375.
Summary of Natural Population Analysis:

                                       Natural Population
                Natural  -----------------------------------------------
    Atom  No    Charge         Core      Valence    Rydberg      Total
 -----------------------------------------------------------------------
      N    1   -1.12514      1.99982     6.11103    0.01429     8.12514
      H    2    0.37505      0.00000     0.62250    0.00246     0.62495
      H    3    0.37505      0.00000     0.62250    0.00246     0.62495
      H    4    0.37505      0.00000     0.62250    0.00246     0.62495
 =======================================================================
   * Total *    0.00000      1.99982     7.97852    0.02166    10.00000
NBO analysis can also show more detail about the bonds within the molecule such as how much of the bond is contributed by the nitrogen and what hybidisation the bond formed is. This is summarised in the table below. As expected again the nitrogen contributes the the N-H bond a lot more that hydrogen (68.83%) and the bonds formed are 24.86% s-characted and 75.05% p-character therefore the bonds are sp3 hydridised which is in agreement with VSEPR model.
| Bond | Co-efficient | Hydridisation |
| N(1)-H(2) | 68.8/31.2 | s(24.7%), p(75.1%), sp3 |
| N(1)-H(3) | 68.8/31.2 | s(24.9%), p(75.1%), sp3 |
| N(1)-H(4) | 68.8/31.2 | s(24.9%), p(75.1%), sp3 |
| LP | n/a | s(25.4%), p(75.5%) sp3 |
Delving deeper into the .LOG file the occupancy and energy of N-H bonds and the nitrogen lone pair. The 1s orbital of nitrogen is very low in energy (-14.1677a.u.) relative to all the other molecular unit which explains why we do not mix the 1s orbital when constructing an MO diagram.
 Natural Bond Orbitals (Summary):

                                                           Principal Delocalizations
           NBO                        Occupancy    Energy   (geminal,vicinal,remote)
 ====================================================================================
 Molecular unit  1  (H3N)
     1. BD (   1) N   1 - H   2          1.99909    -0.60417
     2. BD (   1) N   1 - H   3          1.99909    -0.60417
     3. BD (   1) N   1 - H   4          1.99909    -0.60417
     4. CR (   1) N   1                  1.99982   -14.16767
     5. LP (   1) N   1                  1.99721    -0.31757  16(v),20(v),24(v),17(v)
Reaction Energies (Ammonia-Borane)
The importance of computational chemistry can be seen in its ability in calculating reaction energies and therefore the release of energy from breaking or making of bonds. Ammonia Borane is of interest in hydrogen fuel chemistry due to it's stability at room temperature and it's high hydrogen content. Therefore in this investigation we will be determining the reaction energy and hence the energy of the dative N-B bond in this molecule employing the same optimisation and frequency analysis on NH3BH3 using method : B3LYP/DFT and basis set: 6-31G(d,p)
The following NH3BH3 molecule with calculations found here.
 Item               Value     Threshold  Converged?
 Maximum Force            0.000137     0.000450     YES
 RMS     Force            0.000063     0.000300     YES
 Maximum Displacement     0.000606     0.001800     YES
 RMS     Displacement     0.000336     0.001200     YES
 Predicted change in Energy=-1.994004D-07
 Optimization completed.
    -- Stationary point found.
| File type | .log |
| Calculation type | FREQ |
| Method | DFT/B3LYP |
| Basis set | 6-31G(d,p) |
| Final Energy | -83.22468918 a.u. |
| Gradient | 0.0001 a.u. |
| Dipole moment | 5.57 Debye |
| Point Group | C1 |
| Calculation time | 1mins 14.0secs |
The following .LOG file shows that the stationary point found is indeed a minimum with the low frequencies calculated within ±15cm-1 and all the frequencies of vibrations found to be positive.
 Low frequencies ---   -5.4884   -1.8868   -0.0018   -0.0017   -0.0008    2.1420
 Low frequencies ---  263.3788  632.8926  638.3986

| no. | Frequency | Intensity | no. | Frequency | Intensity |
|---|---|---|---|---|---|
| 1 | 263 | 0 | 10 | 1329 | 114 |
| 2 | 633 | 14 | 11 | 1676 | 28 |
| 3 | 638 | 4 | 12 | 1676 | 28 |
| 4 | 638 | 4 | 13 | 2472 | 67 |
| 5 | 1069 | 41 | 14 | 2532 | 231 |
| 6 | 1069 | 41 | 15 | 2532 | 231 |
| 7 | 1196 | 109 | 16 | 3464 | 3 |
| 8 | 1204 | 3 | 17 | 3581 | 28 |
| 9 | 1204 | 3 | 18 | 3581 | 28 |
Using the 3N-6 formula where N=8 we obtain 18 modes of vibration which is what Gaussian has calculated. Out of the 18 modes of vibration 17 are active and within these 17 modes of vibration there are 6 sets of degenerate vibrations leaving 11 distinct peaks to be found which is what the generated spectrum looks like given mode 2 and 3 are very close in wavenumber and mode 7,8 and 9 being very close so zooming into the spectrum is required to distinguish the two peaks. The actual range of frequency of vibration is very broad showing a range of bond strengths throughout the ammonia borane molecule.
Relative energies can only be calculated and compared for systems with the same number and type of atoms using the same basis set and method to determine these final energies. With this in mind we can find the dissociation and association energy of ammonia-borane using the energies calculated for borane and ammonia before.
| Molecule | Energy/a.u. | Energy/kJmol-1 |
|---|---|---|
| BH3 | -26.61532252 | -69880 |
| NH3 | -56.55776856 | -148490 |
| BH3NH3 | -83.22468918 | -218510 |
ΔE=E(BH3NH3)-[E(BH3)+E(NH3)]= -0.0515918a.u. = -135.5kJmol-1
The literature bond dissociation for B-N is stated as 119.2kJmol-1[3]
Aromaticity
In this experiment computational chemistry will be carried out on benzene and its analogues with the C-H units replaced by isoelectronic fragments containing main group elements. Benzene, boratabenzene, pyridinium and borazine will be studied in detail with comparisons made on the optimisation, frequency and natural bonding orbitals calculations. In order to compare the calculations the same method and basis set will be used for the calculation which will be DFT/3BLYP using basis set 6-31G(d,p).
Benzene
Optimisation and Frequency analysis
A joint optimisation and frequency analysis were performed using tight convergence and with additional keywords "integral=grid=ultrafine" inserted into the calculation to ensure acceptable limits of the calculations were enforced.
This yielded the following benzene molecule with the calculations found here. DOI:10042/21743

Item               Value     Threshold  Converged?
 Maximum Force            0.000013     0.000015     YES
 RMS     Force            0.000004     0.000010     YES
 Maximum Displacement     0.000054     0.000060     YES
 RMS     Displacement     0.000017     0.000040     YES
 Predicted change in Energy=-1.959700D-09
 Optimization completed.
    -- Stationary point found.
| File type | .log |
| Calculation type | FREQ+OPT |
| Method | DFT/B3LYP |
| Basis set | 6-31G(d,p) |
| Final Energy | -232.25820415 a.u. |
| Gradient | 0.0000 a.u. |
| Dipole moment | 0 Debye |
| Point Group | C1 |
| Calculation time | 9mins 4.2secs |
Low frequencies ---   -4.7115   -0.0010   -0.0009    0.0004    5.2724    6.2070
 Low frequencies ---  414.5308  414.5721  621.0881
The calculated first row low frequencies are within ±15cm-1 with the second row frequencies all positive showing the stationary point found for the optimisation is in fact a minimum and therefore not a transition state. However from theory the point group symmetry label for benzene is known to be D6H however the symmetry point group yielded for benzene is C1. Again the limitations of the software can be seen here even though the calculated bond lengths and bond angles summarised below should lead to the desired point group.
| Bond | Bond Length/Å | Bond Angle | Angle/° | Bond | Bond Length/Å |
|---|---|---|---|---|---|
| C(1)-C(6) | 1.40 | C(2)-C(1)-C(6) | 120 | C(6)-H(12) | 1.09 |
| C(6)-C(5) | 1.40 | C(1)-C(6)-C(5) | 120 | C(5)-H(11) | 1.09 |
| C(5)-C(4) | 1.40 | C(6)-C(5)-C(4) | 120 | C(4)-H(10) | 1.09 |
| C(4)-C(3) | 1.40 | C(5)-C(4)-C(3) | 120 | C(3)-H(9) | 1.09 |
| C(3)-C(2) | 1.40 | C(4)-C(3)-C(2) | 120 | C(2)-H(8) | 1.09 |
| C(2)-C(1) | 1.40 | C(3)-C(2)-C(1) | 120 | C(1)-H(7) | 1.09 |
The calculated bond lengths of C-C is between a single C-C bond (1.52Å [4]) and a double C=C bond (1.30Å [5]) showing that the bonds are neither completely a single or double bond which leads the idea of aromaticity and delocalisation of the electron density above and below the π ring of benzene which will be discussed in more detail in the NBO analysis.

| no. | Frequency | Intensity | no. | Frequency | Intensity | no. | Frequency | Intensity |
|---|---|---|---|---|---|---|---|---|
| 1 | 415 | 0 | 11 | 1013 | 0 | 21 | 1524 | 7 |
| 2 | 415 | 0 | 12 | 1018 | 0 | 22 | 1524 | 7 |
| 3 | 621 | 0 | 13 | 1020 | 0 | 23 | 1653 | 0 |
| 4 | 621 | 0 | 14 | 1066 | 3 | 24 | 1653 | 0 |
| 5 | 695 | 74 | 15 | 1066 | 3 | 25 | 3172 | 0 |
| 6 | 718 | 0 | 16 | 1180 | 0 | 26 | 3181 | 0 |
| 7 | 865 | 0 | 17 | 1203 | 0 | 27 | 3181 | 0 |
| 8 | 865 | 0 | 18 | 1203 | 0 | 28 | 3197 | 47 |
| 9 | 975 | 0 | 19 | 1356 | 0 | 29 | 3197 | 47 |
| 10 | 975 | 0 | 20 | 1381 | 0 | 30 | 3208 | 0 |
There are 30 calculated stretching mode vibrations but obviously not all of them are viewed in the spectrum of it would be rather busy. Instead only 4 peaks are found in the spectrum. This corresponds with a lot of the stretches being IR inactive (those with 0 intensity) and 3 sets of degenerate vibrational modes therefore leaving 4 distinct peaks to be seen in the spectrum. The high symmetry of the molecule can be accounted towards some of the degeneracy found here.
NBO analysis
Using NBO analysis we can determine the charge distribution of the molecule and see how this affects the dipole moment of the molecule. The calculated dipole moment of benzene was 0 Debye and this corresponds to the charge distribution of the molecule with it's symmetry and therefore cancelling any of the polarisation of the C-H bonds in all directions resulting in molecule without a permanent dipole. The NBO calculations can be found here DOI:10042/21745 .

The individual charge distribution of each atom within benzene is summarised below.
                                       Natural Population
                Natural  -----------------------------------------------
    Atom  No    Charge         Core      Valence    Rydberg      Total
 -----------------------------------------------------------------------
      C    1   -0.23857      1.99910     4.22616    0.01331     6.23857
      C    2   -0.23860      1.99910     4.22618    0.01331     6.23860
      C    3   -0.23860      1.99910     4.22618    0.01331     6.23860
      C    4   -0.23857      1.99910     4.22616    0.01331     6.23857
      C    5   -0.23860      1.99910     4.22618    0.01331     6.23860
      C    6   -0.23860      1.99910     4.22618    0.01331     6.23860
      H    7    0.23858      0.00000     0.75998    0.00144     0.76142
      H    8    0.23859      0.00000     0.75997    0.00144     0.76141
      H    9    0.23859      0.00000     0.75997    0.00143     0.76141
      H   10    0.23858      0.00000     0.75998    0.00144     0.76142
      H   11    0.23859      0.00000     0.75997    0.00144     0.76141
      H   12    0.23859      0.00000     0.75997    0.00143     0.76141
 =======================================================================
   * Total *    0.00000     11.99462    29.91691    0.08847    42.00000

Carbon(2.5) is more electronegative than hydrogen(2.1) but only slightly according to Pauling's scale [6]. The electron density is localised to the ring system resulting in the charge density distributed so that carbon is more negative than hydrogen.
| Bond | Co-efficient | Hydridisation |
| C-C | 50.0/50.0 | s(35.2%), p(64.8%), sp2 |
| C-H | 62.0/38.0 | s(29.6%), p(70.4%), sp2 |
As expected from geometry and VSEPR model the carbon in benzene is sp2 hybridised having more p like character with the remaining p-orbital involved in the delocalisation of electrons to form the aromatic rings.
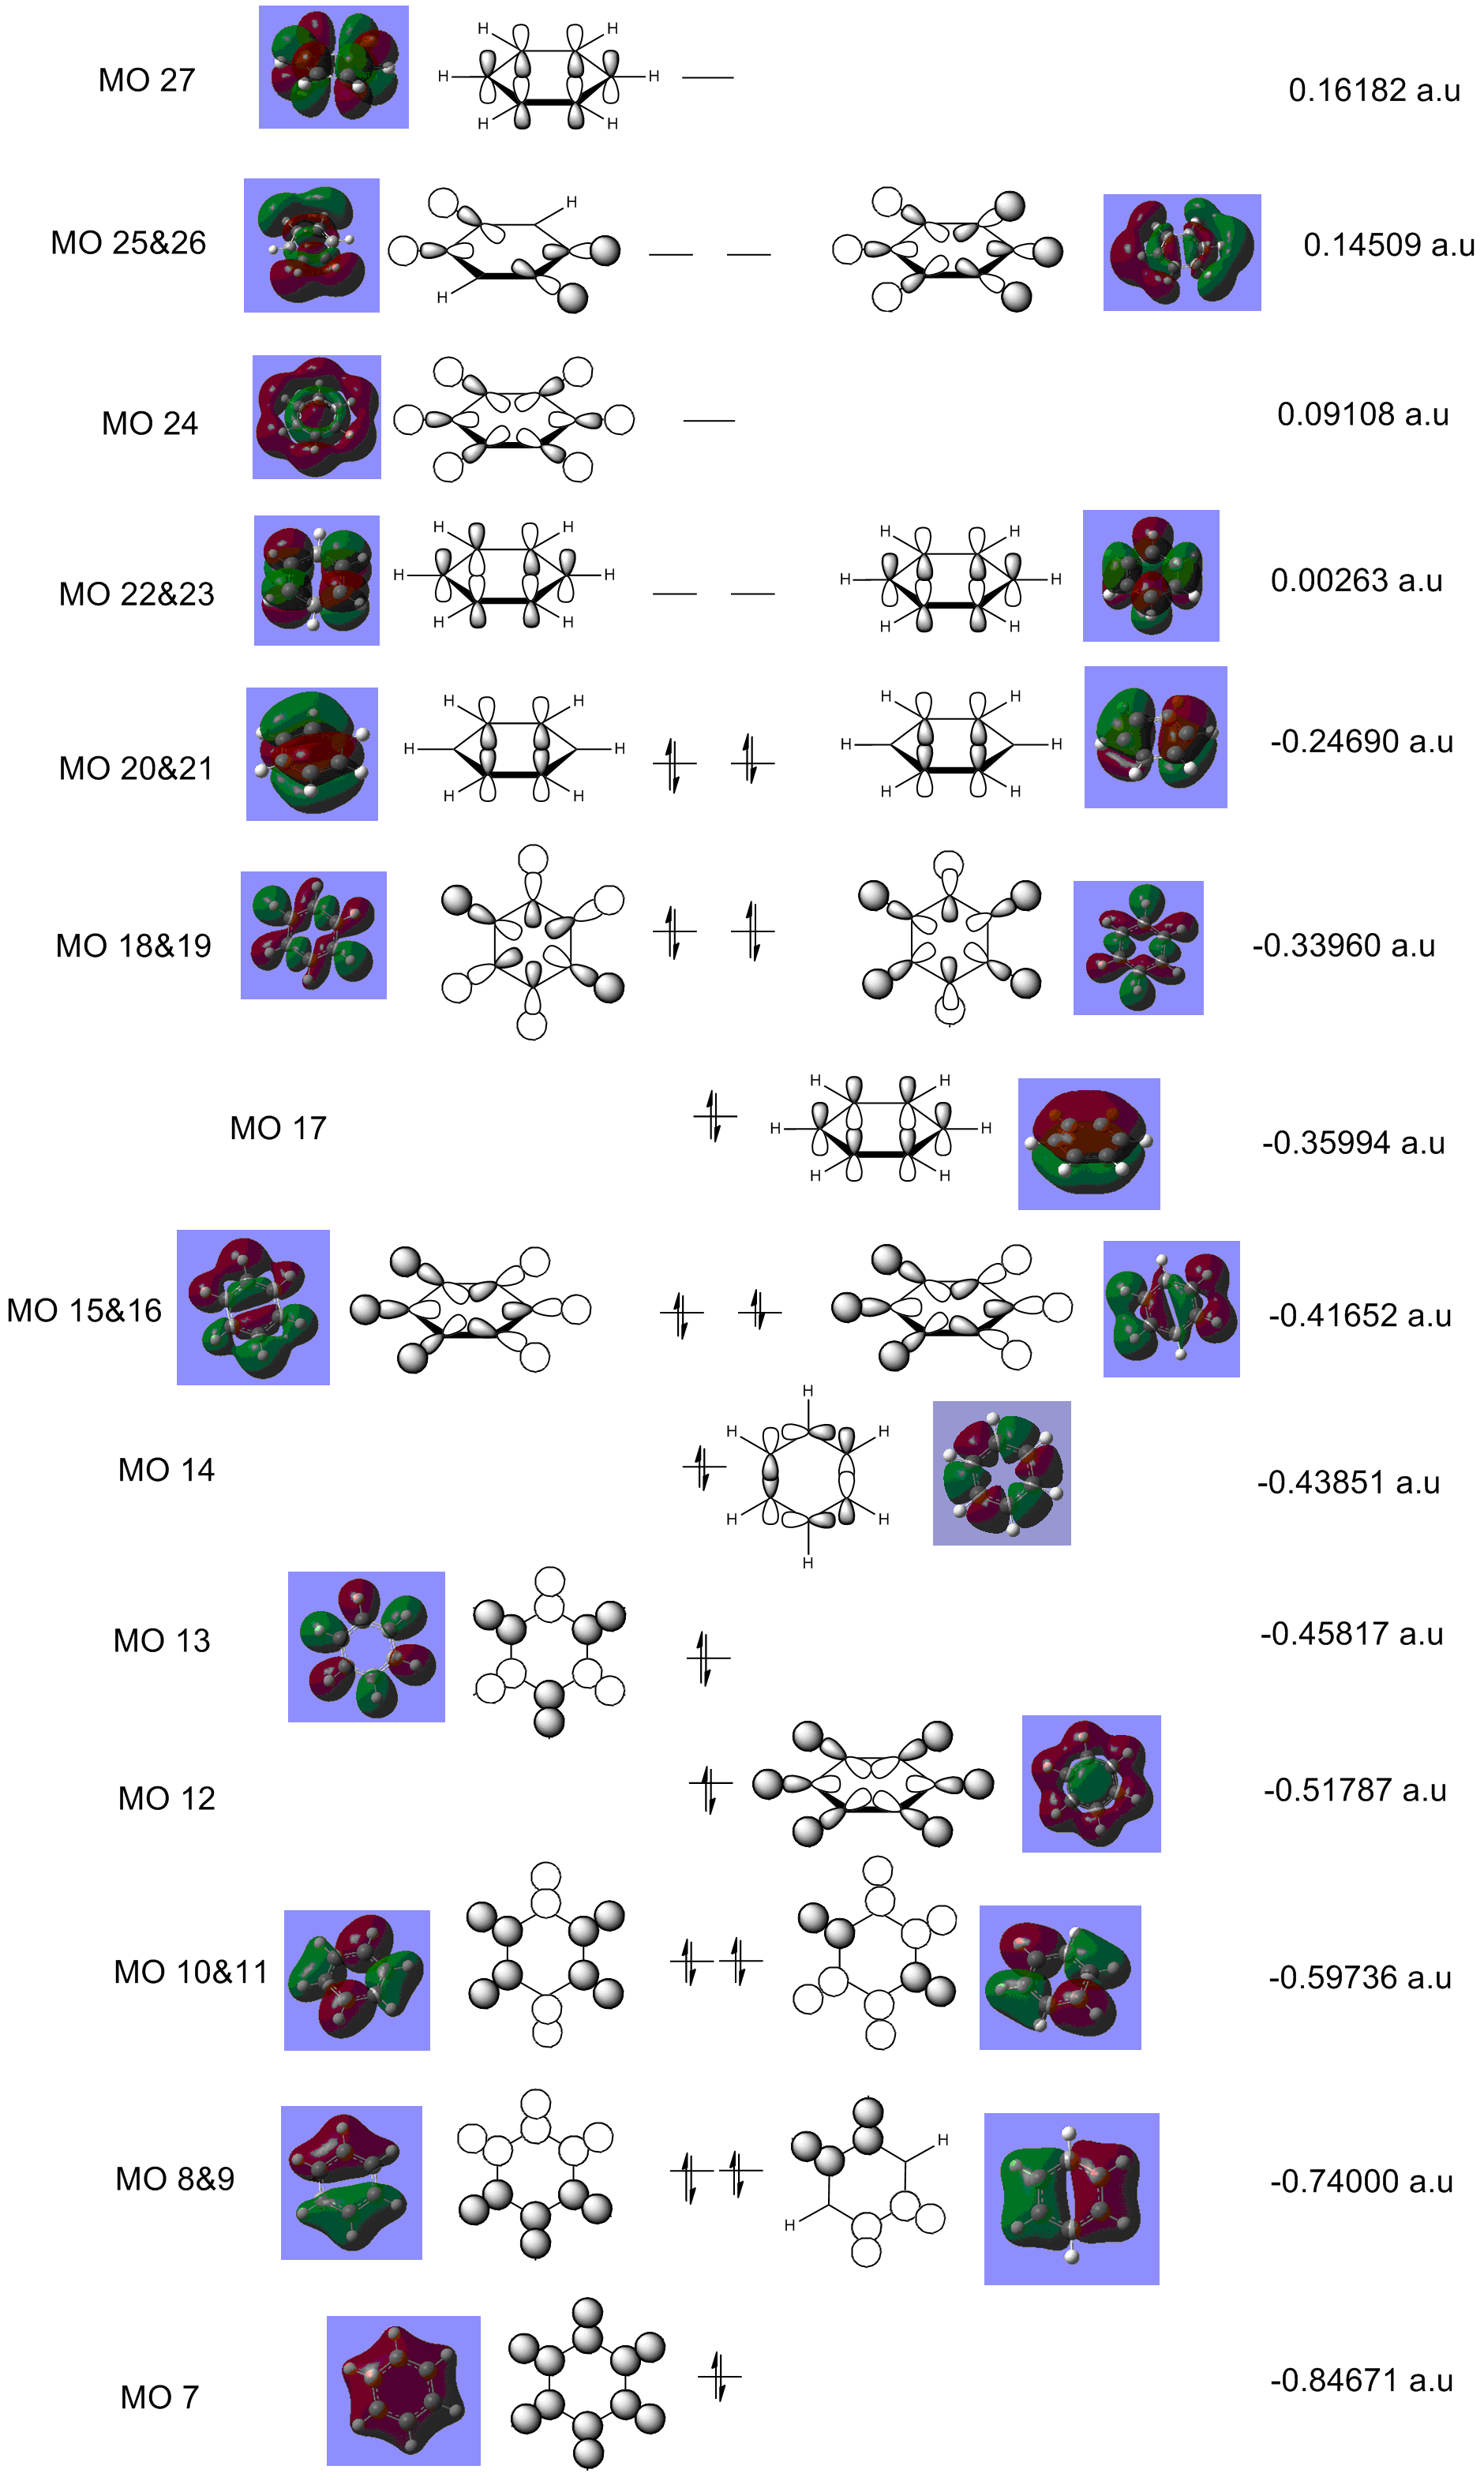
The MO diagram of benzene illustrates the complexity of the aromaticity of the molecule. We are use to seeing the 6 aromatic bonding and anti-bonding π-orbitals of benzene however this more 'complete' analysis into the core and sigma molecular orbitals gives a better picture towards the interactions of benzene and why it is so stable as a structure and preferring not to have any more electrons which will end up in the π* anti-bonding orbital (HOMO) which would de-stabilise the molecule. The sigma bonding framework of the benzene molecule is formed from interactions of LCAO of sp2 hybridised carbons. The remaining p-orbital on carbon atom is orthogonal to this framework and this planar arrangement leads to the aromaticity of benzene.

The most interesting molecular orbitals of the MO diagram constructed of benzene is when the π bonding orbitals begin with the aromaticity viewed in a qualitatively manner in the diagram above. The molecular orbitals boxed in red are the 3 π bonding orbitals and the other 3 molecular orbitals boxed in green are the π* anti-bonding orbitals. There are 6 electrons in the π orbitals thus satisfying the aromaticity rule of Hückel's formula 4n+2 where n=1 in this case. 6 electrons are available to occupy the 6 π MOs specifically and therefore choose the lowest energy configuration leaving the 3 π* vacant. But between the π occupied orbitals there's a set of occupied degenerate sigma molecular orbitals which we normally ignore when looking at the molecular orbital diagram of benzene. This is because when we think about aromaticity we are just interested in the π orbitals as the electrons are delocalised throughout the occupied 3 π orbitals forming resonance stability.

Boratabenzene
Optimisation and Frequency analysis
Using the same method as for benzene the same calculations were formed for boratabenzene yielding the following molecule with the calculations found here DOI:10042/21746 .

 Item               Value     Threshold  Converged?
 Maximum Force            0.000010     0.000015     YES
 RMS     Force            0.000002     0.000010     YES
 Maximum Displacement     0.000045     0.000060     YES
 RMS     Displacement     0.000013     0.000040     YES
 Predicted change in Energy=-6.760769D-10
 Optimization completed.
    -- Stationary point found.
| File type | .log |
| Calculation type | FREQ+OPT |
| Method | DFT/B3LYP |
| Basis set | 6-31G(d,p) |
| Charge | -1 |
| Final Energy | -219.02052299 a.u. |
| Gradient | 0.0000 a.u. |
| Dipole moment | 2.85 Debye |
| Point Group | C1 |
| Calculation time | 8mins 47.5secs |
Low frequencies ---   -7.2699   -0.0005    0.0008    0.0008    3.1438    4.5253
 Low frequencies ---  371.2962  404.4161  565.0825
Again the first row of low frequencies are within ±15cm-1 with the second row low frequencies all positive showing the optimisation was converged with the stationary point found being a minimum.
| Bond | Bond Length/Å | Bond Angle | Angle/° | Bond | Bond Length/Å |
|---|---|---|---|---|---|
| C(1)-C(5) | 1.40 | C(2)-C(1)-C(5) | 122.2 | C(1)-H(5) | 1.10 |
| C(5)-B(12) | 1.51 | C(1)-C(5)-B(12) | 120.1 | C(5)-H(11) | 1.10 |
| B(12)-C(4) | 1.51 | C(5)-B(12)-C(4) | 115.1 | B(12)-H(10) | 1.22 |
| C(4)-C(3) | 1.40 | B(12)-C(4)-C(3) | 120.1 | C(4)-H(9) | 1.10 |
| C(3)-C(2) | 1.40 | C(4)-C(3)-C(2) | 122.2 | C(3)-H(8) | 1.10 |
| C(2)-C(1) | 1.40 | C(3)-C(2)-C(1) | 120.4 | C(2)-H(7) | 1.09 |

| no. | Frequency | Intensity | no. | Frequency | Intensity | no. | Frequency | Intensity |
|---|---|---|---|---|---|---|---|---|
| 1 | 371 | 2 | 11 | 917 | 1 | 21 | 1449 | 9 |
| 2 | 404 | 0 | 12 | 951 | 0 | 22 | 1463 | 14 |
| 3 | 565 | 0 | 13 | 951 | 0 | 23 | 1565 | 7 |
| 4 | 568 | 0 | 14 | 960 | 2 | 24 | 1592 | 40 |
| 5 | 608 | 11 | 15 | 1012 | 4 | 25 | 2447 | 368 |
| 6 | 711 | 3 | 16 | 1085 | 3 | 26 | 3027 | 108 |
| 7 | 756 | 7 | 17 | 1175 | 1 | 27 | 3030 | 0 |
| 8 | 815 | 0 | 18 | 1180 | 1 | 28 | 3060 | 380 |
| 9 | 873 | 28 | 19 | 1227 | 1 | 29 | 3061 | 10 |
| 10 | 906 | 0 | 20 | 1333 | 31 | 30 | 3116 | 112 |
The IR spectrum for boratabenzene has a lot more peaks than benzene and this is shown by the number of active vibrational stretches with the lack of degenerate stretches that is evident in benzene. This could be attributed to the dipole of the molecule breaking symmetry and leading to fine vibronic coupling but also a reduction in symmetry from benzene(D3H) to boratabenzene(C2v). This will be examined in NBO analysis in more detail. The actual frequency of stretches are very similar and this is in agreement with the C-C bond length of boratabenzene being same (to 2d.p) in length with benzene with only the B-C bond lengths being longer. This is attributed to the energy mismatch of boron and carbon leading to poorer overlap of orbitals and thus weaker bonds. Even though there are a lot more peaks they are very small in intensity showing the modes of vibration that correlate to the low intensity peaks are a result of a small change in dipole moment of the bond stretches and bending. There are 30 stretches calculated and this like benzene is in confirmation with the 3N-6 rule where N=12 to find the number of vibrational modes of a molecule.
NBO analysis
Again the same method used for benzene was employed on the now optimised boratabenzene molecule. The calculations for NBO analysis can be found here DOI:10042/21747 . The charge distribution of the molecule can be summarised below.

Summary of Natural Population Analysis:

                                       Natural Population
                Natural  -----------------------------------------------
    Atom  No    Charge         Core      Valence    Rydberg      Total
 -----------------------------------------------------------------------
      C    1   -0.25033      1.99910     4.23710    0.01413     6.25033
      C    2   -0.34002      1.99907     4.32711    0.01384     6.34002
      C    3   -0.25032      1.99910     4.23709    0.01413     6.25032
      C    4   -0.58804      1.99901     4.57725    0.01178     6.58804
      C    5   -0.58803      1.99901     4.57724    0.01178     6.58803
      H    6    0.17899      0.00000     0.81839    0.00263     0.82101
      H    7    0.18574      0.00000     0.81227    0.00199     0.81426
      H    8    0.17899      0.00000     0.81839    0.00263     0.82101
      H    9    0.18385      0.00000     0.81397    0.00218     0.81615
      H   10   -0.09649      0.00000     1.09595    0.00054     1.09649
      H   11    0.18385      0.00000     0.81397    0.00218     0.81615
      B   12    0.20182      1.99906     2.78752    0.01160     4.79818
 =======================================================================
   * Total *   -1.00000     11.99436    29.91623    0.08941    42.00000
| Bond | Co-efficient | Hydridisation |
| C-C | 50.0/50.0 | s(35.5%), p(64.4%), sp2 |
| C-H | 59.3/40.7 | s(26.9%), p(73.1%), sp2 |
| C-B | 66.7/33.3 | s(42.0%), p(48.0%), sp |
| C-B | 33.3/66.7 | s(33.4%), p(66.5%), sp2 |
| B-H | 44.9/55.1 | s(33.2%), p(66.8%), sp2 |
Boratabenzene shows a greater spread of charge distribution across the whole molecule relative to benzene. Carbon (2.5) is more electronegative than both hydrogen(2.1) and boron(2.0), according to Pauling's scale, resulting in the greater electron density to be found localised within the carbon backbone with the most negative carbons found ortho to the boron as it is able to solely compete for boron's electron density. An interesting aspect to notice is that because hydrogen is slightly more electronegative than boron there is a slight polarisation of the B-H bond with boron being more electro-positive than hydrogen, this also helped by the carbon removing electron density from boron resulting in this charge distribution.
Again the sigma framework of the molecule is constructed through the linear combination of the sp2 hybridised carbon and boron atoms. Boratabenzene is isoelectronic with benzene with the extra negative charge placed in the empty boron p-orbital; this allows the molecule to be aromatic by satisfying the requirements of the π-orbitals being orthogonal to the framework with the electron cloud formed being planar and of course satisfying Hückel's rule 4n+2. Looking at the MOs that make up boratabenzene one of the most striking observation is the general higher energy of the molecular orbitals when comparing directly the 'same' MO with benzene i.e. MO no.7 of benzene compared to MO no.7 of boratabenzene. Carbon is more electronegative than boron and therefore the atomic orbitals of boron are higher in energy than the atomic orbitals for carbon so the fragments used for linear combination to form boratabenzene were already higher in energy than the fragments used to construct benzene. The HOMO-LUMO gap for boratabenzene is smaller than for benzene though which is in agreement with the resonance energy of benzene being more stable as more energy will have to be inputted to destroy the aromatic configuration of benzene relative to boratabenzene. This means chemically boratabenzene is more susceptible to reactions.
Pyridinium
Optimisation and Frequency analysis
Using the same method (B3LYP/DFT) and basis set(6-31G (d,p)) for analysing benzene, pyridinium was optimised resulting in the following molecule with the calculations found here DOI:10042/21752 .

Item               Value     Threshold  Converged?
 Maximum Force            0.000004     0.000015     YES
 RMS     Force            0.000001     0.000010     YES
 Maximum Displacement     0.000012     0.000060     YES
 RMS     Displacement     0.000004     0.000040     YES
 Predicted change in Energy=-9.825303D-11
 Optimization completed.
    -- Stationary point found.
| File type | .log |
| Calculation type | FREQ+OPT |
| Method | DFT/B3LYP |
| Basis set | 6-31G(d,p) |
| Charge | +1 |
| Final Energy | -248.66806092 a.u. |
| Gradient | 0.0000 a.u. |
| Dipole moment | 1.87 Debye |
| Point Group | C1 |
| Calculation time | 8mins 47.3secs |
Low frequencies ---   -9.3859   -2.9588   -0.0006   -0.0003    0.0001    0.8760
 Low frequencies ---  391.9002  404.3427  620.1995
The first row of low frequencies are within ±15cm-1 with the second row of low frequencies being positive and therefore optimisation was completed correctly with the stationary point found a minimum.
| Bond | Bond Length/Å | Bond Angle | Angle/° | Bond | Bond Length/Å |
|---|---|---|---|---|---|
| C(1)-C(5) | 1.38 | C(2)-C(1)-C(5) | 119.1 | C(1)-H(5) | 1.08 |
| C(5)-N(12) | 1.35 | C(1)-C(5)-N(12) | 119.2 | C(5)-H(11) | 1.08 |
| N(12)-C(4) | 1.35 | C(5)-N(12)-C(4) | 123.3 | N(12)-H(10) | 1.02 |
| C(4)-C(3) | 1.38 | N(12)-C(4)-C(3) | 119.3 | C(4)-H(9) | 1.08 |
| C(3)-C(2) | 1.40 | C(4)-C(3)-C(2) | 119.1 | C(3)-H(8) | 1.08 |
| C(2)-C(1) | 1.40 | C(3)-C(2)-C(1) | 120.1 | C(2)-H(7) | 1.09 |

| no. | Frequency | Intensity | no. | Frequency | Intensity | no. | Frequency | Intensity |
|---|---|---|---|---|---|---|---|---|
| 1 | 392 | 1 | 11 | 1022 | 4 | 21 | 1524 | 21 |
| 2 | 404 | 0 | 12 | 1048 | 0 | 22 | 1580 | 48 |
| 3 | 620 | 0 | 13 | 1052 | 0 | 23 | 1657 | 32 |
| 4 | 645 | 0 | 14 | 1082 | 3 | 24 | 1676 | 34 |
| 5 | 677 | 90 | 15 | 1087 | 4 | 25 | 3223 | 0 |
| 6 | 748 | 82 | 16 | 1200 | 3 | 26 | 3240 | 1 |
| 7 | 854 | 11 | 17 | 1229 | 2 | 27 | 3242 | 11 |
| 8 | 883 | 0 | 18 | 1300 | 3 | 28 | 3252 | 20 |
| 9 | 992 | 2 | 19 | 1374 | 11 | 29 | 3254 | 0 |
| 10 | 1006 | 0 | 20 | 1416 | 3 | 30 | 3570 | 158 |
The IR spectrum for pyridinium has a lot more peaks than benzene and once again this is due to more IR active stretches and fewer degenerate vibration modes possibly due to vibrational coupling with the break down of the Born-Oppenheimer approximation thus reducing symmetry within the molecule and this is indicative by the weak intensity of a lot of the peaks observed in the spectrum. The actual symmetry point group label for pyridinium (C2V) is 'lower' than for benzene (D3H) anyways. Once again like boratabenzene and benzene, 30 modes of vibration are calculated which is in agreement with theory from the 3N-6 rule where N=12 and once again the actual frequency where these vibrations occur is similar to the ones found for benzene as only one carbon in the framework is substituted by a nitrogen atom and therefore the strength of C-C bond in pyridinium is very similar to that for benzene. This is in agreement to the determined bond length of the C-C bond in pyridinium being similar to the C-C bond length in benzene. The C-N bond is much shorter relative to the other C-C bond in pyridinium and this can be accounted towards a stronger bond as nitrogen is electron deficient having the positive charge so draws in the electron density from the adjacent carbon making the bond more double-like in nature and therefore stronger. The difference in bond lengths within the framework can explain the disfigured bond angles inside the hexagonal framework from 120° seen in benzene.
NBO analysis
The same method for NBO analysis on benzene was employed on the pyridinium cation. The calculations can be found here DOI:10042/21756 . The charge distribution of the molecule is summarised below:

Summary of Natural Population Analysis:

                                       Natural Population
                Natural  -----------------------------------------------
    Atom  No    Charge         Core      Valence    Rydberg      Total
 -----------------------------------------------------------------------
      C    1   -0.24106      1.99912     4.22862    0.01331     6.24106
      C    2   -0.12241      1.99913     4.10941    0.01386     6.12241
      C    3   -0.24106      1.99912     4.22862    0.01331     6.24106
      C    4    0.07102      1.99918     3.91065    0.01916     5.92898
      C    5    0.07102      1.99918     3.91065    0.01916     5.92898
      H    6    0.29720      0.00000     0.70177    0.00103     0.70280
      H    7    0.29169      0.00000     0.70718    0.00113     0.70831
      H    8    0.29720      0.00000     0.70177    0.00103     0.70280
      H    9    0.28493      0.00000     0.71397    0.00110     0.71507
      H   10    0.48278      0.00000     0.51476    0.00246     0.51722
      H   11    0.28493      0.00000     0.71397    0.00110     0.71507
      N   12   -0.47623      1.99937     5.46757    0.00929     7.47623
 =======================================================================
   * Total *    1.00000     11.99510    29.90895    0.09595    42.00000
| Bond | Co-efficient | Hydridisation |
| C-C | 50.3/49.7 | s(34.7%), p(65.2%), sp2 |
| C-H | 64.8/35.2 | s(31.8%), p(68.2%), sp2 |
| C-N | 36.7/63.3 | s(28.1%), p(71.7%), sp2 |
| C-N | 63.3/36.7 | s(36.6%), p(63.4%), sp2 |
| N-H | 74.6/25.4 | s(26.8%), p(73.2%), sp2 |
Pyridinium shows a greater spread of charge distribution across the whole molecule relative to benzene. The nitrogen (3.0) is more electronegative than both carbon(2.5) and hydrogen(2.1) resulting in the greater electron density to be found localised within the nitrogen atom with the most negative carbons found meta to the nitrogen then the para with the ortho carbon least negative out of them all as they are closest to the electron withdrawing nitrogen thus polarising the N-C bond with a slight negative charge on nitrogen. A consequence the high electronegativity of nitrogen is also the polarising of N-H bond making this hydrogen more acidic and labile to abstraction relative to all the other hydrogens around the framework. The unequal distribution of charge when compared to benzene seems that delocalisation of the electron density within the π cloud for pyridinium is less homogenous making pyridinium more likely to react which is in agreement with the fact pyridinium has a dipole moment but benzene doesn't.
The sigma framework of pyridinium is constructed by the linear combination of the sp2 hybridised carbon and nitrogen atoms. Pyridinium is isoelectronic with benzene with the extra positive charge placed on nitrogen; this allows the molecule to be aromatic by satisfying the requirements of the π-orbitals being orthogonal to the framework with the electron cloud formed being planar and satisfying Hückel's rule 4n+2. Looking at the MOs that make up pyridinium one cannot miss the observation that generally pyridinium has lower energies for the molecular orbitals when comparing directly the 'same' MO with benzene i.e. MO no.7 of benzene compared to MO no.7 of pyridinium. This is because the nitrogen is more electronegative than carbon as stated and therefore it's atomic orbitals is lower in energy than carbon's atomic orbitals resulting in overall the linear combination of fragment orbitals which are lower in energy from the beginning. However like boratabenzene the HOMO-LUMO gap for pyridinium is smaller than for benzene. This means less energy is required to disturb the aromatic nature of pyridinium thus making it more susceptible to reactions.
Borazine
Optimisation and Frequency analysis
Using the same method(B3LYP/DFT) and basis set(6-31G (d,p)) as for benzene, the same calculations were formed for borazine yielding the following molecule with the calculations found here DOI:10042/22059 .

Item               Value     Threshold  Converged?
 Maximum Force            0.000004     0.000015     YES
 RMS     Force            0.000001     0.000010     YES
 Maximum Displacement     0.000026     0.000060     YES
 RMS     Displacement     0.000008     0.000040     YES
 Predicted change in Energy=-2.232286D-10
 Optimization completed.
    -- Stationary point found.
| File type | .log |
| Calculation type | FREQ+OPT |
| Method | DFT/B3LYP |
| Basis set | 6-31G(d,p) |
| Charge | 0 |
| Final Energy | -242.68460015 a.u. |
| Gradient | 0.0000 a.u. |
| Dipole moment | 0 Debye |
| Point Group | C1 |
| Calculation time | 12mins 24.7secs |
Low frequencies ---   -4.7146   -0.0002    0.0007    0.0009    3.8989    8.1090
 Low frequencies ---  289.6300  289.8091  404.5034
The first row of low frequencies are within ±15cm-1 with the second row of low frequencies being positive and therefore optimisation was completed correctly with the stationary point found a minimum.
| Bond | Bond Length/Å | Bond Angle | Angle/° | Bond | Bond Length/Å |
|---|---|---|---|---|---|
| N(7)-B(12) | 1.43 | B(10)-N(7)-B(12) | 122.9 | N(7)-H(1) | 1.01 |
| B(12)-N(9) | 1.43 | N(7)-B(12)-N(9) | 117.1 | B(12)-H(6) | 1.20 |
| N(9)-B(11) | 1.43 | B(12)-N(9)-B(11) | 122.9 | N(9)-H(5) | 1.01 |
| B(11)-N(8) | 1.43 | N(9)-B(11)-N(8) | 117.1 | B(11)-H(4) | 1.20 |
| N(8)-B(10) | 1.43 | B(11)-N(8)-B(10) | 122.9 | N(8)-H(3) | 1.01 |
| B(10)-N(7) | 1.43 | N(8)-B(10)-N(7) | 117.1 | B(10)-H(2) | 1.20 |

| no. | Frequency | Intensity | no. | Frequency | Intensity | no. | Frequency | Intensity |
|---|---|---|---|---|---|---|---|---|
| 1 | 290 | 0 | 11 | 928 | 0 | 21 | 1400 | 11 |
| 2 | 290 | 0 | 12 | 937 | 236 | 22 | 1400 | 11 |
| 3 | 405 | 24 | 13 | 945 | 0 | 23 | 1493 | 494 |
| 4 | 525 | 1 | 14 | 945 | 0 | 24 | 1493 | 494 |
| 5 | 525 | 1 | 15 | 945 | 0 | 25 | 2640 | 284 |
| 6 | 710 | 0 | 16 | 1052 | 0 | 26 | 2640 | 284 |
| 7 | 710 | 0 | 17 | 1081 | 0 | 27 | 2650 | 0 |
| 8 | 732 | 60 | 18 | 1081 | 0 | 28 | 3642 | 0 |
| 9 | 865 | 0 | 19 | 1246 | 0 | 29 | 3644 | 40 |
| 10 | 928 | 0 | 20 | 1314 | 0 | 30 | 3644 | 40 |
The IR spectrum for borazine has more peaks than benzene but significantly less than pyridinium and boratabenzene as the point group symmetry of borazine is D3H which is the same point group for benzene. Symmetry is once again very high with more symmetry operators found in this molecule than pyridinium and boratabenzene. This is in agreement with the bond lengths of B-N being the same throughout the hexagonal framework. There are 10 degenerate sets of vibrational modes like benzene as well however out of the 10 sets 5 are IR active compared to 3 sets for benzene leaving in total 8 distinct peaks to be seen in the spectrum. There is a wider range of frequencies of vibration for borazine compared to benzene with some found at lower wavenumbers (290cm-1 Vs 415cm-1 corresponding to lower energy and subsequently weaker bonds but also some found at higher wavenumbers (3644cm-1 Vs 3208cm-1 suggesting stronger bonds. This could be explained by the vast differences in electronegativities between the element making up borazine with the N-H bond being a lot more polarised than B-H bond. This will be analysed in more detail in NBO analysis but like all the other molecules compared so far there are 30 modes of vibrations calculated using the formula 3N-6 where N=12.
NBO analysis
The same method for NBO analysis on benzene was employed on the borazine molecule. The calculations can be found here DOI:10042/22060 . The charge distribution of the molecule is summarised below:

Summary of Natural Population Analysis:

                                       Natural Population
                Natural  -----------------------------------------------
    Atom  No    Charge         Core      Valence    Rydberg      Total
 -----------------------------------------------------------------------
      H    1    0.43201      0.00000     0.56571    0.00228     0.56799
      H    2   -0.07654      0.00000     1.07585    0.00069     1.07654
      H    3    0.43201      0.00000     0.56571    0.00228     0.56799
      H    4   -0.07654      0.00000     1.07585    0.00069     1.07654
      H    5    0.43200      0.00000     0.56572    0.00228     0.56800
      H    6   -0.07653      0.00000     1.07584    0.00069     1.07653
      N    7   -1.10242      1.99943     6.09821    0.00478     8.10242
      N    8   -1.10241      1.99943     6.09820    0.00478     8.10241
      N    9   -1.10240      1.99943     6.09819    0.00478     8.10240
      B   10    0.74695      1.99917     2.23867    0.01521     4.25305
      B   11    0.74694      1.99917     2.23868    0.01521     4.25306
      B   12    0.74692      1.99917     2.23869    0.01521     4.25308
 =======================================================================
   * Total *    0.00000     11.99579    29.93530    0.06890    42.00000
| Bond | Co-efficient | Hydridisation |
| B-H | 54.0/46.0 | s(37.5%), p(62.5%), sp2 |
| N-H | 71.9/28.1 | s(22.8%), p(77.2%), sp3 |
| N-B | 76.5/23.5 | s(38.6%), p(61.4%), sp2 |
| B-N | 23.5/76.5 | s(31.3%), p(68.5%), sp2 |
Borazine shows a greater spread of charge distribution across the whole molecule relative to benzene. Nitrogen(3.0) is more electronegative than both hydrogen(2.1) and boron(2.0), according to Pauling's scale, resulting in the greater electron density to be found localised on the nitrogen within the hexagonal framework. The N-H, B-H and N-H bonds are polarised with the respective element in each bond with the greater electronegativity holding more of the electron density within the bond. The hydrogens attached to the nitrogen are more acidic relative to the ones attached to the boron. However due to the symmetry of borazine the charge densities are cancelled out leaving a dipole moment of 0.0 Debye.
Again the sigma framework of the molecule is constructed through the linear combination of the sp2 hybridised nitrogen and boron atoms. However looking deeper into the hybridisation its actually quite hard to definitely draw the line at either sp2 or sp3 hybridisation for the boron and nitrogen showing intermidiates between the two hybridisations instead which is in agreement with the different resonance structures one can draw for borazine like for benzene leading to the N-B bonds being somewhere between a single and double bond. Borazine is isoelectronic and isostructural with benzene and therefore the molecule is aromatic by satisfying the requirements of the π-orbitals being orthogonal to the framework with the electron cloud formed being planar and of course satisfying Hückel's rule 4n+2. Looking at the MOs that make up borazine we can compare directly the 'same' MO with benzene i.e. MO no.7 of benzene compared to MO no.7 of borazine. The energy difference between the respective MOs aren't that different with borazine with borazine and benzene swapping which respective MOs are lower in energy e.g. the core orbitals (MO 1-3) calculated borazine as having the lower energy MOs which is accounted to electronegativity of the nitrogen being high and therefore its atomic orbitals being lower in energy than carbon. However the going towards higher MO is becomes difficult to explain the random flipping of benzene or borazine MO energies being higher than the other. What we can gauge is that the energies are similar which isn't surprising why borazine is known as the inorganic benzene.
The HOMO-LUMO gap of borazine is greater than benzene which has been the opposite case for pyridinium and boratabenzene which shows the incredibly stability of the aromatic nature of borazine. This would suggest more energy is required to be inputted into borazine in order to disrupt the aromatic system. However due to the high polarisation of the N-B bond borazine is more susceptible to attacks by both nucleophiles and electrophiless depending on the reaction site. This is incredibly different to the reactions undertaken by benzene with it mainly being aromatic electrophillic substitution and therefore even though calculations of Gaussian show the HOMO-LUMO gap for borazine is larger than for benzene, borazine is more reactive due to the permanent dipole localised within each N-B bonds but overall the molecule has no dipole moment.
Comparison of aromatic compounds
Charge density
The main investigation was to compare the aromaticity between the 4 molecules with benzene being the reference molecule for which comparison will be made on. The difference in charge density across the molecules is a good indication towards reactivity and stability of the molecules. All charge densities were calculated using NBO analysis with the full spectrum of densities seen in each molecule's respective section on the wikipage.
| Atom | Benzene | Boratabenzene | Pyridinium | Borazine |
|---|---|---|---|---|
 |
 |
 |

| |
| Carbon | -0.239 | -0.588, -0.340, -0.250 | -0.241, -0.122, 0.071 | n/a |
| Hydrogen | 0.239 | -0.096, 0.179, 0.184 | 0.285, 0.292, 0.297, 0.483 | -0.077, 0.432 |
| Nitrogen | n/a | n/a | -0.476 | -1.10 |
| Boron | n/a | 0.202 | n/a | 0.747 |
The reactivity of a molecule is definitely related to the charge density of a molecule with a polarised bond more likely to react than an un-polarised bond. From literature we know borazine is highly reactive which is unusual for an aromatic compound as it undergoes nucleophillic and electrophillic attack readily which releases the aromaticity of the compound. This is explained by its highly polarised bond with nitrogen having a slightly negative charge and boron having a slightly positive charge on its atoms. With boratabenzene and pyridinium the substitution of a carbon for a boron and nitrogen respectively causes a dipole moment to be incurred on the molecule which again allows these molecules to undergo reactions more readily than benzene. Comparing pyridinium to boratabenzene the former molecule has a more varied charge distribution across its molecules with greater ranges of charge densities due to the greater difference in electronegativity of nitrogen to the point where there are 4 different hydrogen charge density compared to boratazene's 3 different charge densities for hydrogen.
MO comparison
Once again using NBO analysis 3 different occupied MOs were chosen to compare between the molecules to see how the charge density has affected the molecular orbitals formed from Gaussian. The MO analysis is performed in detail for benzene alone but the main idea of the sigma hexagonal framework being similar for all molecules as stated in each sections with the HOMO-LUMO gap addressed individually.
| Benzene | Boratabenzene | Pyridinium | Borazine |
|---|---|---|---|
 |
 |
 |

|
| MO 17 | |||
| -0.35994 | -0.13210 | -0.64062 | -0.36134 |
 |
 |
 |

|
| MO 18 | |||
| -0.33960 | -0.09169 | -0.57739 | -0.31991 |
 |
 |
 |

|
| MO 20 | |||
| -0.24690 | -0.03493 | -0.50847 | -0.27594 |
MO 17
Benzene as stated will be the reference molecule for analysis. The molecular orbital 17 is the first π bonding orbital for each of the molecule so is of great interest to compare. The distribution of the electron cloud above and below the plane of the carbon framework is very equal and homogenous which is in agreement with the high symmetry of benzene as well as the electronegative difference between carbon and hydrogen. With boratabenzene the electron cloud is distorted symmetrically through the mirror plane parallel to the principal axis of the molecule. More of the electron density is localised around the carbons rather than the boron atom framework and this in agreement with boron being less electronegative that carbon so carbon can pull electron density away from boron. With pyridinium this is the exact opposite case with the electron cloud distorted symmetrically through the mirror plane parallel to the principal axis of the molecule but this time more of the electron density is found localised on the nitrogen with the carbons further out in the meta and para position of the ring being more electron deficient. Again this is in agreement with nitrogen being more electronegative than carbon so is able to pull electron density towards itself from neighboring carbon atoms. With borazine the planar distribution of the electron density is much more uniform with the high symmetry found in benzene also evident in borazine. The difference however is that the spacial distribution of the electron cloud is less circular than for benzene with the nitrogen atoms in the sigma framework pulling more of the electron density from the neighboring boron atoms equally from the 3 positions of nitrogen in the framework.
The similarities between these MOs is the strong bonding interactions of the π molecular orbital with just one planar node bisecting the electron density above and below the ring framework of each of the molecules depicting a phase change of the orbital.
The scale for the lowest energy for MO 17 is pyridinium < borazine < benzene < boratabenzene.
MO 18 In benzene MO 18 is degenerate with MO 19 and shows sigma bonding character not π bonding like MO 17. Between boratabenzene, borazine and benzene, the MOs in shape look very similar with pyridinium being significantly different to the other 3 molecules. Once again the electronegativty of the atom dictates the size of the orbitals with benzene the bonding and anto-bonding component looking very similar on a qualitative approach of looking at the volume the anti-bonding and bonding lobes of the molecule. For boratabenzene carbon's sp2 hybrisided orbitals are lower in energy than the sp2 hybridised boron orbitals resulting in a greater energy mismatch and more diffused orbitals formed which is evident from comparing the lobe at the boron in boratabenzene to the lobe found in the same position on benzene. With borazine the greater diffusion of the orbitals is even greater than for boratazine as all the carbon positions are substituted with two very different electronegative elements causing a greater energy match of the orbitals. With pyridnium the LCAO is different with the most similar MO of benzene being MO 14 (c.f.benzene MO diagram). This shows a change in the ordering of the MOs for pyridinium relative to benzene molecular orbital diagram and therefore we cannot compare directly MO 18 of pyridinium with Mo 18 of benzene.
There are however a number of similarities between the MOs for benzene, boratabenzene and borazine molecule with all containing 6 nodes in the molecule. The more nodes within the molecular orbitals the more anti-bonding in character the molecular orbital is. So comparing MO 18 with MO 17 for all the molecules we can use this idea to explain why MO 18 is higher in energy than MO 17. For pyridinium there are 8 nodes showing the greater anti-bonding character relative to the other 3 molecules. There is a lot of weak through space bonding and antibonding interactions for benzene, boratabenzene and borazine which is different to MO 17 having purely strong through interactions but the C/B/N-H orbitals are strong through bond bonding interactions.
As stated at the start benzene MO 18 is degenerate with MO 19 and this situation is the same with borazine but degeneracy is lost within the pyridinium and boratabenzne with MO 19 being different in energy. This can be expalined by the difference in the point group of the molecules with benzene and borazine being D3H and boratabenzene and pyridinium being C2V.
The scale for the lowest energy for MO 18 is pyridinium < benzene < borazine < boratabenzene.
MO 20 For benzene MO 20 is degenerate with MO 21 and therefore is one of the HOMO of benzene. Like MO 17 the bonding is π and is the orbital involved in the aromaticity of the molecule, the analysis for MO 20 is very similar to that of 17 with the electron cloud being shared equally between all 6 carbon atom in the framework. For boratabenzene it is non-degenerate with its MO 21 making MO 21 the HOMO instead. Due to the combination of the p-orbitals to form the π orbitals in boratabenzene is more like the arrangement seen in MO 21 of benzene howevever as MO 20 and 21 are degenerate for benzene one can compare and conclude that the arrangement and extent of delocalisation are very similar as the MO 20 for boratabenzene shows that the boron atomic orbitals doesn't affect the overall energy of the molecular orbital for that arrangement which is why the MOs look similar between boratabenzene and benzene. For pyridinium the degeneracy is also loss between MO 20 and 21(HOMO), this was explained due to the difference in point group symmetry label for boratabenzne and pyridinium compared to benzene. This time the greater electron density is found on the carbon atoms than nitrogen. This can be explained as the nitrogen donates it's lone pair into the п ring of the aromatic system. For borazine MO 20 is degenerate with MO 21 with the electron density surround the atoms unsymmetrical across the orthogonal planar node bisecting the ring with the side containing 2N and 1B holding more of the electron density. This is explained by the electronegativity of the nitrogen relative to boron so nitrogen is able to pull more of the electron density towards itself.
The similarities between the MOs of the molecule is that they contain strong bonding interactions as well as through space weak anti-bonding interactions. All the MOs also have 2 planar nodes depicting the antibonding character of this π MO being greater than the π MO 17.
The scale for the lowest energy for MO 20 is pyridinium < borazine < benzene < boratabenzene.
ENERGY OF MOs The energies of the MOs were individually addressed in each section of the molecules with comparisons made directly to benzene relating the reasoning to electronegativities of the atoms. The most interestign aspect about the energy is between borazine and benzene though as it seems with sigma orbitals benzene MOs are lower in energy but with the π orbitals borazine has lower energy MOs. For π orbitals, the p-orbitals of the boron, carbon and nitrogen are used respectively whereas in the sigma bonding the orbitals used are sp2 hybridised. Hybridisation lowers the energy of the orbitals compared to before they were mixed as the p orbitals have more s character. With benzene the C hybridisation is more stabilising with the energy match better than with the nitrogen and boron in borazine.
Final thoughts
Looking at both the HOMO-LUMO gap of these aromatic compounds as well as the charge density to explain the reactivity and stability of these compounds has been a lot more interesting and complicated than first anticipated. The complicated analysis on the benzene MO diagram alone was enough to leave one scratching their heads as well as fully appreciating that we should also look at the sigma orbitals to get a better flavour of the aromatic nature of benzene not just the π orbitals even if they do dictate the reactivity of benzene.
Nevertheless the power of using computational chemistry has been seen first hand to predict reactivity, explain trends and more importantly understand the limitations that still hold these calculations back from matching experiment to theory exactly but for sure this gap is closing.
References
- ↑ http://www.huntresearchgroup.org.uk/teaching/year3_lab_start.html, Last date accessed 23/11/12
- ↑ G. Julius and J. Georg; Acta Chemisc Scandinavica A, 1982, 36, 125-135
- ↑ G. Leroy, M. Sana and C. White; Theor Chim Acta, 1993, 85, 155-166
- ↑ M. D. Harmony; Journal of Chemical Physics, 1990, 93, 7522 DOI:10.1063/1.459380
- ↑ F.H. Allen, O. Kennard, D. G. Watson; J. Chem. Soc. Perkin Trans II, 1987, 2, s1-s19
- ↑ L. Pauling; Journal of the American Chemical Society, 1932, 54, 3570-3582 DOI:10.1021/ja01348a011