Rep:Mod:sl307
Introduction
The task of this module is to gain understanding how molecular modelling can be used to predict the final products of reactions. Using Gaussian and ChemBio3D molecules can be modeled and their energies calculated as well as bond stretching frequencies, bond lengths and angles. From this information a good understanding of the reaction happening can be gained. In this module MM2 in ChemBio3D is used to minimise the energy of the molecules.
The Hydrogenisation of Cyclopentadiene Dimer
Exo vs. Endo product
 |
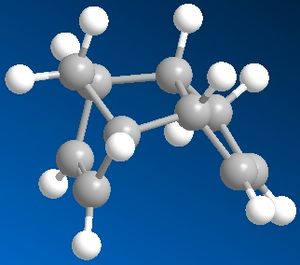 |
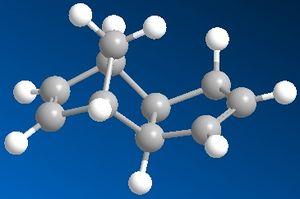
When cyclopentadiene dimerises, it can produce two products - exo or endo - depending on the relative orientation in which the dienophile attacks the diene. The exo product is the thermodynamically more preferred one, so it would be the one with the expected lower energy which is true (Energy of the exo product is 31.8830 kcal/mol). The endo product is of higher energy (Energy of the endo product is 34.0017 kcal/mol) which is due to the steric hinderance in the molecule. But we know that the endo product with the higher energy is produced, so we can deduce that the reaction is kinetically controlled.
The Hydrogenation of Cyclopentadiene
 |
 |
| Properties | Product 3 | Product 4 |
| Stretch | 1.2390 | 1.1025 |
| Bend | 18.9753 | 14.5313 |
| Torsion | 12.1099 | 12.5068 |
| Van der Waals | 5.7211 | 4.4990 |
| Hydrogen bonding | 0.1631 | 0.1407 |
| Total energy(kcal/mol) | 35.9383 | 31.1615 |
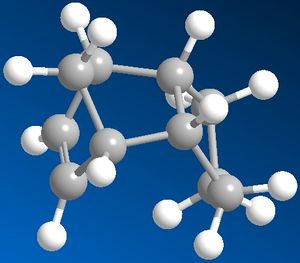
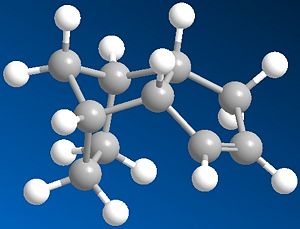
From the table on the right, it can be seen that the more stable product is Product 4 as it has a lower total energy, this makes it the thermodynamic product. Comparing the energies form the table for the 2 possible products it can be seen that the stretch energy is similar but the bend energy is much lower for Product 4 which is the main reason for the energy difference between the two products. Therefore this suggests that the 6-membered ring would be hydrgenated first and then the 5-membered ring afterwards.
Stereochemistry of Nucleophilic additions to a pyridinium ring (NAD+ analogue)
Prolinol
 |
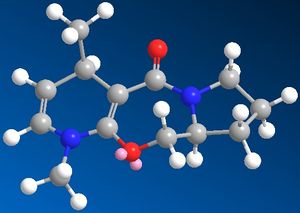 |

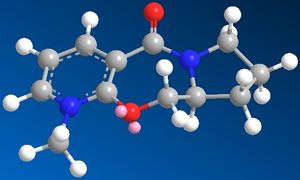
The mechanism above shows how the Grignard reagent coordinates to the proline molecule. When the Grignard reagent was put into the ChemBio3D for the minimistaion of the energy there was an error in the calculation probably due to the unrecognisition of the reagent by the program. The 7-membered ring is not very flexible and there are not many positions of the carbonyl oxygen to be, so there are not many configurations of the molecule. The oxygen can be upwards, downwards or in the plane of the rings, when MM2 was applied to these 3 possibilities, the lowest energy was the one of the oxygen being in the plane. To minimise the energy of the molecule 5, the oxygen lone pair was placed as far away as possible from the carbonyl carbon and so the energy obtained was 43.1302 kcal/mol.
The product (Molecule 6) has the total energy of 37.4819 kcal/mol and it is the lowest energy state with the carbonyl oxygen still being in the plane of the rings and the new methyl group pointing upwards and not downwards since amide carbonyl group cannot be below the pyridinium ring.
Pyridinium ring
 |
 |
 |
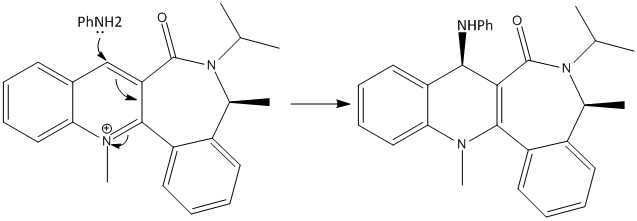
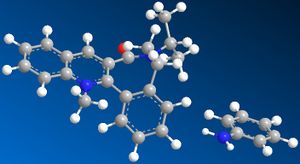
This time when the aniline was put in the ChemBio3D and the energy minimised, it worked. The energy of the pyridium ring is higher (Total energy is 63.4702 kcal/mol) than the energy of the pyridinium ring minimised together with the aniline (Total energy is 58.0063 kcal/mol). Similary to the previous example there is little felxibility because of the 6- and 7-membered rings joined together. The amide carbonyl carbon is slightly pinting downwards hence the aniline attacks from the top face as it can be seen in the molecule (above, right).
Key literature
- A. G. Shultz, L. Flood and J. P. Springer, J. Org. Chemistry, 1986, 51, 838. DOI:10.1021/jo00356a016
Stereochemistry and Reactivity of an Intermediate in the Synthesis of Taxol
 |
 |
 |
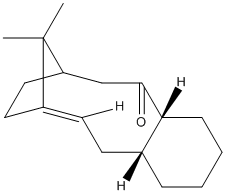 |
In the synthesis of taxol two possible products are possible i.e. with the carbonyl group pointing upwards or downwards. Minimising the energy for both of these using MM2 in ChemBio3D it can be determined that the molecule 10 has a lower energy - 44.9565 kcal/mol, wheres molecule 9 has a total energy of 54.5515 kcal/mol, hence molecule 10 is the more stable one. From the representations above it can be seen that molecule 9 has a twist-boat adaptation whereas the lower energy form (molecule 10) has a chair conformation.
MM2 is a good way of minimising the energy but not always it gives the total minimum energy of a molecule, instead it gives the local minimum energy. This is done by just moving the bonds of the molecule slightly. Hence it is necessary to inspect the molecule and see whether there are any possible strains and by moving individual atoms it should be tried to inimise the strain and after that the energy minimisation can be performed and hopefully this should give the most thermodynamic products.
Molecules such as Taxol have high stability and are called hyperstable olefins. These hyperstable olefins have negative olefin strain (OS) which adds to the olefin stability. In this case this added stability comes from the alkene double bonds located next to the bridgehead.
Key literature
- Maier, W. F.; Schleyer, P. V. R, J. Am. Chem. Soc. 1981, 103, 1891. DOI:10.1021/ja00398a003
- S. W. Elmore and L. Paquette, Tetrahedron Letters, 1991, 319; DOI:10.1016/S0040-4039(00)92617-0 10.1016/S0040-4039(00)92617-0 10.1016/S0040-4039(00)92617-0
Regioselective Addition of Dichlorocarbene
 |
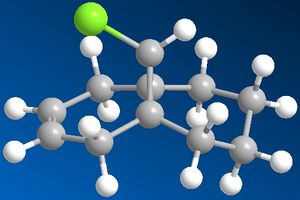 |
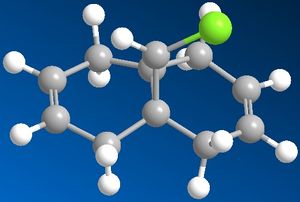
The images to the left show dichlorocarbene and its dehydrated product. To obtain this conformation of the two molecules MM2 force field was applied first to minimise the energy of the molecules and then MOPAC/PM6 method was applied to give even more accurate representation of the molecules. After applying the PM6 calculation the dichlorocarbene molecule did not change by much but in its dehydrated product the dehydrated benzene ring bent further away from the chlorine atom.
Molecular Orbitals of Dichlorocarbene
 |
 |
 |
 |
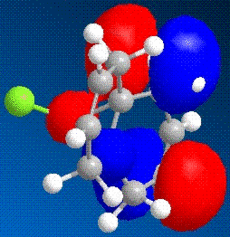 |
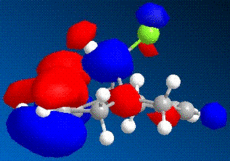
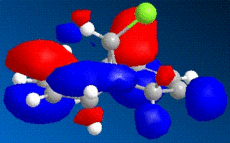
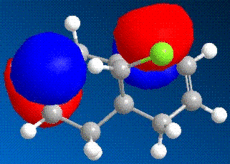
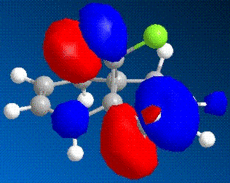
The images above show some molecular orbital of Dichlorocarbene. By looking at the LUMO of dichlorocarbene it can be seen that the electron cloud is biger around the double bond anti to the chlorine, this means that this double bond has more nucleophilic character than the endo double bond. And by looking at the HOMO we should see the opposite effect - a bigger electron cloud around the endo double bond compared to the exo double bond, but by looking at the diagram this is not seen. Instead there is a build up electron density on the exo double bond again and this could be due to errors in the calculations by the program.
Key Vibrational Frequencies
| Bond | Dichlorocarbene/cm-1 | Dehydrated dichloro./cm-1 |
| C-Cl | 770.85 | 774.98 |
| C=C(endo) | 1757.46 | 1758.06 |
| C=C(exo) | 1737.13 | N/A |
From the table on the right it can be seen that the C-Cl bond stretching frequencies are around 770-775 cm -1 (DOI:10042/to-2909
DOI:10042/to-2944 ) which is consistent with the literature values for this stretch (in the region between 500-800 cm -1). It can be seen that the carbon-chlorine bond in the dehydrated is stronger (has higher frequency) which is due to the the absence of the C=C exo bond since the C=Cπ orbital does not interact with the C-Clσ* orbital anymore. Also the dehydrated dichlorocarbene only has 1 vibrational frequency in the C=C stretch area, which is correct since it only has one C=C bond. From this it can be deduced which of the vibrational frequencies in dichlorocarbene correspond to the endo which to the exo C=C bond.
Key literature
- B. Halton, R. Boese and H. S. Rzepa., J. Chem. Soc., Perkin Trans 2, 1992, 447. DOI:10.1039/P29920000447
- A. B. Dempster., J. Molecular Spectroscopy, 1970, 35,18-26. DOI:10.1016/0022-2852(70)90160-8
Structure based Mini project using DFT-based Molecular orbital methods
Introduction

An article was found in the Journal of Organic Chemistry with the reaction scheme shown on the right. The reaction scheme involves the hydrolysis of oxazolidin-2-one into both cis- and trans-derivatives via the shown intermediates to give α-hydroxy-β-amino isopentanoic acids (2R,3S) and (2S,3S). The article also supplies the 1H NMR and 13C NMR chemical shifts and coupling constants as well as values for optical rotation. So 13C NMR values and optical rotation values will be calculated and compared with the literature values. Also an IR spectrum for both the isomers will be produced and then analysed.
MM2
The two isomers were drawn in the ChemBio3D and their energy then minimised using the MM2 force field. The energy of the (2R,3S) isomer was calculated as 3.5804 kcal/mol and the energy of the (2S,3S) isomer was found to be 3.7928 kcal/mol. From the energies it can be seen that the (2R,3S) isomer has a slightly lower energy so it would be the thermodynamic product.
13C NMR (D2O)
Isomer (2R,3S) DOI:10042/to-2951
| Carbon nr. | Calculated shift/ppm | Literature shift/ppm | Difference/ppm |
| 7 | 20.3 | 15.5 | 4.8 |
| 1 | 20.9 | 17.8 | 3.1 |
| 2 | 31.4 | 28.4 | 3.0 |
| 3 | 60.6 | 49.8 | 10.8 |
| 4 | 70.0 | 71.3 | 1.3 |
| 5 | 173.4 | 174.6 | 1.2 |

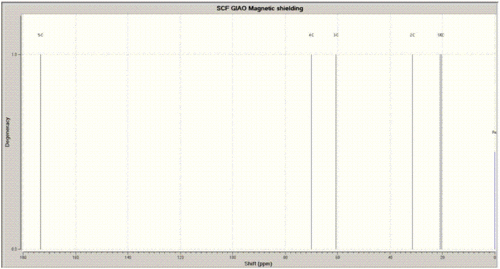
The 13C NMR (D2O) for this isomer was run using the GIAO approach and the calculated carbon shifts are presented in the table on the right and compared against the litertaure values. In the calculation the solvent was chamged to water since in the literature it was stated that the solvent is deuterated oxygen, but looking at the results in Gaussview, the literature reference is CDCl3, so the spectrum could not be compared in the solvent used to actually run the calculation.
The differences between the calculated and the reference chemical shifts are all under 5ppm difference apart from one - carbon 3, which is attached to the nitrogen atom. The difference for this carbon 3 is greater than 10 ppm which could be due to the the different solvent GIAO approaches used to produce the spectrum or maybe the program is not so accurate to calculate carbon shifts for carbons attached to nitrogens.
Isomer (2S,3S) DOI:10042/to-2952
| Carbon nr. | Calculated shift/ppm | Literature shift/ppm | Difference/ppm |
| 1 | 19.0 | 18.3 | 0.7 |
| 7 | 23.6 | 19.6 | 4.2 |
| 2 | 33.1 | 29.2 | 3.9 |
| 3 | 57.2 | 49.5 | 7.7 |
| 4 | 77.3 | 70.4 | 6.9 |
| 5 | 170.8 | 174.4 | 3.6 |


All the calculations were performed as before for the other isomer. And all the values are in a good agreenment with the literature apart from two. The reason for this would be the same as above.
From my obseravtions I can coclude that it seems the calculations are fairly close to the actual literature values and so this method could be used for predicting spectrum for other molecules as well.
IR
Isomer (2R,3S) DOI:10042/to-2956
| Bond | Stretch/cm-1 |
| N-H | 3595.92(A), 3498.95(S) |
| O-H | 3810.42(next to N), 3761.01(next to O) |
| C=O | 1850.59 |
| C-O | 1373.07 |

The IR spectrum looks quite good and the stretching freguencies are in a very good agreement with the literature values( http://www.cem.msu.edu/~reusch/VirtualText/Spectrpy/InfraRed/infrared.htm). The A and S in brackets for the N-H stretch mean symmetric and asymmetric stretches, this can be very nicely seen in Gaussview. The key stretches for this molecule were the O-H peah that should be quite broad, also the carbonyl stretch at 1837.05 cm-1.
Isomer (2R,3S) DOI:10042/to-2957
| Bond | Stretch/cm-1 |
| N-H | 3586.59(A), 3503.61(S) |
| O-H | 3819.09(next to N), 3755.67(next to O) |
| C=O | 1837.05 |
| C-O | 1381.18 |
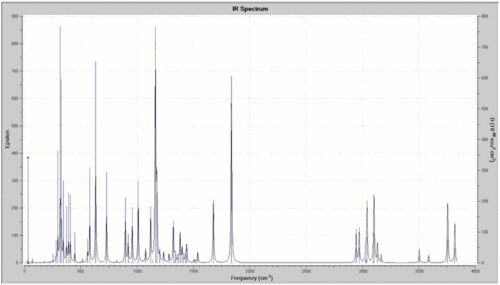
Data in a very good agreement with the literature values as before.
Key literature
- W. D. Seo, J. Curtis-Long, Y. B. Ryu, J. H. Lee, M. S. Yang, W. S. Lee and K. H. Park., J. Org. Chem., 2006, 71, 13. DOI:10.1021/jo060309m
Conclusions
From this project it can be cocluded that the computational way of predicting IR and NMR spectrum for molecules is quite accurate and in a good agreement with the literature value. Hence this could be used for predictions for new molecules to see how the data would look like before actually running the spectrum in the lab on the machines.
