
Rep:Mod:shiyingli
Shiying Li's 1C Report
Part 1
The Hydrogenation of Cyclopentadiene Dimer

In Scheme 1, the cyclopentadiene undergoes dimerization then form two possible dimers which are endo and exo conformations in room temperature. However, experimental result shows that only one of the dimers could exist, just the endo form. To figure why the endo dimer is preferred, two dimers (Molecule 1 and 2 in the scheme) were drawn using ChemDraw and their molecular geometries were optimized by Avogadro.
| Molecules | 1 (kcal/mol) | 2 (kcal/mol) | 3 (kcal/mol) | 4 (kcal/mol) | ||||||||||||
|---|---|---|---|---|---|---|---|---|---|---|---|---|---|---|---|---|
| Geometries |
|
|
|
| ||||||||||||
| Total Bond Stretching Energy | 3.54301 | 3.46745 | 3.31176 | 2.82306 | ||||||||||||
| Total Angle Bending Energy | 30.77268 | 33.19079 | 31.96288 | 24.68543 | ||||||||||||
| Total Stretch-Bending Energy | -2.04138 | -2.08217 | -2.10361 | -1.65717 | ||||||||||||
| Total Torsional Energy | -2.73105 | -2.94971 | -1.49561 | -0.37830 | ||||||||||||
| Total Out-of-Plane Bending Energy | 0.01485 | 0.02193 | 0.01298 | 0.00028 | ||||||||||||
| Total VAN DER WAALS Energy | 12.80166 | 12.353773 | 13.63776 | 10.63717 | ||||||||||||
| Total Electrostatic Energy | 13.01367 | 14.18466 | 5.11952 | 5.14702 | ||||||||||||
| Total Energy | 55.37344 | 58.19070 | 50.44568 | 41.25749 |
The energy of the conformer’s maximum was calculated using MMF94s force field and conjugate gradients algorithm. The hydrogenation of the endo form produces two different hydrogenated product that are Molecule 3 and 4. Same optimisations process was applied to molecule 3 and 4 to investigate which hydrogenation is preferred. The results were showed in Table 1. From the table shows above, molecule 4 has a lower energy than the molecule 3. If the hygenation of the dimer is under thermodynamic controlled, the double bond in the norbornene is hydrogenated faster than the double bond in the cylcopentane ring. Besides, the molecules 3 and 4 can be accounted in different energy terms. Besides the total electrostatic energy and total stretch bending energy, the molecule 4 generally has a lower value than molecule 3 in the remained energy contributions. In conclusion, the total angle bending energy and total van der Waals energy are the most contribution towards the lower stability of the molecule 4.
Introduction


Molecule 9 or 10 are the most important structure of taxol (used in chemotherapy for ovarian cancers) synthesis. They are atropisomers to each other and the main difference is the C=O bond pointing direction, one point up another point down. The energy barrier of bond rotation for these 9 and 10 intermediates enables them to be isolated separately. They both are synthesised from an oxy-Cope rearrangement and their stability was investigated by using Avogadro with the MMFF94(s) force field.
| Molecules | 9 (kcal/mol) | 10 (kcal/mol) | 9* (kcal/mol) | 10* (kcal/mol) | ||||||||||||
|---|---|---|---|---|---|---|---|---|---|---|---|---|---|---|---|---|
| Geometries |
|
|
|
| ||||||||||||
| Total Bond Stretching Energy | 7.6447 | 7.58965 | 7.29234 | 6.40661 | ||||||||||||
| Total Angle Bending Energy | 28.24946 | 18.77878 | 23.29595 |
22.30294 | ||||||||||||
| Total Stretch-Bending Energy | -0.08815 | -0.14633 | 0.15268 | 0.29349 | ||||||||||||
| Total Torsional Energy | 0.33774 | 0.19473 | 10.71749 | 9.27344 | ||||||||||||
| Total Out-of-Plane Bending Energy | 0.97957 | 0.84700 | 0.13196 | 0.03641 | ||||||||||||
| Total VAN DER WAALS Energy | 33.12333 | 33.25936 | 34.24838 |
31.23140 | ||||||||||||
| Total Electrostatic Energy | 0.30327 | -0.04868 | 0.00000 |
0.00000 | ||||||||||||
| Total Energy | 70.54924 | 60.55231 | 75.83879 |
69.54428 |
| molecule 9 | molecule 9 | molecule 9 | molecule 10 | molecule 10 | molecule 10 | |
|---|---|---|---|---|---|---|
| Structure | Another Chair form | Slightly twisted boat form | Optimised form but with trans H pointing down | Another Chair form | Slightly twisted boat form | Optimised form but with trans H pointing down |
| Total Energy (kcal/mol) | 82.66844 | 88.45541 | 77.64221 | 75.02369 | 66.36975 | 61.05214 |
Results and Discussions
For 9 and 10 molecules, the position of the H in trans alkene and the cyclohexane ring are main factor affect the minimising the energy of the structure. Chair form is he most stable conformation of the cyclohexane ring is and the boat form is the second stable conformation. For the molecule 9 and 10, the cyclohexane ring owns three different conformations two in chair forms and 1 slightly twisted boat form. The result shows the lowest energy structure of the intermediate contains chair conformation in the cyclohexane ring .The Hydrogen in trans alkene form can either pointing up or down in the plane of the 11-member ring. However, it need to point up to get lowest energy for both molecules. After the optimisation, results shows molecule 10 is more stable (9.98 kcal / mol lower in energy). In conclusion, the stereochemistry of the product is more dependent on the structure of molecule 10 rather than molecule 9.
Different from most of the bridgehead olefin being unstable due to large olefin strain, the double bond for both intermediate would react slowly, for example. in hydrogenation. This inertness is due to the fact that the bridgehead double bond is part of a large polycyclic system[1]. From calculation shows above, the intermediate molecule have a lower total energy than their corresponding parent hydrocarbons, so a lower strain is related to their structures so they become more stable. This stability causes the molecules become unusually less reactive.
Part 1:Spectroscopic Simulation using Quantum Mechanics
Introduction

The molecules 17 and 18 are the derivative of molecules 9 and 10 , besides they are atropisomers due to formation from the oxyanionic Cope process. Refer to the method used before , MMFF94s mechanics forces field in the Avogadro program was calculated in the first step of the optimisation of molecules 17 and 18.
Results and Discussions
It’s 1H and 13C NMR spectra were created by using the Gaussian and HPC calculations (using Theory: B3LYP, Basis: 6-31G(d,p), Solvation model: SCRF(CPCM, Solvent = chloroform), Frequency and NMR as key word and Empirical Dispersion : GD3 ). The resulted NMR data was presented in the table below; which compared to the literature values by plotting them in the same graph in excel.For both 1H and 13C NMR spectra, the graphs showed that the literature value and the calculated values were quiet similar apart from small deviations. In the 13 C NMR, presented a better match and this is due to all 20 carbon signals were clearly showed in the literature, no assumption use in the 1H data. So the literature values are correctly interpreted and assigned. Those small deviations might from the sensitivity and precision of NMR instrument that used in the literature and the one accounted in the calculation, heavy atom effect of the two sulfur atom, besides the environment effect during the measurement. In the 1H NMR data, the peaks were quite similar in the chemical shift from 3.5 - 5ppm, besides it observed deviation at lower chemical shift value below 3.5 ppm region. The literature showed a multiplet of 14H in the chemical shift range of 1.35-2.80, it was meant that the 14H are equally distributed in the chemical shift range in the graph plotted by excel. However, it is known that this assumption cannot reflect the exact picture of the multiplet, and then results the deviation.Molecule 17 was chosen to discuss later.
| Calculated Data for 1H | Calculated Data for 13C |
|---|---|
Shift (ppm) Degeneracy Atoms
       5.4439822349         1.0000  25
       3.2892695297         2.0000  50,39
       3.1496592391         3.0000  51,53,52
       2.7409210163         1.0000  28
       2.5683745590         1.0000  31
       2.4851652536         1.0000  19
       2.3705014206         2.0000  26,30
       2.2695721945         4.0000  41,32,29,36
       1.9557286479         2.0000  40,42
       1.8107191580         2.0000  44,45
       1.6044369622         3.0000  43,27,33
       1.2636806013         1.0000  47
       1.1967315790         1.0000  48
       1.1097025805         2.0000  49,46
       0.8380095085         4.0000  35,34,38,37
|
Shift (ppm) Degeneracy Atoms
     216.8932607019         1.0000  10
     151.7542056168         1.0000  6
     117.1461064746         1.0000  3
      88.7324043974         1.0000  15
      57.0696825355         1.0000  14
      56.4946034132         1.0000  13
      54.7593650872         1.0000  5
      52.0535966940         1.0000  7
      48.4854448109         1.0000  4
      45.1643921682         1.0000  22
      43.6549221877         1.0000  23
      40.4318873597         1.0000  16
      34.4801060018         1.0000  12
      34.1462414903         1.0000  18
      33.8871317620         1.0000  1
      27.2445457944         1.0000  2
      27.0908804922         1.0000  8
      21.9122917539         1.0000  20
      21.7727797741         1.0000  17
      19.0713888197         1.0000  9
|
| Calculated Data for 1H | Calculated Data for 13C |
|---|---|
| 1H NMR (300 MHz, CDCl3) ppm
4.84 (dd, J = 7.2,4.7 Hz, 1 H) ,3.40-3.10 (m ,4H), 2.99 ( dd, J = 6.8, 5.2 Hz, 1 H), 2.80-1.35 (series of m, 14 H), 1.38 (s, 3 H), 1.25 (s, 3 H), 1.10 (s, 3 H), 1.00-0.80 (m, 1 H) |
13C NMR (75 MHz, CDCL3) ppm
218.79, 144.63, 125.33, 72.88, 56.19, 52.52,48.50, 46.80, 45.76, 39.80,38.81, 35.85, 32.66, 28.79, 28.29, 26.88, 25.66, 23.86, 20.96, 18.71 |
| Compare Data for 1H | Compare Data for 13C |
|---|---|
 |
 |
Besides, the HPC calculation enabled vibrational analysis of the molecule 17 and 18 to be reported. The Gibbs free energy (∆G) were came from the entropy and zero-point-energy correction, presents in the table 9. Molecule 18 has a more negative value of the free energy than molecule 17, so it indicates that molecule 18 is the prefer conformation to be formed upon synthesis. Combining the fact that molecule 18 was found out to be the lower energy conformation, molecule 18 is the most thermodynamically stable conformation and transformation from molecule 17 to molecule 18 would work. In order for the transformation to happen, energy input (e.g. reflux) is required for the rearrangement of structure, would observe the sigma-bond rotations and changing the carbonyl oxygen to point down[2]. Despite of a lower energy is attained in this conformation, the methyl which alpha position to the carbonyl was need to be closer to the methyl group in the bridgehead from 0.571nm to 0.385 nm.
| Hartree/Particle | Molecule 17 DOI:10042/28018 | Molecule 18 DOI:10042/28021 |
|---|---|---|
| Zero-point correction | 0.467240 | 0.467562 |
| Thermal correction to Energy | 0.489298 | 0.489349 |
| Thermal correction to Enthalpy | 0.490242 | 0.490293 |
| Thermal correction to Gibbs Free Energy | 0.418299 | 0.420041 |
| Sum of electronic and zero-point Energies(E0 = Elec + ZPE) | -1651.400866 | 1651.407622 |
| Sum of electronic and thermal Energies (E=E0+Evib+Erot+Etrans) | -1651.378808 | -1651.385835 |
| Sum of electronic and thermal Enthalpies(H=E+RT) | -1651.377864 | -1651.384891 |
| Sum of electronic and thermal Free Energies (free energies) (G=H-TS) | -1651.449807 | -1651.455144 |
Part 2: Analysis of the properties of the synthesised alkene epoxides

the Jacobsen and shi's Catalyst
Jacobsen and shi's catalysts (Scheme 4) were used to accelerate asymmetric epoxidation of alkenes. The conformation was used to search for the crystal structure of these catalysts in Cambridge Crystal Database (CCDC). Besides, Mercury program was used to obtain those crystal structures. Two crystal structures presents below[3] [4] .
| 21Jacobsen catalyst | 23Shi's catalyst | ||||||
|---|---|---|---|---|---|---|---|
|
|
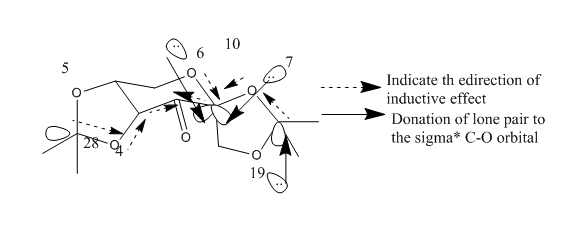

There have four anomeric centres within the structure of pre catalyst 21. However just a few C-O bonds are shorter than the normal C-O bond, 0.142 nm (sum of the covalent radii of oxygen and carbon). Due to the anomeric effect, the lone pair of the oxygen atom is donated to the sigma * C-O orbital adjacent then in get shorten the C-O bond. Will the C-O bond get shorten or not is dependent on the direction of the inductive effect of the carbonyl group. In the crystallised structure and the diagram shows below, which owns four shorter C-O bonds in the pre catalyst 21.
| Atom | C-O bond length/nm |
|---|---|
| O5-C28 | 0.1409 |
| O4-C28 | 0.1439 |
| O6-C10 | 0.1403 |
| O7-C10 | 0.1403 |
| O7-C1 | 0.1441 |
| O19-C1 | 0.1413 |
For Jacobsen catalyst, four distances between two closely distributed hydrogen atoms on two tertiary butyl groups were measured then shown on Crystal structure of Shi and Jacobsen catalyst. Compared to interaction values to van de Waals distance for hydrogen (2.40 Å), [5], which found the attractive interactions between all four pairs of hydrogen atoms. So,during alkene epoxidation, these interactions stop alkene from approaching to the Mg center from tertiary butyl side causes the alkenes be fully stereoselectively epoxidized.
Noticed that the presence of anomeric centres (carbon centres connecting to two oxygen) in Shi's catalyst. For each anomeric centre, one of the C-O bond is shorter than the average C-O bond length (142 pm) however the other one is longer.(see Figure 4). Due to the lone pair electrons donation from one of the oxygen to the C-O σ * orbital, that shortens the carbon oxygen bond between the oxygen which has donated the lone pair electrons and the carbon, lengthening another carbon oxygen bond which electron density in the σ * anti-bonding orbital increases.
The Calculated NMR Properties of the Epoxides
Two alkenes (trans-stilbene and 1,2-dihydronaphthalene) were been epoxidized, each of them coming out two alkene oxides enantiomers (see Scheme 5). Both products were optimized by Avogadro with energy minimized (Optimized Alkene Oxides). The structures of R,S-trans-stilbene oxide and R,R-dihydronaphthalene oxide were calculated using Gaussian. 1H and 13C NMR spectra were simulated under B3LYP theory and 6-31G(d,p) basis, with chloroform as the solvent(Figure 4 to 7) (DOI:10042/28024 and DOI:10042/28025 ). The chemical shifts of four spectra were shown in Table 5 to 8.
| R,R-trans-stilbene oxide | S,S-trans-stilbene oxide | R,S-Dihydronaphthalene oxide | S,R-Dihydronaphthalene oxide | ||||||||||||
|---|---|---|---|---|---|---|---|---|---|---|---|---|---|---|---|
|
|
|
|
| Shift (ppm) | Degeneracy | Atoms |
| 134.0870000000 | 2.0000 | 5,9 |
| 124.2190000000 | 2.0000 | 3,13 |
| 123.5175000000 | 2.0000 | 1,11 |
| 123.2128500000 | 2.0000 | 12,2 |
| 123.0770000000 | 2.0000 | 10,6 |
| 118.2640000000 | 2.0000 | 14,4 |
| 66.4240000000 | 2.0000 | 7,8 |
| Shift (ppm) | Degeneracy | Atoms |
| 7.5704000000 | 2.0000 | 18,26 |
| 7.4700000000 | 8.0000 | 20,23,16,24,17,25,19,27 |
| 3.5380000000 | 2.0000 | 21,22 |

| Shift (ppm) | Degeneracy | Atoms |
| 135.3877560205 | 1.0000 | 4 |
| 130.3705995748 | 1.0000 | 5 |
| 126.6664754359 | 1.0000 | 6 |
| 123.7910886822 | 1.0000 | 2 |
| 123.5334121254 | 1.0000 | 3 |
| 121.7441913397 | 1.0000 | 1 |
| 52.8211670356 | 1.0000 | 10 |
| 52.1924643324 | 1.0000 | 7 |
| 30.1802794498 | 1.0000 | 8 |
| 29.0634872612 | 1.0000 | 9 |

| Shift (ppm) | Degeneracy | Atoms |
| 7.6151181280 | 1.0000 | 15 |
| 7.3900000000 | 2.0000 | 13,12 |
| 7.2514926773 | 1.0000 | 14 |
| 3.5595613767 | 1.0000 | 16 |
| 3.4831000000 | 1.0000 | 21 |
| 2.9466313163 | 1.0000 | 17 |
| 2.2672859897 | 1.0000 | 18 |
| 2.2090255293 | 1.0000 | 19 |
| 1.8734432001 | 1.0000 | 20 |

| Shift (ppm) | Degeneracy | Atoms |
| 159.0583525316 | 1.0000 | 4 |
| 158.8103855320 | 1.0000 | 5 |
| 143.0888073617 | 1.0000 | 6 |
| 142.1069708605 | 1.0000 | 1 |
| 140.4097181276 | 1.0000 | 2 |
| 136.1738515816 | 1.0000 | 3 |
| 76.5157945443 | 1.0000 | 11 |
| 69.1405631356 | 1.0000 | 14 |
| 45.6264520368 | 1.0000 | 7 |
| 43.0944021631 | 1.0000 | 8 |

| Shift (ppm) | Degeneracy | Atoms |
| 7.3174463253 | 3.0000 | 16,18,15 |
| 7.2361771974 | 1.0000 | 17 |
| 3.3982744035 | 1.0000 | 9 |
| 3.0766366869 | 1.0000 | 10 |
| 2.9151339569 | 1.0000 | 20 |
| 2.5271290601 | 1.0000 | 13 |
| 2.2423640897 | 3.0000 | 21 |
| 2.0341021979 | 3.0000 | 12 |
In conclusion, from the table shows above that the epoxide has a very similar calculated 1H and 13C NMR spectrums within a same pair of enantiomer. Therefore, NMR still not a good tool in determining the absolute configuration of the epoxide.
The Assignment of the Absolute Configurations for products
Alkene epoxidation is stereospecific to the nature of alkenes that would not alter the trans/cis configuration of the alkene. The alkenes proceeds through a concerted syn-addition mechanism, cause the trans-stilbene gives R,R- or S,S-trans-stilbene oxides while a cis- alkene: 1,2-dihydronapthalene gives 1R,2S- or 1S,2R-dihydronapthalene oxide as shown on Scheme 5. Finally, the stereochemistry of final products after epoxidation should be characterized using analytical techniques.
Optical rotatory power
The optical rotatory power is one of the measurements that distinguish the absolute configurations of the enantiomes. Initially, literature values of optial rotatory powers of four epoxides were searched from Reaxys (Table 9). Computational analyses were carried out to predict the optical rotatory powers of four optimized epoxides in chloroform at 589 nm and 365 nm using Gaussian with CAM-B3LYP method, 6-311++g(2df,p) basis. The outcomes were summarized in Table 10.
| Epoxides | R,S-dihydronaphthalene oxides[6] | S,R-dihydronaphthalene oxides[7] | S,S-trans-stilbene oxides[8] | R,R-trans-stilbene oxides[9] |
|---|---|---|---|---|
| Concentration (g/100ml) | 0.81 | 0.21 | 0.56 | 0.73 |
| Enantiometric Excess (%) | 99 | 99 | 89 | 97 |
| Solvent | CHCl3 | CHCl3 | CHCl3 | CHCl3 |
| Optical Rotation | 129o | -39o | -205.2o | 334.6o |
| Wavelength (nm) | 589 | 589 | 589 | 589 |
| Temperature | 20oC | 25oC | 20oC | 25oC |
| epoxides | R,R-trans-stilbene oxides DOI:10042/28050 | S,S-trans-stilbene oxidesDOI:10042/28051 | R,S-dihydronaphthalene oxides DOI:10042/28048 | S,R-dihydronaphthalene oxides DOI:10042/28049 |
|---|---|---|---|---|
| αd at 589 nm | 102.87o | -24.18o | 177.43o | -52.74o |
The predicted values calculated by the method mentioned above agrees with the literature values found with some extend of deviation tolerated. The sign of all predicted values perfectly match with the literature values. Therefore, the method introduced is reliable in calculating the optical rotatory power of those two epoxides.
VCD and ECD
Apart from optical rotatory power, the absolute configuration could be assigned by vibrational circular dichroism (VCD) and the electronic circular dichroism (ECD). VCD spectra of R,R- and S,S-trans-stilbene oxides were plotted to assign the configuration (Figure 8 and 9). As for ECD, due to lacking of chromophore in epoxides, it fails to assign the configuration by using UV/Vis spectrum.


Vibrational Circular Dichroism (VCD)
Dislike ECD, as the table shows below, VCD can be used in assigning the absolute chemistry of the epoxides. As the same pair of enantiomer, the VCD spectrums are mirror images to each other. This is due to the two complete and opposite vibrational environments presented in the enantiomers pair. In conclusion, the instrument is not available in the department, hence it cannot be done.
| Tran-stilbene RR DOI:10042/28167 | Tran-stilbene SS DOI:10042/28166 |
|---|---|
| 1,2 dihydronaphtalene oxide RR DOI:10042/28165 | 1,2 dihydronaphtalene oxide SSDOI:10042/28164 |
|---|---|
 |
|
| 1,2 dihydronaphtalene oxide RS DOI:10042/28163 | 1,2 dihydronaphtalene oxide RSDOI:10042/28162 |
 |
 |
Using the (calculated) properties of transition state for the reaction
By using The free energy different between the transition stats of two diastereomeric (ΔG) to calculate the enantiomeric excess of four product mixtures. The ratio of concentrations of the two species (K) for each epoxide can be transferred from the each ΔG according to the equation "ΔG=-RTlnK". For the values of K,equilibrium constant each enantiomeric excess was distributed (Table 11 to 14).
In table 11 to 14, R,S transition states and R,R transition states are predominant for both Shi's catalyst and Jacobsen catalyst used for epoxidations because of having lower free energy comparing to S,R and S,S transition states separately. So the R,S-trans-stilbene oxide and R,R-dihydronaphthalene oxide are expected to be the major products in trans-stilbene and 1,2-dihydronaphthalene epoxidation used by both Shi's and Jacobsen catalyst.
| Transition State | R,R-trans-stilbene oxide | S,S-trans-stilbene oxide |
| Free Energies of 1 (Hartrees) | -1535.14760552 | -1535.14668122 |
| Free Energies of 2(Hartrees) | -1535.14902029 | -1535.14601044 |
| Free Energies of 3(Hartrees) | -1535.16270178 | -1535.15629511 |
| Free Energies of 4(Hartrees) | -1535.16270154 | -1535.15243112 |
| Average ΔG(Hartrees) | -1535.1555072825 | -1535.1503544725 |
| Free Energy Difference (RR-SS)(Hartrees) | -0.00515281000002688 | |
| K | 235.7 | |
| Relative Population (%) | 99.5 | 0.5 |
| Enantiomeric Excess (%) | 99.0 |
| Transition State | R,R-trans-stilbene oxide | S,S-trans-stilbene oxide |
| Free Energies of 1 (Hartrees) | -3575.66547138 | -3575.66429705 |
| Free Energy Difference (RR-SS) (Hartrees) | -0.00117432999968514 | |
| K | 3.5 | |
| Relative Population (%) | 77.8 | 22.2 |
| Enantiomeric Excess (%) | 55.6 |
| Transition State | R,S-dihydronaphthalene oxide | S,R-dihydronaphthalene oxide |
| Free Energies of 1 (Hartrees) | -1381.54381947 | -1381.55280118 |
| Free Energies of 2 (Hartrees) | -1381.5472601 | -1381.53607543 |
| Free Energies of 3 (Hartrees) | -1381.556204 | -1381.54761301 |
| Free Energies of 4 (Hartrees) | -1381.54990117 | -1381.55813219 |
| Average ΔG (Hartrees) | -1381.549296185 | -1381.5486554525 |
| Free Energy Difference (RR-SS) (Hartrees) | -0.000640732500414742 | |
| K | 1.9 | |
| Relative Population (%) | 65.5 | 34.5 |
| Enantiomeric Excess (%) | 31.0 |
| Transition State | R,S-dihydronaphthalene oxide | S,R-dihydronaphthalene oxide |
| Free Energies of 1 (Hartrees) | -3422.06853796 | -3422.06054777 |
| Free Energies of 2 (Hartrees) | -3422.05830133 | -3422.05965215 |
| Average ΔG (Hartrees) | -3422.063419645 | -3422.06009996 |
| Free Energy Difference (RR-SS) (Hartrees) | -0.00331968499995128 | |
| K | 33.8 | |
| Relative Population (%) | 97.1 | 2.9 |
| Enantiomeric Excess (%) | 94.2 |
NCI Analysis for the Transition State
Gaussview(Figure 10)used for analysed the the non-covalent interactions for R,R- transition state of Shi's catalyst promoted epoxidation of trans-stilbene

Figure 10. The non-covalent interactions for R,R- transition state of Shi's catalyst promoted epoxidation of trans-stilbene
As the picture shows above, this transition state is stabilized by the attractive interactions to determine the stereoselectivity of the epoxidation,the green region demonstrates attractive interaction that active catalyst binds to the substrate via the oxygen atoms. The substrate should have oriented itself to maximize the attractive interaction before binding to minimize the energy of the transition state.
QTAIM analysis for transition state of R,R-trans-stilbene oxide promoted by Shi's catalyst

The QTAIM analysis was conducted to calculate the orientation of R,R-trans-stilbene oxide in respect to Shi's catalyst. All the non-covalent bond critical points from weak interaction associated with weak interaction between oxygen and hydrogen were assigned (Figure 11).
New Candidates for investigations
From the data base from Reaxy, two possible new candidates of exoxide and their alkene presented below.Two epoxides are (4R,1R)-pulegone oxide and (1R,4S)-pulegone oxide with their structure are listed in diagram below. They both can be synthesised from the (+) Pulegone (with potassium hydroxide and dioxygen peroxide[10]), which is commercial available in the catalogue of the Sigma Aldwich . In,conclusion, they are the suitable epoxides for the future investigation.

| (1R,4R)-pulegone oxide[11] | (1R,4S)-pulegone oxide[11] | |
|---|---|---|
| Condition | C=0.03 , ethanol, 324 nm, 25 degree celsius | C=0.03 , ethanol, 327 nm, 25 degree celsius |
| Rotation [Aplha] | 853.9 deg | -1177.9 deg |
untitled.mol |
Limitations of the software and further works
Further work
- In chemical database search for the Optical Rotation for epoxide 4 RR and SS and then compare the data with the calculated value in this report.
- Due to all the molecules were optimsed by using Avogadro in this project, repeat the optimisation of
- Repeat the optimisation of the molecules with ChemBIO3D and compare the results to the one obtained in this investigation. Due to all the molecule were optimised with Avogadro in this project.
- Investigate the similar molecules of the epoxide as shown above.
Limitations of the software
- Gassview: It is less time consuming for running and it needs particular files : fchk, log. in order to get the required information on the epoxide molecules. Besides it is a good tool to the predicted ECD and VCD,UV,NMR,IR spectrums for the specific molecule.
- QTAIM: For better understand the coordinates of the molecules, it is also a good tool to use. However,it could not get the rotated 3D structure uploaded to the wiki page.
- Avagordro: There is big drawback of this software, the stereochemistry of the molecules was lost in the import and there also had a minor change to the configuration of the structure. However, for small molecule, to obtain its structure is easy by using the software, but for large size is much more difficult.
Reference
- ↑ W. F. Maier, P. Von Rague Schleyer, J. Am. Chem. Soc., 1981, 103, 1891. DOI:10.1021/ja00398a003
- ↑ Spectroscopic data: L. Paquette, N. A. Pegg, D. Toops, G. D. Maynard, R. D. Rogers, J. Am. Chem. Soc.,, 1990, 112, 277-283. DOI:10.1021/ja00157a043
- ↑ Zhi-Xian Wang, S.M.Miller, O.P.Anderson, Yian Shi, J.Org.Chem. , 2001, 66, 521. DOI:10.1021/jo001343i
- ↑ J.W.Yoon, T.-S.Yoon, S.W.Lee, W.Shin, Acta Crystallogr.,Sect.C:Cryst.Struct.Commun. , 1999, 55, 1766. DOI:10.1107/S0108270199009397
- ↑ DOI:10.1021/jp8111556
- ↑ Pedragosa-Moreau, S.; Archelas, A.; Furstoss, R. Tetrahedron 1996, 52, 4593
- ↑ Lin, H.; Qiao, J.; Liu, Y.; Wu, Z.-L. Journal of Molecular Catalysis B: Enzymatic 2010, 67, 236
- ↑ Niwa, T.; Nakada, M. Journal of the American Chemical Society 2012, 134, 13538
- ↑ Wong, O. A.; Wang, B.; Zhao, M.-X.; Shi, Y. Journal of Organic Chemistry 2009, 74, 6335
- ↑ W. Treibs, " Berichte der deutschen chemischen Gesellschaft (A and B Series) ", Journal of Organic Chemistry , 1933, 66(10) , 1483–1492DOI:10.1002/cber.19330661008 10.1002/cber.19330661008
- ↑ 11.0 11.1 Reusch; Johnson, " The Pulegone Oxides ", Journal of Organic Chemistry , 1963, 28 , 2557.DOI:10.1021/jo01045a016 10.1021/jo01045a016