Rep:Mod:shaneomar2
Module 2
Calculations on TlBr3
The structure of TlBr3 was built in Gaussview and then optimised using the DFT/B3LYP method and pseudo-potential LanL2DZ. The results of this optimisation are shown below:
TlBr3 optimisation[1]:

In order to confirm this structure was a minima in energy, the RMS gradient was checked and also frequency analysis carried out. The method and basis set used in the frequency analysis must be the same as that of the optimisation so that the constraints of the system and calculations performed are consistent.
TlBr3 frequency analysis[2]: The RMS gradient is close to zero which shows a convergence upon reaching the minimum energy. The vibrations of the molecule can be considered as the second differential of the potential energy surface, therefore they should be all positive where there is a minimum. The frequency analysis of this molecule showed all positive vibrations, confirming this minimum energy.
The low frequencies of TlB3 are the motions of the centre of mass of the molecule. These were reported as -3.4226, -0.0026, -0.0004, 0.0015, 3.9361, 3.9361 cm-1 (though the calculations are only accurate to plus/minus ~10cm-1). The lowest "real" normal mode was found to be 46 cm-1, which is much larger than the low frequencies.
The optimised TlBr3 had a Tl-Br-Tl bond angle of 120.0o and a Tl-Br bond length of 2.65 Å. This is quite close to the literature values[3][4] for Tl-Br bonds of this type, reported as 2.5 Å and 2.6182 Å, which suggests this calculated bond length is reasonable.
In some structures Gaussview does not display all of the bonds. This does not mean there is no bond, it just does not appear sometimes due to the program's built in values of particular bond lengths. Where the bond between two atoms does not match well with the value contained in the program, it does not display the bond. The fact that there is no line shown does not change the fact that the two atoms are sharing electron density. A chemical bond is just a representation of the overlap of atomic orbitals, which lead to the sharing of electrons (with a certain degree of covalency) between different nuclei. The length of this 'bond' is an averaged distance that the two nuclei are apart whilst sharing the electron density. Therefore changing this distance should not make the bond disappear, but may change the degree of electron orbital overlap and hence stability (energetics) of the bond.
Frequency analysis of BH3
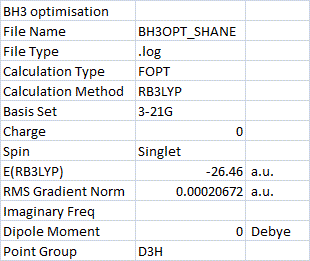
The structure of BH3 was optimised in Gaussview and the reults are displayed on the right, click the button to view structure:
BH3 optimisation[5]:
The H-B-H bond angle was calculated as the expected 120o and the B-H bond distance was calculated as 1.19 Å which is identical to the literature value[4].
Frequency analysis was then carried out on the optimised BH3 and all vibrations were found to be positive, confirming the minimum.
BH3 frequency analysis results[6]:
| no. | Form of vibration | Frequency (cm-1) | Intensity | Symmetry (D3h point group) | |||
|---|---|---|---|---|---|---|---|
| 1 |
|
1144 | 92.9 | p(z) type symmetry: A2ll | |||
| 2 |
|
1204 | 12.3 | p(x)/p(y) type symmetry: El | |||
| 3 |
|
1204 | 12.3 | p(x)/p(y) type symmetry: El | |||
| 4 |
|
2598 | 0 | Totally symmetrical: A1l | |||
| 5 |
|
2737 | 103.7 | p(x)/p(y) type symmetry: El | |||
| 6 |
|
2737 | 103.7 | p(x)/p(y) type symmetry: El |
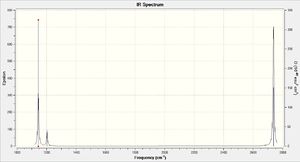
IR spectrum analysis
The IR spectrum only has 3 peaks, even though there are 6 vibrational modes. This is due to the fact that there are two pairs of modes which are degenerate (have the same frequency and intensity), and also that the totally symmetric mode is not IR active.
The three peaks on this spectrum are that of mode 1, 2/3 and 5/6.
Molecular orbitals of BH3
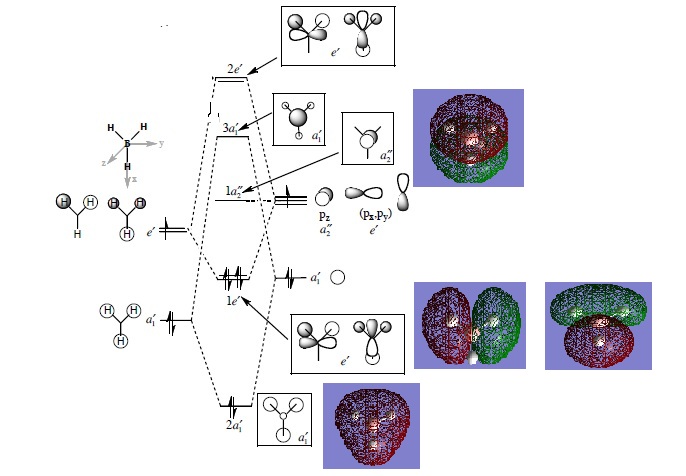
The MO analysis was carried out using the DFT/B3LYP method and the 6-31G basis set. The results[7] were used to add the the MO diagram below in order to compare the real MOs to the LCAO pictures:
The MO diagram[8] of BH3 (shown on the right) contains the LCAO in the white boxes and the real MOs in the blue boxes. This diagram shows that the LCAO are well matched in appearance to the real MOs. For example, the 2al orbital has an LCAO consisting of all same phase orbitals. The real MO of this orbital also has one phase, which looks like a blended in version of the LCAO. The symmetry of the other LCAO is a good match to the real MOs, with the same parity.
What these reults suggest is that the accuracy of the real MO calculations is good. The fact that MOs can be accurately calculated in this way is very useful in visualising the 'real' picture which the LCAOs do not fully show. Evidently, qualitative analysis of this kind can be used to calculate the MOs for small sized molecules with good accuracy and reasonable calculation time.
Cis and Trans Isomerism
The aim of this investigation was to compare the cis and tran isomers of Mo(CO)4L2 where L=PPh3. In order to perform the required calculations on the isomers of the Mo(CO)4(PPh3)2 complex, the phenyl groups were replaced by chlorine so that L=PCl3. This allowed shorter calculation times since the more atoms used equals more expense to computer resources.
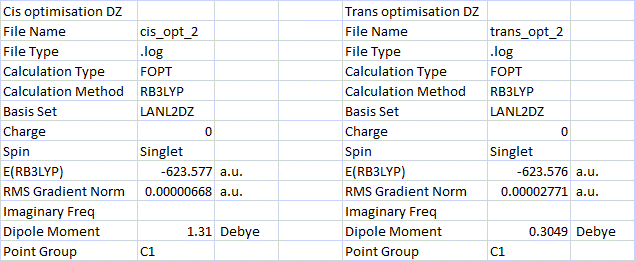
The optimisation[9][10] of the cis and trans-Mo(CO)4(PCl3)2 was performed in two stages. Firstly using the pseudo-potential LANL2MB with loose convergence. Then (after modifying the resulting structure) using LANL2DZ with increased electronic convergence (both steps using method B3LYP).
To confirm the optimisations had given a minima in energy, frequency analysis was carried out using the same method and pseudo-potential as the second optimisation. The results[11][12] of these calculations showed that all of the frequencies in both isomers were positive and that the minima had been found.
The geometric parameters for these optimised geometries were then measured in Gaussview. To check the reliability of the results, the literature values[13] for some geometric parameters in this type of molybdenum complex were found. The Mo-P bond length in cis-Mo(CO)4(PCl3)2 was calculated as 2.51 Å, and in the trans-isomer 2.45 Å. These values are close to the literature Mo-P bond length of 2.57 Å (reported for cis-Mo(CO)4(PPh2)3, so these lengths appear to be accurate. What these Mo-P bond distances also show is that the cis-isomer has a longer Mo-P bond than the trans-isomer. The P-Mo-P angle in the cis isomer is obviously much smaller than in the trans-isomer (94.2 o), but is larger than the C-Mo-C angle due to repulsion between phosphine ligands.
The energy of the cis and trans isomers were calculated (as shown in the table above). The cis-isomer was found to be 2.6 KJ/mol lower in energy than the trans-isomer. This would suggest that the cis-isomer is the more thermodynamically stable. The reason for this could be explained by the larger Mo-P bond length in the cis-isomer allowing the two phosphine ligands to reduce some of their ligand-ligand steric repulsion. Since the trans-isomer has four CO groups roughly at right-angles and the cis-isomer has three (one less), the overall energy of the cis-isomer will be lower as long as the P-Mo-P angle is sufficiently large. The longer Mo-P bond in the cis-isomer allows a large enough phosphine-phosphine separation to reduce repulsion and lower the overall energy. One way to alter the relative ordering of the two isomer energies would be to use larger, more bulky phosphine ligands. This would increase the amount of ligand repulsion in the cis-isomer and therefore raise it's energy above the trans isomer. The fact that we changed the PPh3 ligands to PCl3 in the beginning may have changed the outcome since we have somewhat reduced the size of the ligands.
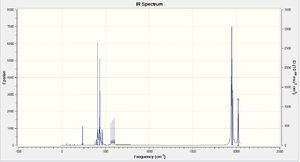
The frequency analysis showed that one vibration in the trans-isomer had a very small frequency (4 cm-1) which is shown on the left:
Vibration |
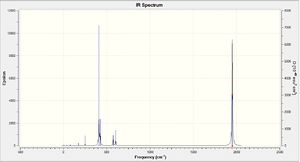
The IR spectra for the two isomers are shown on the right. There are 4 CO stretched in the cis-isomer and essentially 1 CO stretch in the trans-isomer. However, the peak in the trans spectrum is actually split into two by 1 cm-1 which may be due to a slight loss of symmetry. The frequencies of these vibrations were compared to the values obtained in the year 2 lab report for the Mo(CO)4(PPh3)2 isomers. The largest carbonyl stretch in the cis-isomer was calculated as 2023 cm-1, which is close to the 2014 cm-1 measured value. The carbonyl stretch in the trans-isomer was 1950 cm-1 which was slightly larger than the 1900 cm-1 measured value.
The number of active CO stretches in the infrared spectra of these compounds can be related to the symmetry of the OC-Mo-CO group. When a molecule has a bent OC-Mo-CO group, as in the cis isomer, both the symmetric and antisymmetric stretches will be IR active which gives rise to four bands in the spectrum. In the case of a symmetrical linear OC-Mo-CO group, as in the trans isomer, only the antisymmetric stretch changes the electric dipole moment. This leads to just one band being observed in the CO stretch region of the spectrum. Therefore these calculations appear to correlate with the symmetry of each isomer.
Mini Project: Dependance of v(CO)on the electron density at the metal
The aim of this project is to investigate the effect electron density has on carbonyl stretching frequencies. The two molecules under consideration are mer-Mo(PF3)3(CO)3 and mer-Mo(PCl3)3(CO)3. The hypothesis is that upon changing the type of phosphine ligand in the complex, the frequency of the carbonyl stretch should change due to a change in the degree of back-bonding to the CO pi* orbital. In order to investigate this the MOs and vibrations had to be calculated from optimised geometries.
The geometries were optimised[14][15] using the DFT/B3LYP method. The basis set 6-311G(d) was used for all atoms except the metal centre, with which the pseudo-potential LanL2DZ was used.
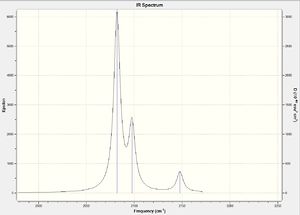
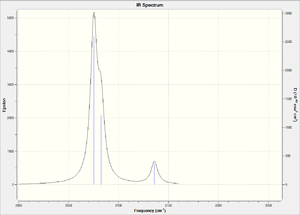
To check that these optimisations were at a minimum, frequency analysis was performed for both molecules. The results[16][17] showed that one of the vibrations has a negative frequency (-17 cm-1). This could be due to the energy not being at the lowest possible minimum, but this is not a large negative value so the calculations should still be applicable.
Both spectra show that there are 3 CO frequencies, which is what we would expect given the mer-geometry of the molecules. There are two bent OC-Mo-CO groups in the molecule giving equivalent symmetric and asymmetric stretches. There is also a linear OC-Mo-CO group in the molecule which contributes only a symmetric stretch, this gives a total of 3 as observed in the spectra. What is most notable on comparing the frequencies of the carbonyl stretches in the two molecules is that they are lower in Mo(PCl3)3(CO)3. The values in Mo(PCl3)3(CO)3 are 2075, 2082, 2135 cm-1 compared to those in Mo(PF3)3(CO)3 which are 2082, 2097, 2147 cm-1. These values compare well to the values reported in YR 2 transition metal lecture course (Imperial College).
A molecular orbital analysis was carried out to find an explanation for the observed trend in the IR frequences. The method and basis sets were maintained and the calculations yielded the MO surfaces. The NBO analysis was also used to investigate the electronic distribution in each molecule. The results[18][19] of this are displayed below:

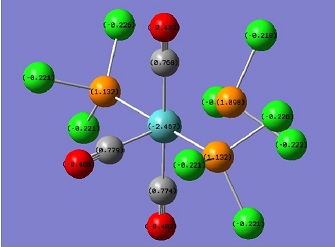
The charge distribution for mer-Mo(PF3)3(CO)3 and Mo(PCl3)3(CO)3 are displayed left and right respectively. This shows that the the less electronegative Cl atoms in PCl3 ligands are better electron donors than F, since the charge on Cl (-0.229) is roughly half that on F (-0.541). Also, the P atoms in the phosphine ligands also have a roughly halved positive charge on changing from the left diagram to the right. Chemical intuition would tell us that if negative charge is being gained on the phosphorous atoms, then the effect would carry through to the metal centre. However, the nbo diagram for Mo(PCl3)3(CO)3 shows a less negative charge on the Mo atom. This would suggest that the nbo analysis is not a useful tool to look at metal electron density, and the increased back-bonding cannot be explained in this way. However, the diagrams to show the effects of changing the electronegativity of phosphine ligands on the charge distribution of the ligand.
In summary, it has been shown through use of IR frequency analysis of carbonyl stretches and also by looking at charge distribution, that increasing the electron donor properties of a ligand will cause v(CO) to decrease. This has been explained by the increased electron density on the metal causing increased back-bonding into the pi* orbital of the carbonyl ligands. The result is a slight lengthening of the carbonyl bond and hence a lower stretch frequency.
References
- ↑ https://wiki.ch.ic.ac.uk/wiki/images/5/50/SHANE_TLBR3_OPT.LOG - Optimisation of TlBr3
- ↑ https://wiki.ch.ic.ac.uk/wiki/images/1/1f/SHANE_TLBR3_FREQ.LOG - Frequency analysis of TlBr3
- ↑ Tl-Br bond length - DOI:10.1021/ja00123a011
- ↑ 4.0 4.1 http://www.hbcpnetbase.com//articles/09_02_90.pdf - Structure of free molecules in the gas phase
- ↑ https://wiki.ch.ic.ac.uk/wiki/images/c/ce/BH3OPT_SHANE.LOG - Optimisation of BH3
- ↑ https://wiki.ch.ic.ac.uk/wiki/images/1/1e/SHANE_BH3_FREQ.LOG - Frequency analysis of BH3
- ↑ MO analysis of BH3 - DOI:10042/to-5742
- ↑ http://www.huntresearchgroup.org.uk/teaching/teaching_MOs_year2/L3_Tut_MO_diagram_BH3.pd - 3rd Year Inorganic tutorial, Dr Patricia Hunt
- ↑ Optimisation of cis-isomer - DOI:10042/to-5760
- ↑ Optimisation of trans-isomer - DOI:10042/to-5762
- ↑ Frequency analysis of cis-isomer - DOI:10042/to-5763
- ↑ Frequency analysis of trans-isomer - DOI:10042/to-5763
- ↑ Geometric parameters - DOI:10.1021/ic00131a055
- ↑ Optimisation of Mo(PF3)3(CO)3 - DOI:10042/to-5907
- ↑ Optimisation of Mo(PCl3)3(CO)3 - DOI:10042/to-5921
- ↑ Frequency analysis of Mo(PF3)3(CO)3 - DOI:10042/to-5915
- ↑ Frequency analysis of Mo(PCl3)3(CO)3 - DOI:10042/to-5920
- ↑ MO analysis of Mo(PF3)3(CO)3 - DOI:10042/to-5915
- ↑ MO analysis of Mo(PCl3)3(CO)3 - DOI:10042/to-5920

