Rep:Mod:sg3415TS
Introduction
Gaussian is a computational chemistry tool which enables efficient calculations of reaction coordinates across a potential energy surface. By differing the levels of approximations, Gaussian uses different quantum methods to calculate transition states to varying degrees of accuracy.
Potential energy surface
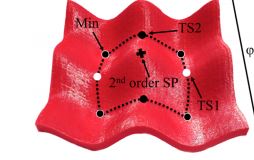
A potential energy surface (PES) is a multi-dimensional plot of potential energy. The number of dimensions is the number of degrees of freedom, which are the normal modes. There are multiple possible reaction pathways to progress from reactants to products via a transition state, and deciding upon one relies on prior understanding of the approach trajectory and orientation of reactants. An example 3D potential energy surface is shown in Figure 1.
Transition state
A transition state is the point of highest energy in the progression of a reaction. It is a second order saddle point with a gradient of zero, where the second derivative (corresponding to the force constant) is negative. This is relevant to computational theory because where a transition state is located, this vibrational frequency will appear negative. This is an imaginary number which resembles the vibration of the bonding atoms moving towards each other.
Nf710 (talk) 09:34, 16 November 2017 (UTC) Its a first order saddle point because it is only negative force constant. It is nto a negative number it is an imaginary number due to the sqrt of the negative force constant in the 1d quantum harmonic oscillator.
Minima
Potential energy surfaces contain both global and local minima. A local minimum is a low-energy geometry when compared to all surrounding points. This could be a reagent for example, which is generally a stable state of a compound, while not necessarily being the lowest energy substrate in the reaction. A global minimum point is the lowest energy point on the entire energy surface. This resembles the most stable state of any structure present in the reaction. At a minimum point, the surrounding gradient is zero and the second derivative is positive.
Method
In this experiment, three different methods were used. The first involved guessing the transition structure, which was optimised to give the transition state saddle point. Method 2 involved guessing the transition state of the reaction and freezing the atoms which form bonds in the process. This structure was then optimised to a minimum energy then used to find a transition structure by optimising. The third method began by drawing the either the reactants or products (the one with fewer atoms was chosen, here it was the product) and optimising. The bonds formed in the desired reaction were then broken and the atoms bonding were frozen. The process then continued as per method 2. For more complex structures, such as those in exercises 2 and 3, method 3 was the most successful in giving a good initial estimate for the transition state, saving time by not having to guess the structure.
Using Gaussian enables Slater functions to be replaced by a linear combination of Gaussian functions. This is similar to the method used to create molecular orbitals by linearly combining atomic orbitals. The simplification using Gaussian functions allows a relatively accurate calculation to be carried out more quickly.[2]
Nf710 (talk) 09:46, 16 November 2017 (UTC) nice. this is correct. It makes the integrals much simpler to compute.
The concept of optimisation is that the computer runs a calculation to solve the Hamiltonian matrix. The geometry is then altered and the calculation is run again, until it gets closer to a solution in a step-wise fashion. PM6 is a semi-empirical method which works by using pre-set values for certain integrals. It therefore requires less calculations because it has made more approximations, making the tasks quicker to complete but less accurate. The other method used was a DFT-hybrid calculation, B3LYP, using the 6-31G(d) basis set. This is a more time-consuming but more accurate method as there are fewer approximations of integrals, which therefore produces results that are comparable to literature. DFT evaluates the Hamiltonian as a function of electron density. B3LYP uses both this and a Hartree-Fock calculation to calculate the exchange correlation contributions to the energy. It does not include correlations due to many-body interactions, but this level of complexity would make it more computationally expensive.[3]
Nf710 (talk) 09:46, 16 November 2017 (UTC) The HF part of it tried to account for the e-e correlation. But good understanding!
Exercises 1 and 3 used the PM6 method as this was sufficient for the relevant analysis. In exercise 2, where the required analysis was more quantitative (such as determining the energy of the reaction barrier), the B3LYP method was used after PM6 to further optimise the transition states to show the secondary orbital overlap more clearly. By doing these optimisations step-wise, it sped up the process. Crucially, the energies determined from either PM6 or B3LYP cannot be compared between the different levels of theory. IRC (intrinsic reaction coordinate) calculations were then used to confirm that the reaction has proceeded through the expected pathway to end up at the minimum point corresponding to the products.
Nf710 (talk) 09:46, 16 November 2017 (UTC) Really good intro. Went deep into the theory.
Exercise 1: Reaction of butadiene and ethene
Exercise 1 focussed on the reaction of butadiene with ethene in a π4s + π2s Diels-Alder cycloaddition, forming cyclohexene, as seen in the Figure 2 below.

MO analysis
The MO diagram below (Figure 3) shows the HOMO and LUMO MOs from each butadiene and ethene forming the four key MOs of the transition state. This was constructed by looking at the PM6 calculations of the reactants and the transition state. These are the HOMO-1, the HOMO, the LUMO and the LUMO+1. The HOMO-1 is slightly higher in energy than the HOMO of butadiene (despite being a new MO, which is usually lower in energy) because it is the transition state, which is at a maximum in terms of the reaction coordinate.
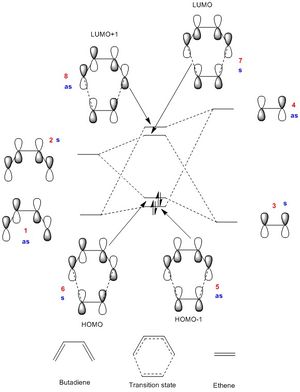
(Fv611 (talk) The MO is really good (well done on showing the correct energy levels corresponding to the MOs you've calculated), but you have switched around orbitals 5 and 6. As you point out in Table 1, the HOMO-1 orbital should be asymmetric, and the HOMO should be symmetric. While the labels are correct, they do not match the MO you have drawn.)
The Jmols in Table 1 below show that the HOMO of butadiene and the LUMO of ethene are both antisymmetric orbitals, and the LUMO of butadiene and the HOMO of ethene are both symmetric. Only orbitals of the same symmetry are “allowed” reactions because these have a non-zero orbital overlap integral. An overlap integral of zero (due to orbitals of different symmetry) means the reaction is “forbidden” and the orbitals therefore do not mix.
(Fv611 (talk) Table 1 would have benefited from symmetry labels, and the numbering of the ethene and butadiene jmol with the same notation you used in your MO diagram.)
Normal electron demand Diels-Alder reactions occur between an electron rich diene and an electron deficient dienophile and occur between the diene HOMO and the dienophile LUMO. Inverse electron demand is the opposite.
In MO diagrams, the molecular orbital has the greater contribution from the atomic orbital that is closer in energy to the newly formed MO. This same principle applies in this situation, which is demonstrated by the MOs 5-8 in the pictures above. For example, the LUMO of butadiene is further in energy from the transition state HOMO than the ethene HOMO, so it’s orbital contribution is smaller.
Bond length analysis
| C-C bond | Bond length / Å | ||
|---|---|---|---|
| Reactants | TS | Products | |
| C1-C2 | 1.333 | 1.380 | 1.501 |
| C2-C3 | 1.471 | 1.411 | 1.337 |
| C3-C4 | 1.333 | 1.380 | 1.501 |
| C4-C5 | N/A | 2.116 | 1.537 |
| C5-C6 | 1.327 | 1.382 | 1.535 |
| C6-C1 | N/A | 2.113 | 1.537 |
| Budadiene C=C bond: 1.454 Å, butadiene C-C bond: 1.338 Å, ethene C=C: 1.331 Å.[4] | |||
(Fv611 (talk) Adding the scheme with the numbered carbons here would have made it clearer)
C1-C2 and C3-C4 were previously the double bonds in butadiene, which originally started at 1.333 Å. In the product they have become sp3 carbons forming single bonds, which lengthen from the reagent, through the transition state, to the product. The C5-C6 bond was the double bond of ethene and underwent the same transition. The C2-C3 bond was the single bond in butadiene, which became the double bond in the product. This was reflected by the shortening of the bond length from 1.471 A to 1.337 Å.
The Van der Waals radius of carbon is 1.7 Å.[5] For a new bond to be forming, double the Van der Waals radii should be less than the “bond” length in the transition state. For carbon, this would be 3.4 Å and the newly forming bonds have an average distance of 2.114 Å in the transition state, showing the orbitals are interacting and a bond is forming. The bond length becomes 1.537 Å, which is the typical C-C carbon single bond length.

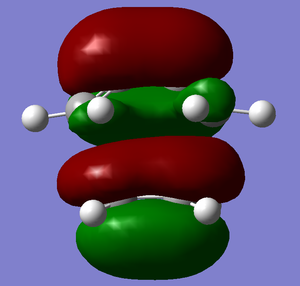
By undertaking a frequency calculation, it is possible to clarify that the transition state has been optimised is the single negative vibration, which corresponds to an imaginary number. This is due to the negative force constant when moving over the maxima of the transition state (with respect to the reaction coordinate) between the two local minima of the reactants and the products. This vibrational mode is shown in Figure 4 and demonstrates the bonding atoms moving towards each other at the same time, which is concordant with the concerted nature of a cycloaddition.
Key file links
Exercise 2: Reaction of cyclohexadiene and 1,3-dioxole
Exercise two investigated the reaction of cyclohexadiene and 1,3-dioxole, as shown in Figure 5 below. This is another [4+2] cycloaddition, which can result in an exo or endo product, depending on the trajectory of approach of the reactants.
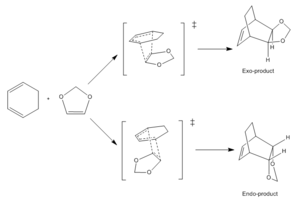
The endo-transition state is lower in energy due to stabilisation via both primary and secondary orbital interactions. Primary orbital interactions are those depicted by the dotted lines in the transition states in the schemes below. The secondary orbital interactions depend on the location of the oxygen atoms. Each O has a lone pair in a p-orbital, which, in the endo-TS is able to stabilise the structure by overlapping with the forming pi-bond and reducing its energy. This causes the endo-product to be the kinetic product as the reaction runs faster through this TS. The exo-product is often lower in energy due to the reduced steric clash, however in this reaction the endo-product is lower as the Hs are further away from each other, resulting in less steric clash, which reduces the energy.[6]
MO analysis
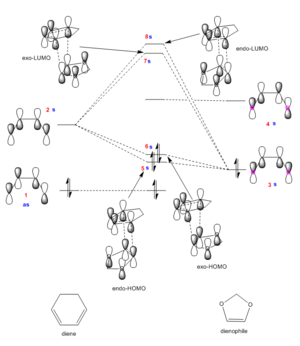
(The dienophile LUMO is antisymmetric. As a result you are neglecting the fact that the remaining MOs can interact to form the HOMO-1 and LUMO+1 Tam10 (talk) 13:22, 10 November 2017 (UTC))
Exo transition state HOMO (orbital 6) |
Exo transition state LUMO (orbital 7) | ||||
Endo transition state HOMO (orbital 5) |
Endo transition state LUMO (orbital 8) |
Figure 6 shows the MO diagram of the Diels-Alder exo- and endo- transition states and molecular orbitals for energy levels 5-8. The MO diagram has been constructed by running a single point energy calculation on the first frame of the IRC. This gives the energy levels of the orbitals of the fragments in relation to each other, enabling identification of the order of the fragment energies and so allowing confirmation that this is inverse electron demand.
The 1,3-dioxole orbitals have been raised in energy due to the oxygens donating their lone pairs to the double bond, making it a more electron rich dienophile. This causes the HOMO of the dienophile being a good energy match to interact with the LUMO of the diene, making the reaction inverse electron demand (which corresponds to the single point energy calculation). This overlap can be seen in the MO diagrams, where the LUMOs show a slightly bigger contribution from the diene LUMO, showing that this orbital is a little higher in energy than the HOMO of the dienophile.
In the Jmols of orbitals 5 and 6 (the endo- and exo-HOMOs), the secondary orbital interaction can only be seen in the endo-TS. It is between the oxygens and the pi-bond that is forming, and acts to stabilise this transition state greater than the exo-TS. The thermodynamics behind this has been explored in the section below.
Thermodynamics analysis
| Reaction | Reaction barrier / kJ mol-1 | Reaction energy / kJ mol-1 |
|---|---|---|
| Exo | 166.02 | -63.19 |
| Endo | 158.26 | -66.75 |
| A table setting out the reaction barrier and the reaction energy for the formation of both the endo- and exo- products. | ||
In table 4, the reaction barrier correlates to the activation energy of the process (the difference between the reactant and transition state energy) and the reaction energy is the change in free energy of the process. All numbers used are from B3LYP calculations because this enables comparison.
As explained in the introduction to exercise 2, the endo-TS is lower in energy than the exo-TS due to secondary orbital interactions. The endo-product is also lower in energy, which is expected due to its structure.
Key file links
Nf710 (talk) 09:53, 16 November 2017 (UTC) this is a good section and you have calculated the correct energies. and made some of the correct conclusions however you have stated which one is the thermodynamic. I see that you put at the end which on was the kenetic.
Exercise 3: Diels-Alder vs Cheletropic
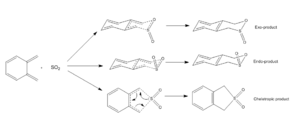
(Fig 7 shows slightly dodgy geometries. Xylylene is planar and the TSs would be more "boat-like" than "chair-like". The reaction also occurs out of plane Tam10 (talk) 13:29, 10 November 2017 (UTC))
This experiment aimed to investigate how the trajectory of approach affected the type of reaction that proceeds. The reaction scheme for the three potential pathways can be seen on the right in Figure 7. The possible products are the exo-, endo- and cheletropic.
According to IUPAC, a cheletropic reaction is a “cycloaddition across the terminal atoms of a fully conjugated system with formation of two new σ-bonds to a single atom of the reagent. There is a formal loss of one π-bond in the substrate and an increase in the coordination number of the relevant atom of the reagent.”[7]
IRC calculations
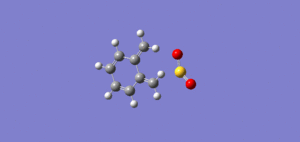
Below, Figures 8-10 are the IRC clips for the three reactions. The exo- and endo- reactions show that the C-O bond forms before the C-S bond. In the cheletropic reaction, the both bonds to the sulfur form at the same time, this is known as a synchronous reaction.
 |
 |
 |
By looking at the IRCs, it is possible to see that the 6-membered ring that is present in the starting material becomes a structure where all Cs in the ring have a 1.5 bond order. This resembles an aromatic structure (as in the final product), which is extremely stable. This causes xylylene to be very unstable as it wants to react to form its aromatic counterpart, via a Diels-Alder reaction.
Thermodynamics
| Reaction | Reaction barrier / kJ mol-1 | Reaction energy / kJ mol-1 |
|---|---|---|
| Exo | 83.01 | -100.60 |
| Endo | 79.07 | -99.96 |
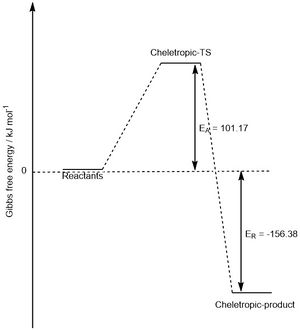
| Cheletropic | 101.17 | -156.38 |
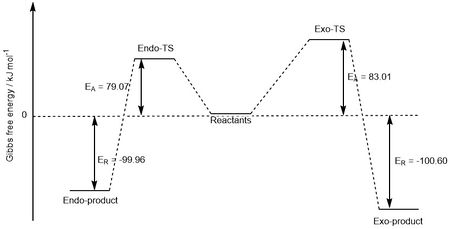
From the table, the kinetic and thermodynamic products can be determined. Here, the kinetic product is the endo-product because it has the lowest reaction barrier (i.e. the transition state energy is the lowest energy), again due to the secondary orbital overlap. The thermodynamic product is the product with the lowest energy, which is the cheletropic product. The chelotropic product is most stable because it still contains two S=O double bonds, which are very strong. The transition state for this reaction is higher in energy though due to the strain of forming a 5-membered ring (less favourable than a 6-membered ring).
This can be visualised by looking at the reaction profiles in Figures 11 and 12 below.
 |
 |
Alternative reaction pathways
Cis-butadiene has a second diene site that can potentially react. By examining it’s reaction barrier, it is possible to explain why it does not react here. The exo- reaction gives an activation energy of 116.75 kJ mol-1 and the endo- reaction gives a value of 108.99 kJ mol-1. The reason for this is the lack of formation of the aromatic ring in the transition state structures, meaning they are less favourable and so have higher in energy. This would always produce a high energy product (relative to reaction at the other site, due to the lack of pi-delocalisation).
(Good analysis. Would be nice to see the geometries here and perhaps a reaction profile like the above to compare visually Tam10 (talk) 13:29, 10 November 2017 (UTC))
Key file links
Conclusion
This lab used two levels of computational calculations, PM6 and B3LYP, to demonstrate the difference between obtaining data quickly which allowed for sufficient comparison (PM6) and the more computationally expensive method which produced results close to that of literature (B3LYP). It can also be noted that using method 3 (forming the products, breaking the bonds then freezing the reacting atoms) is the easiest and most reliable way of finding the transition state as it reduces the amount of guesswork involved.
Chemically, the reactions from exercises 2 and 3 both had the endo-product as the kinetic product. The was due to secondary orbital overlap in the transition state, which lowers its energy, making endo- the faster formed transition state and therefore the reaction that goes to completion more quickly.
References
- ↑ D. S. Kaliakin, R. R. Zaari, S. A. Varganov, J. Chem. Educ., 2015, 92, 2106−2112.
- ↑ E. G. Lewars, Computational Chemistry: Introduction to the Theory And Applications of Molecular and Quantum Mechanics, Springer, New York, 2003.
- ↑ http://cmt.dur.ac.uk/sjc/thesis_prt/node23.html (viewed: 01/11/17)
- ↑ N. C. Craig, P. Groner, and D. C. McKean, J. Phys. Chem., 2006, 110, 7461.
- ↑ S. S. Batsanov, Inorganic Materials, 2001, 37(9), 871–885.
- ↑ I. Flemming, Frontier Orbitals and Organic Chemical Reactions, Wiley, London, 1978, 29-109.
- ↑ https://goldbook.iupac.org/html/C/C01014.html (viewed: 03/11/17)


