Rep:Mod:se7en3ns
Gaussview is a program that allows us to visualise properties of a molecule or an atom that are very fine such as molecular and atomic orbitals, different vibrational modes, process of optimisation of a molecule and so on. In this molecular modelling lab, optimised NH3, H2, N2 and Cl2 molecules were created, then examined using Gaussview program.
Optimised NH3 information
Gaussview program was used to create and optimise NH3 molecule. The latter required Gaussian calculation method which was done by computer. The same calculation type and method have been used for summary data of all 4 molecules.
| Molecule | NH3 |
| Bond distance | 1.01798 Å |
| Bond angle | 105.74116 |
| Calculation type | FREQ |
| Calculation method | RB3LYP |
| Basic set | 6-31G(d,p) |
| E(RB3LYP) | -56.55776873 a.u |
| RMS Gradient Norm | 0.00000485 a.u. |
| Point Group | C3V |
There are important pieces of information missed out in the summary table which are force and displacement. These two parameters ensure that the system has achieved equilibrium and the molecule itself has been properly optimised. These are recorded below, taken directly from optimised ammonia log file where the link is provided below the table.
| Item | Value | Threshold | Converged? | |
| Maximum | Force | 0.000004 | 0.000450 | YES |
| RMS | Force | 0.000004 | 0.000300 | YES |
| Maximum | Displacement | 0.000072 | 0.001800 | YES |
| rms | Displacement | 0.000035 | 0.001200 | YES |
The convergence of the force which is identical to the gradient in an energy-displacement graph being 0 tells that the system has reached equilibrium. The convergence of the displacement which means that the energy of the molecule isn't very responsive to small changes in distance between atoms tells that the molecule has found its most favourable state, being optimised.
Link to the log file: Media:YH_NH3_OPTIMISATION.LOG
optimised NH3 molecule |
Non-linear molecule such as NH3 follows 3N-6 number of vibrational modes where N represents number of atom in that molecule. Thus, NH3 would have 6 different vibrational modes which is consistent with the Gaussview results. Vibrational mode number 2 and 3 both occur at a frequency of 1694.60 and 5 and 6 at 3586.17 which shows that they are degenerate, respectively. Vibrational mode 1,2, and 3 represent bond bending and 4,5 and 6 represent bond streching. Within bond stretching modes 4 is the only mode with high symmetry. Although vibrational mode 1 shows symmetry in one axis, it doesn't throughout different axis of symmetry and thus cannot be considered of having high symmetry. Vibrational mode 1 is the umbrella vibrational mode.
In the IR spectrum, only 2 peaks are expected to show and is what the IR spec ran by Gaussview represents. The intensity of the vibrational mode for 1 is too big that the graph is unlikely to represent vibrational mode 4,5 and 6 with intensity of 1.0608 and 0.2711. While vibrational mode 2 and 3 are expected to show peaks in the graph, they are degenerate and thus would be represented at the same peak instead of having 2 seperate peaks. The intensity for vibrational mode 4,5 and 6 are small due to having small dipole moment in these stretches.
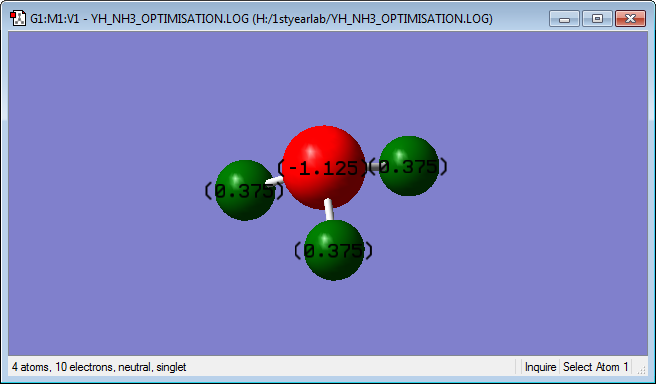
NH3 molecule is charged as the difference in electronegativity between nitrogen and hydrogen atoms is big. The charge in the nitrogen atom is -1.125 and the three hydrogen atoms bonded to the nitrogen are 0.375.
Optimised H2 information
The same procedure has been repeated for creating and optimising a H2 molecule. Since H2 and rest of the molecules examined from now on are linear molecules which are symmetrical, point grouping is not used.
| Molecule | H2 |
| Bond distance | 0.74279 Å |
| Bond angle | 180 |
| Calculation type | FREQ |
| Calculation method | RB3LYP |
| Basic set | 6-31G(d,p) |
| E(RB3LYP) | -1.17853936 a.u. |
| RMS Gradient Norm | 0.00000017 a.u. |
H2 molecule has force and displacement much closer to 0 compared to NH3 molecule and this can be due to it being much smaller and a simple atom with 1 electron and 1 proton. Since it is a linear molecule, this could have made the calculation for force and displacement much consistent with the what's expected of optimised molecule.
| Item | Value | Threshold | Converged? | |
| Maximum | Force | 0.000000 | 0.000450 | YES |
| RMS | Force | 0.000000 | 0.000300 | YES |
| Maximum | Displacement | 0.000000 | 0.001800 | YES |
| rms | Displacement | 0.000001 | 0.001200 | YES |
Link to the log file: Media:YH_H2_OPTIMISATION.LOG
optimised H2 molecule |
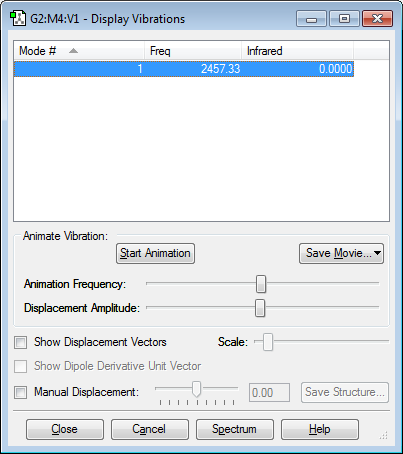
Following the 3N-5 rule for linear molecules, H2 molecule has only 1 vibrational mode and this matches with the Gaussview result. The mode represents a bond stretch. The animation in the Gaussview seems to be with some errors as the stretch of the bond is too big that it overlaps between the hydrogen molecule which shouldn't be happening. The IR spectrum is not expected to show any peaks as there aren't any dipole moment in linear bond stretches, bonds having same atom in either end of the bond.
Diatomic molecule consisting same atoms such as H2, N2 and Cl2 do not have any charges on them as the electronegativity cancels out and the electron is distributed evenly.
Optimised N2 information
| Molecule | N2 |
| Bond distance | 1.10550 Å |
| Bond angle | 180 |
| Calculation type | FREQ |
| Calculation method | RB3LYP |
| Basic set | 6-31G(d,p) |
| E(RB3LYP) | -109.52412868 a.u. |
| RMS Gradient Norm | 0.00000060 a.u. |
As explained before for H2 molecule, the force and displacement is much closer to 0 as it is once again a simple linear molecule which involves two atom bonding to each other. The convergence of these two parameters once again show that the molecule is properly optimised.
| Item | Value | Threshold | Converged? | |
| Maximum | Force | 0.000001 | 0.000450 | YES |
| RMS | Force | 0.000001 | 0.000300 | YES |
| Maximum | Displacement | 0.000000 | 0.001800 | YES |
| rms | Displacement | 0.000000 | 0.001200 | YES |
Link to the log file: Media:YH_N2_OPTIMISATION.LOG
optimised N2 molecule |
N2 is a linear molecule and thus follows 3N-5 rule. As there are two atoms in the molecule, there is only one vibrational mode just like H2 molecule which represents a bond stretch.
Energy for the reaction N2 + 3H2 --> 2NH3
The enthalpy of reaction is usually calculated using bond enthalpy of each bonds broken and formed. In this case this would mean bond enthalpy for breaking 1 NN triple bond and 3 HH single bonds and bond enthalpy for forming 6 NH single bonds. However, using the Gaussview summary information, the calculation used involves energy of the optimised molecule itself instead of using individual bond enthalpies.
E(NH3) = -56.55776873 a.u., E(H2) = -1.17853936 and E(N2) = -109.52412868. As the balanced equation suggests, the reaction involves single molecule of N2, 3 molecules of H2 and 2 molecules of NH3 and thus for the calculation, each energies are multiplied to respective coefficient.
ΔE=2*E(NH3)-[E(N2)+3*E(H2)]= 2*-56.55776873 - (-109.52412868 - 3*1.17853936) unit in a.u. which is -0.0557907 a.u. Since 0.01kJmol^-1 equals to 0.0000038 a.u., -0.0557907 is divided by 0.0000038 and then multiplied 0.01 to conver the units into kJmol^-1 which gives -146.81763kJmol^-1. The sign of the change in energy is negative which shows that the reaction is exothermic.
The literature value is -92.0kJmol^-1.[1] By percentage error calculation, this shows that the change in energy calculated from energy of optimised molecule itself is 59.6% off from the literature value.
Optimised Cl2 molecule
| Molecule | Cl2 |
| Bond distance | 2.04174 Å |
| Bond angle | 180 |
| Calculation type | FREQ |
| Calculation method | RB3LYP |
| Basic set | 6-31G(d,p) |
| E(RB3LYP) | -920.34987886 a.u. |
| RMS Gradient Norm | 0.00002511 a.u. |
| Item | Value | Threshold | Converged? | |
| Maximum | Force | 0.000043 | 0.000450 | YES |
| RMS | Force | 0.000043 | 0.000300 | YES |
| Maximum | Displacement | 0.000094 | 0.001800 | YES |
| rms | Displacement | 0.000172 | 0.001200 | YES |
Link to the log file: Media:YH_CL2_OPTIMISATION.LOG
optimised Cl2 molecule |
A linear molecule such as Cl2 follows the 3N-5 rule and thus there is only one vibrational mode which is a bond stretch. There is no dipole moment and thus the bond stretching mode of Cl2 molecule would not show up in the IR spectrum and this is confirmed by Gaussview IR spectrum.
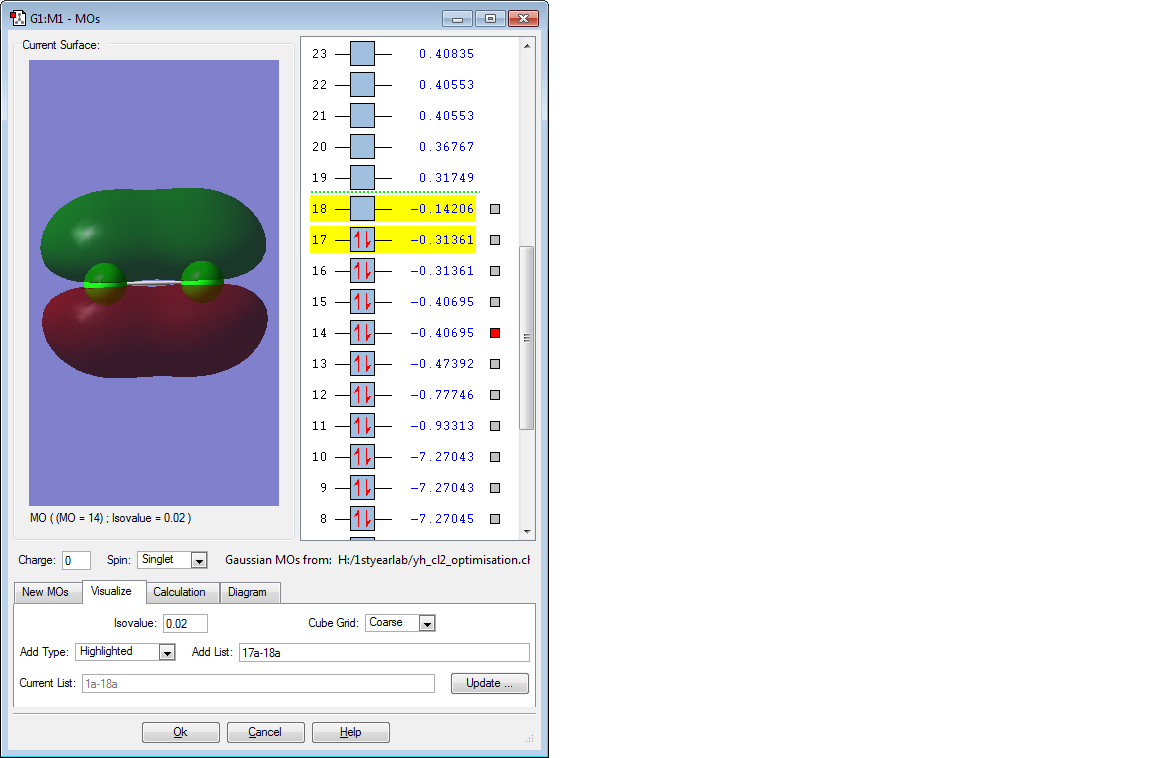
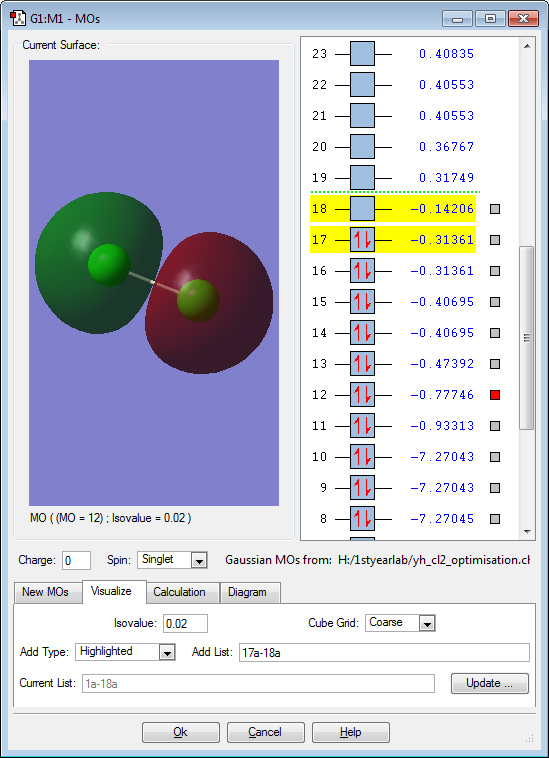
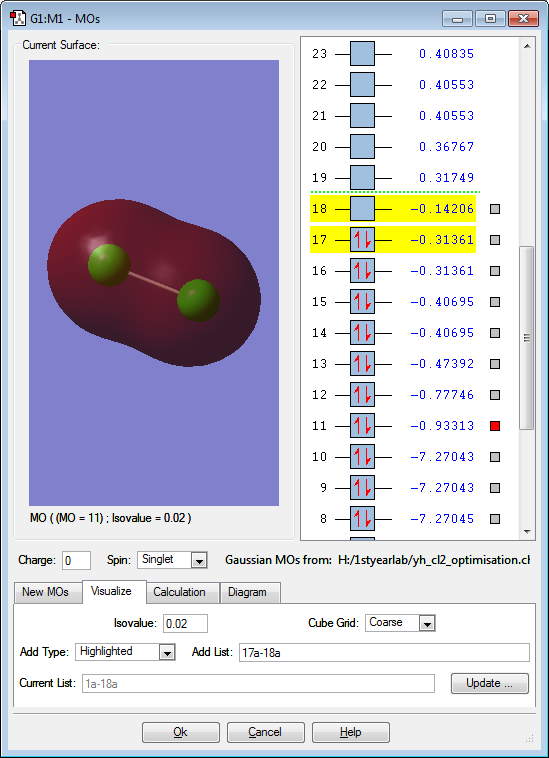
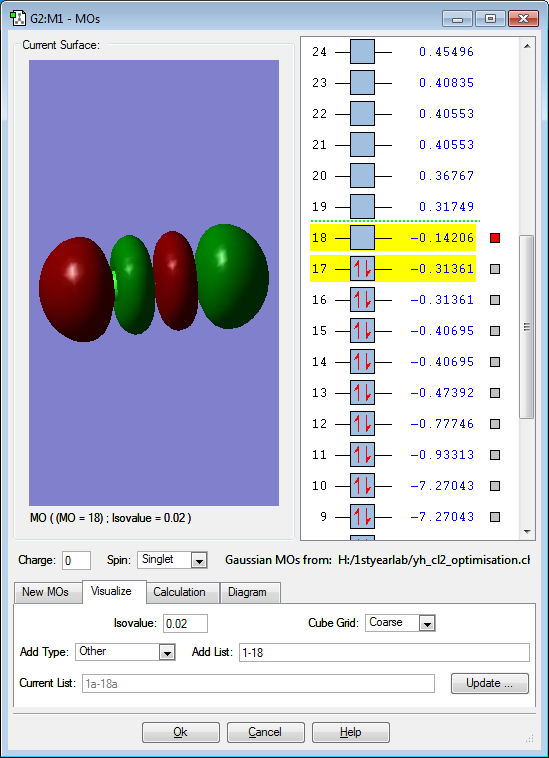
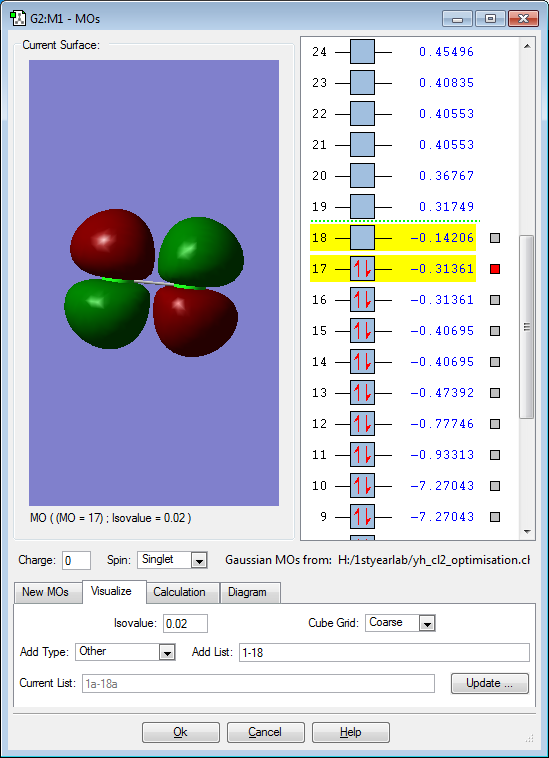
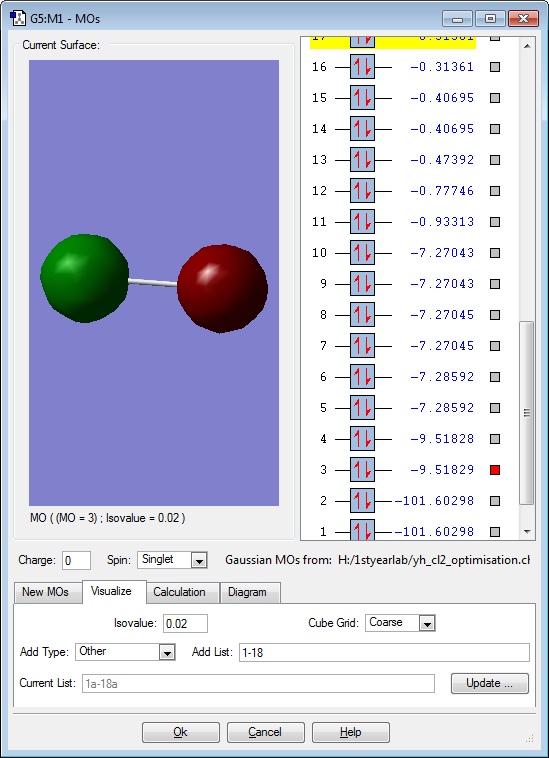
These are the molecular orbitals in Cl2 molecule present in principal energy level n=3.
This molecular orbital represents a bonding orbital formed from linear interaction of 3p orbitals of each chlorine atom in phase to each other. The two colour represents the phase of each orbital. The green phase interaction of 3p orbital from each chlorine atom shows that the interaction is in phase.
This molecular orbital represents a bonding orbital formed from parallel interaction of 3p orbitals of each chlorine atom but in different axis relative to the previous molecular orbital. This represents a bonding orbital because each pi orbital is interacting in phase to each other. While Cl2 is a molecule made up of single bond between the two chlorine atom, the parallel interaction of two p orbital which is the definition of pi bond is present. This shows that the parallel interaction of the p orbital is not influential enough to be shown as a bond in Cl2 molecule.
This molecular orbital represents an anti-bonding orbital formed from two 3s orbitals interacting anti-phase to each other. As expected of anti-bonding orbital, the energy of this orbital is much higher than the bonding orbital formed from in-phase interaction of two 3s orbitals
This molecular orbital represents a bonding orbital formed from two 3s orbitals interacting in-phase to each other. This molecular orbital is what represents the sigma bond between Cl2 which means that it can also be considered as the most stable and predominant interaction of two orbitals.
This molecular orbital is an anti-bonding orbital formed from anti-phase linear interaction of 2 3p orbitals and at the same time is the lowest unoccupied molecular orbital. The Cl2 sigma bond would break when the electron fills up in this molecular orbital.
This molecular obital is once again an anti-bonding orbital formed from anti-phase parallel interaction of 2 3p orbitals and at the same time is the highest unoccupied molecular orbital. There is another degenerate molecular orbital that formed from interaction at different axis but in the same arrangement. These are the molecular orbital that contains electrons that are most readily available for bond forming
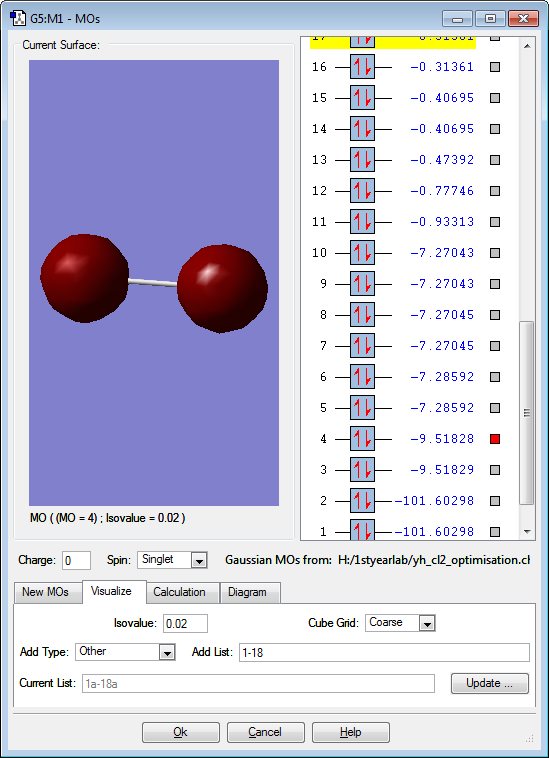
These two orbitals are not consistent with our knowledge of energy of orbitals and thus are included. The anti-phase positioning of 1s atomic orbitals are lower in energy than in-phase positioning of 1s atomic orbitals which in fact should be the opposite. This could be due to rounding errors made during the calculation and refers that they are so similar in energy and stable at the same time, difference of 0.00001 is insignificant.
References
Template loop detected: Template:Reflist
- ↑ Shakhashiri, Bassam. "Ammonia, NH3". www.scifun.org. N.p., 2008. Web. 4 Mar. 2016.


