Rep:Mod:sc4011 1C
1C Computational Lab
In previous decades, the interpretation of reaction outcomes from experimental results has been a rather difficult task. Our recent advances in technology however grant us the computational power needed to allow calculations to be made on a much more convenient timescale. Computational organic chemistry is about representing and manipulating the structures and reactivity of molecules and thus grants us with much more predictive ability than ever before.
The work presented in this article tries to bridge theory with experiment, as its main objective is to run calculations and then compare them with already reported experimental results. The first part of this article devotes itself in predicting the structure and reactivity of already well studied compounds and then drawing comparisons with crystallographic and analytical data. The second part of this work aims to verify the identity of two compounds made earlier in a synthetic lab by simulating their NMR, optical rotation, VCD and then comparing it with known values.
The software used in this study include Avogadro 1.1, Avogadro 2.0, Gaussian 9.0, Mercury and Conquest.
Part I - Conformational Analysis using Molecular Mechanics
Stability of Cyclopentadiene dimers

The dimerization of cyclopentadiene is the spontaneous [π4s + π2s] cycloaddition reaction of two cyclopentadiene molecules to give dicyclopentadiene. As one would expect from Woodward-Hoffmann's rules, this thermal 4n+2 electron reaction proceeds via Huckel transition state with both diene and dienophile components being suprafacial.
Such a suprafacial approach can occur in two different ways, both of which are illustrated in figure 1. In particular, the cyclopentadiene acting as the dienophile can approach the cyclopentadiene acting as the diene with its substituents directed away (exo approach) or towards the diene (endo approach). The consequence of this different approach results in a different stereochemical outcome of the final product.
At 'chemical' temperatures, the endo-product is observed predominately whereas the exo product has been reported to form only at extremely high temperatures[1]. This is in contrast to what one would expect from a thermodynamic point of view as the exo-product is the thermodynamically more stable cycloadduct, hinting that the reaction proceeds under kinetic control. In order to interpret this phenomenon, one needs to investigate the transition state of the reaction. The transition state arising from an endo-approach shows overlap of the π bond of the dienophile, not participating in bond formation, with the diene's frontier orbital. This interaction lowers the activation energy barrier of the formation of the endo product and thus the endo is the kinetic product. Such overlaps are termed as secondary interactions[1] as they are not participating in bond formation themselves, but rather help stabilize the transition state. No such orbital overlap is observed in the transition state arising from an exo-approach and hence the transition state of such an approach is less stabilized.
In order to demonstrate the different thermodynamic stability of the two cycloaddition adducts, both compounds were optimized using a molecular mechanics calculation using the 'MMFF94s' force field and the 'Conjugate Gradients' algorithm using the Avogadro 1.1 software.
Table 1 shows a summary of the individual energy components that make up the total energy of each compound. As predicted, the total energy of the endo-product is indeed higher than that of the exo. Investigation of the individual energy breakdown of the two cycloadducts shows that while the stretching, torsional and Van der Walls energies of the two compounds are really similar, there is a distinction in the energetics that arise from angle bending and electrostatic interactions. When comparing the angle bending energy difference to the total energy difference of the two compounds, one finds that the angle bending term accounts for 85.8% of the total energy difference of the two isomers and hence is the most dominant contributor to the thermodynamic instability of the endo product.
| Endo dimer | Exo dimer | ||||||
|---|---|---|---|---|---|---|---|
|
|
In order to pinpoint the origin of this deviation an analysis of the bond angles of both compounds was made. It was found that the C-C-C bond angle at the ring junction of both dimers deviates significantly from 109.5o, the ideal bond angle for sp3 hybridized centers. In particular the endo product shows a C-C-C angle of 118.6o, whereas the exo product shows a C-C-C angle of 115.6o. Hence, the endo product shows a higher angle bending deviation, owed to the orientation of the five membered ring which forces the sp3 carbons to deviate from the ideal tetrahedral geometry. This results in a higher energy value for the endo product. It is also worth noting that the C-C-C angle between the ring carbons and the bridgehead group is 93.6o. This indicates large angle bending because of the bridgehead methine group, however since this value is the same for both dimers it doesn't contribute to their energy difference.
Stability of hydrogenated dimers
The total hydrogenation of bicyclopentadiene has been observed[2] to occur sequentially. In particular, the double bond on the five membered ring is reduced preferentially, whereas the π bond at the norbornene ring requires prolonged hydrogenation to react.
In order to provide an interpretation for this phenomenon, both alkene products that could possibly emerge from the first hydrogenation step were optimized using the molecular mechanics 'MMFF94s' force field and the 'Conjugate Gradients' algorithm. Such calculation would allow one to compare the thermodynamic stability of the two products and hence deduce which product is more likely to form. The software used for this calculation was avogadro 1.1.

As one can tell from the results found in table 2, the norbornene alkene is higher in energy by 39.66 kJ mol-1 and is thus thermodynamically unstable with respect to the cyclopentene alkene. This is in accordance to what one would expect from the sequential hydrogenation results[2] as the lower energy alkene is formed first. This therefore indicates that the reaction is under thermodynamic control.
The energy differences of the two alkene's arise predominately due to bond angle bending and differing Van der Walls interactions. The bending energy is higher for the norbornene alkene, owed to the strain introduced to the ring by both the double bond, as well as the methine bridge. In particular, the bond angle of the sp2 norbornene alkene is 107.2o and therefore deviates far from the ideal value of 120o. Hence the relief of this angle bending that arises from the reduction of the norbornene double bond provides the thermodynamic impetus that drives the reaction and results in preferential hydrogenation of the norbornene alkene.
| Norbornene Alkene | Cyclopentene Alkene | ||||||
|---|---|---|---|---|---|---|---|
|
|
In terms of Van der Walls interactions, the cyclopentene alkene's ring junction hydrogens (H11 and H12) shows strong, attractive VdW interactions (2.46 Å and 2.47 Å) with adjacent hydrogen atoms. (H17 and H22 respectively). For the norbornene alkene this strong attraction term is not as pronounced as the equivalent hydrogen for that system is farther away in space with the hydrogen atoms that are in equivalent positions to the ones discussed earlier. This results in lower stabilization of the latter. Furthermore, in the norbornene alkene the distances of the axial hydrogen atoms are shorter than 2.4 Å, ranging from 2.2 Å to 2.3 Å and thus are destabilizing. For the cyclopentene alkene however there are less such interactions as it lacks two axial hydrogens due to the presence of the double bond. From the above observations, it is clear that the norbornene alkene is overally less stable in terms of Van der Walls interactions.
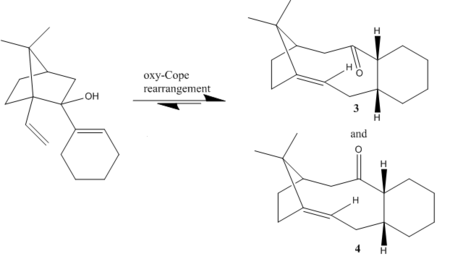
A great example to demonstrate the use of conformational analysis to predict reactivity is the ketone showed in figure 3 that exists as two atropisomers. Paquette et al.[3] proposed the synthesis of this ketone, a key intermediate product in the total synthesis of Taxol from a retro oxy-cope rearrangement of the carbinol also seen in figure 3.
Atropisomerism arises from high rotational barriers that do not allow a compound to interconvert to another conformer at 'chemical' temperatures. This high barrier of rotation hence results in two distinct isomers. For instance, atropisomerism in this ketone arises from the restricted C-C bond rotation at the ring junction that results in the carbonyl group to be either facing in the same direction as the isopropyl bridge, or opposite to it.
What Paquette et al.[3] demonstrated is that the [3,3] sigmatropic rearrangement reaction can proceed under equilibrating conditions and hence the thermodynamic ketone product should be obtained predominately. In order to verify the selectivity of the reaction towards the thermodynamic product, a molecular mechanics calculation using the 'MMFF94s' force field was adopted. The algorithm used was 'Conjugate Gradients' and the calculation was ran using the Avogadro 1.1 software.
It is a well known fact that in systems with ring junctions, the smaller ring's conformation determines the conformation of the larger ring[4], provided that the small ring is composed of 6 or less atoms. This is because the larger ring is less constrained in space and hence more able to adapt its geometry, in contrast to smaller rings. Both ketone systems are composed of a six membered and a ten membered ring. A six membered ring generally has four minima which correspond to two chair and two twist boat conformations. By altering the geometry of the six membered ring to the two chair and two twist boat conformations all minimun energy conformations of both compounds were obtained.
| Energy contributions | Chair (1) | Twist boat (1) | Chair (2) | Twist boat (2) |
|---|---|---|---|---|
| Stretching energy (kcal mol-1) | 7.14137 | 7.75414 | 8.47171 | 7.76572 |
| Bending energy (kcal mol-1) | 22.17606 | 19.07266 | 21.48928 | 19.03104 |
| Torsional energy (kcal mol-1) | -1.66145 | 3.65645 | 7.52766 | 4.43280 |
| Van der Walls interactions (kcal mol-1) | 32.23893 | 35.06682 | 35.81436 | 35.02040 |
| Electrostatic energy (kcal mol-1) | 0.81663 | -0.06875 | 0.40117 | -0.04509 |
| Total energy (kcal mol-1) | 60.55322 | 66.30350 | 75.05571 | 68.87773 |
From the results in table 3, one can see that the most stable conformer of ketone 3 is chair (1) whereas the highest energy conformer is chair (2). While the former is expected for a chair conformation to be the lowest energy minima, the other chair seems to be breaking the rule! The main reason that contributes to this deviation is the really high torsional energy that chair (2) exhibits which is an outcome of the massive torsion it has to undergo in order to have the two hydrogen atoms on the ring junction in an axial-equitorial arrangement.
| Energy contributions | Chair (1) | Twist boat (1) | Chair (2) | Twist boat (2) |
|---|---|---|---|---|
| Stretching energy (kcal mol-1) | 8.48915 | 8.12327 | 7.68874 | 8.36302 |
| Bending energy (kcal mol-1) | 33.71490 | 31.17642 | 28.31389 | 34.18372 |
| Torsional energy (kcal mol-1) | 3.24791 | 3.88139 | 0.16130 | 6.97225 |
| Van der Walls interactions (kcal mol-1) | 35.43764 | 33.47799 | 33.16957 | 36.74636 |
| Electrostatic energy (kcal mol-1) | 0.19632 | 0.31464 | 0.30282 | 0.16218 |
| Total energy (kcal mol-1) | 82.77345 | 78.01402 | 70.54436 | 88.48663 |
Similar results are obtained for the ketone 4 atropisomer. Chair (2) is the lowest energy conformer again, however the highest energy conformer is no longer the other chair configuration but rather the twist boat (2)conformer. Twist boat (2) suffers from torsional strain that arises on the ten membered ring as with the ketone pointing in the same direction as the isopropyl bridge, the backbone has to now flip by 90o to accommodate this. Such arrangement therefore exhibits a significant amount of transannular interactions that result in Hydrogen atoms on the ten membered ring to be too close in space and hence result in highly repulsive Van der Walls interactions.
Comparison of the two lowest energy conformers:
| Energy contributions | Ketone down - chair (1) | Ketone up - chair (2) |
|---|---|---|
| Stretching energy (kcal mol-1) | 7.14137 | 7.68874 |
| Bending energy (kcal mol-1) | 22.17606 | 28.31389 |
| Torsional energy (kcal mol-1) | -1.66145 | 0.16130 |
| Van der Walls interactions (kcal mol-1) | 32.23893 | 33.16957 |
| Electrostatic energy (kcal mol-1) | 0.81663 | 0.30282 |
| Total energy (kcal mol-1) | 60.55322 | 70.54436 |
In order to determine which of the two ketone atropisomers is gonna be the oxy-Cope product that arises under equlibrating conditions, one can has to determine which atropisomer is the most thermodynamically stable. Table 5 summarizes the individual energy contributions of the lowest energy conformers of each atropisomer.
As one can tell, ketone 3 is far lower in energy than the corresponding lowest energy conformer of ketone 4. The energy difference between the two is equal to 41.86 kJ mol-1. Such large energy difference indicates that under thermodynamic conditions, only ketone 3 is going to form.
Hyperstable Alkenes
According to Bredt's rule, double bonds at ring junctions are unstable and therefore highly reactive. However, hydrogenation of alkene 3 wasn't observed to proceed readily[4] but rather it required extended periods of time. In order to rationalize why the subsequent hydrogenation of alkene 3 fails short of expectations, one has to consider the relative stability between the alkene and its parent alkane derivative.
A molecule mechanics calculation using the 'MMFF94s' force field and the 'Conjugate Gradients' algorithm was performed using Avogadro 1.1 in order to investigate the energetics of the parent alkane.
| Energy contributions | Alkene |
Alkane |
|---|---|---|
| Stretching energy (kcal mol-1) | 7.14137 | 7.23855 |
| Bending energy (kcal mol-1) | 22.17606 | 25.87416 |
| Torsional energy (kcal mol-1) | -1.66145 | 7.04373 |
| Van der Walls interactions (kcal mol-1) | 32.23893 | 33.30454 |
| Electrostatic energy (kcal mol-1) | 0.81663 | 0.00000 |
| Total energy (kcal mol-1) | 60.55322 | 73.78079 |
From the molecular mechanics results, it seems that the parent alkane is less thermodynamically stable by about 55.4 kJ mol-1. This is contrast to what one would expect from an alkene, let alone a bridgehead variant! By noting the energy difference of the two species, one can see that the alkane is more bended, rather than the alkene. Furthermore, of interest is the high torsional energy of the alkane, relative to that of the olefin. A practical way to quantify alkene to alkane stability is by defining the Olefinic Strain[4] term. The OS is obtained by substracting the total strain of the most stable conformer of the alkane to that of that of the alkene. It is a really useful quantity when describing this behavior of alkenes as it is related to the energy change accompanied by the hydrogenation reaction[4]. In this case, it is clear the the OS is negative indicating low ΔH of hydrogenation and also higher stability of the alkene relative to the alkane.
| Norbornene Alkene | Parent Alkane | ||||||
|---|---|---|---|---|---|---|---|
|
|
Computational results[5] by J. Kim showed that while for small alkene rings, bridgehead olefins are highly reactive due to their high OS values, their stability increases dramatically as the size of the ring increases. Furthermore, the same author suggests that the major contributor to the energy relief when the alkene is formed is the decrease in bending energy. The change of hybridization from sp3 to sp2 flattens the bridgehead ring and relieves it from significant angle bending present in the sp3 state of its alkane derivative. In particular, one can see at the rotatable image presented to the left that the C-C-C angle at the ring junction for the alkane is more than 120o, quite a large difference from the ideal 109.5o tetrahedral geometry of an sp3 center. As the shift to sp2 hybridization minimizes angle bending, it is believed that this is the origin to the hyperstability of the alkene.
Molecular Mechanics Calculations

The di-thiol derivatives (17) and (18) result from the oxy-cope products investigated earlier. In order to demonstrate the predictive power of computational organic chemistry, both compounds illustrated in figure 4 were first optimized using the molecular mechanics 'MMFF94s' force field and the 'Conjugate Gradients' algorithm using the Avogadro 1.1 software. From this analysis, low energy conformers of both (17) and (18) were obtained and as such allowed to see which is the thermodynamically more stable one.
| Energy contributions | Ketone 17 chair |
Ketone 18 | |
|---|---|---|---|
| Chair | Twist boat | ||
| Stretching energy (kcal mol-1) | 15.03742 | 14.40483 | |
| Bending energy (kcal mol-1) | 30.96545 | 28.75903 | |
| Torsional energy (kcal mol-1) | 9.70311 | 13.39726 | |
| Van der Walls interactions (kcal mol-1) | 49.27499 | 50.46087 | |
| Electrostatic energy (kcal mol-1) | -6.06523 | -6.14706 | |
| Total energy (kcal mol-1) | 100.45078 | 102.39899 | |
The only viable low energy minimun of compound 17 was found to adopt a chair conformation of the six membered ring. However it is higher in energy than both other conformers of 18 and hence it was determined that it is thermodynamically more unstable. This is in agreement with the previous results obtained from the two atropisomers as the carbonyl pointing away from the isopropyl bridge was again lower in energy. All other conformers were found to be significantly higher in energy and therefore not viable[6] at standard conditions. Due to the large difference in energy of compound 17's conformers, one could go further as to identify them as distinct atropisomers[6] of 17.
For compound 18 there are two viable, low energy, conformations. One of them corresponds to a chair conformation of the cyclohexane ring while the other to a twist boat conformation. While the energy of the two conformations doesn't differ by a significant amount, there are some distinct differences that can be seen in their individual energy contributions.
For compound 18, one can see that while it has higher Van der Walls and Angle Bending energies, it is the lower energy conformer. A closer inspection shows that the torsional energy is the main benefactor of the energy difference of the two conformers. When in the chair conformation of the cyclohexane ring, the ten membered ring binds in an axial-equitorial fashion which allows it to minimise steric crowding and torsional strain. However, when the cyclohexane is in a twist boat conformation, both termini of the ten membered ring are found in an equitorial mode, with respect to the six membered ring. This forces the larger ring to sit in a rather constrained arrangement in space, almost planar. This results in overall destabilization of the conformer, rendering it the less predominant configuration.
Free Energy considerations
Free energy comparisons between isomers can yield valuable information such as the relative abundance of one species to another. This is a really important factor to consider when running NMR simulations as the DFT based B3LYP method employed in this study does not account for the fluxionality of the molecule. Such examples include rapid rotations of methyl groups and inter-conversions between conformers. This means that the simulated NMR will correspond to only one of the conformers rather than a weighted average of the two. Therefore, in order to draw proper comparisons with the literature[6], one has to account for all major conformers that might be present in solution as the experimentally obtained NMR will show a weighted average signal obtained by the relative abundance of the conformers present.
All free energies were obtained using the B3LYP method at the 6.31g (d,p) level.
Free energy comparison of the atropisomers 17 and 18:
Dithiol 17 free energy:
Sum of electronic and thermal Free Energies= -1651.448831
Dithiol 18 (chair) free energy
Sum of electronic and thermal Free Energies= -1651.463258
hartees
kJ mol-1
Furthermore, since:
, .
The above equilibrium constant indicates that nearly all of the dithiol present in solution is the 18 atropisomer. Hence an NMR investigation can be conducted on dithiol 18 without the need of running an NMR of 17 and then performing a weighted average.
Free Energy calculation of two conformers:
The free energies of the two major conformers of 18 were obtained using the DFT method used earlier. From that, it was found that the free energies of the two conformers were relatively similar. If both conformers were present in high abundance in solution, this would have a notable impact on the appearance of the experimentally obtained NMR spectra. In order to assess whether it was necessary to run an NMR simulation of both conformers, a free energy comparison was made between the two as to find their relative ratios in solution.
Chair conformation:
Sum of electronic and thermal Free Energies= -1651.463258
Twist boat conformation:
Sum of electronic and thermal Free Energies= -1651.462782
From the above free energy values, the difference in free energy between the two conformations was calculated and hence the equilibrium constant allowed the deduction of their overall ratios in solution by use of the Arrhenius equation. By substracting the free energy of the twist boat conformation from that of the chair conformation, the relative abundance of the latter was found with respect to the former.
hartees
kJ mol-1
Furthermore, since:
, .
This indicates that the twist boat conformation exists in a 3/5 ratio with respect to the chair conformation and therefore must be included in the NMR comparison with the literature.
It was decided to simulate the NMR spectrum of both dominant conformers of the compound. The alternative would be to run a time-dependent DFT calculation using a TD-SCF method but that would require an enormous amount of computational time for such a large molecule.
NMR simulation
Using a B3LYP method and a 6.31G(d,p) basis set, the structures of the two conformers were optimized in CHCl3 solvent using a polarizable conductor calculation model (CPCM). The GD3 dispersion model was used as to allow the short range dispersion contributions to be accounted for. The compounds then underwent frequency analysis using the same level of calculation and their simulated NMR spectra were finally obtained, again, using calculations of the same sophistication level. The DOI hyperlinks are provided in the summary tables below.
| 1H NMR | 13C NMR | |
|---|---|---|
| Chair |  |

|
| Twist boat |  |

|
1H NMR assignment and analysis
| Computed δ(ppm) DOI:10042/26531 |
Integral | Reported[6] δ (ppm) |
|---|---|---|
| 5.98 | 1 | 5.21 (1H, s) |
| 3.2 | 2 | 3-2.7 (6H, m) |
| 3.06 | 1 | |
| 2.97 | 1 | |
| 2.78 | 3 | |
| 2.66 | 1 | 2.7-2.35 (4H, m) |
| 2.48 | 3 | |
| 2.33 | 1 | 2.2-1.7 (6H, m) |
| 2.23 | 1 | |
| 2.01 | 3 | |
| 1.84 | 1 | 1.58 (1H, t) |
| 1.58 | 4 | 1.5-1.2 (3H, m) |
| 1.28 | 3 | 1.1 (3H, s) |
| 1.21 | 1 | 1.07 (3H, s) |
| 0.96 | 3 | 1.03 (3H,s) |
| 0.64 | 1 |
| Computed δ(ppm) DOI:10042/26538 |
Integral | Reported[6] δ (ppm) |
|---|---|---|
| 5.38 | 1 | 5.21 (1H, s) |
| 3.36 | 1 | 3-2.7 (6H, m) |
| 3.15 | 1 | |
| 3.05 | 1 | |
| 2.98 | 1 | |
| 2.84 | 1 | |
| 2.55 | 1 | |
| 2.45 | 2 | 2.7-2.35 (4H, m) |
| 2.22 | 1 | |
| 2.11 | 2 | |
| 1.99 | 4 | 2.2-1.7 (6H, m) 1.58 (1H, t) |
| 1.87 | 1 | |
| 1.78 | 2 | |
| 1.68 | 1 | 1.5-1.2 (3H, m) |
| 1.53 | 2 | |
| 1.41 | 1 | 1.1 (3H, s) |
| 1.32 | 1 | |
| 1.11 | 4 | 1.07 (3H, s) |
| 0.98 | 2 | 1.03 (3H,s) |
As it can be seen from the above results, the simulated 1H NMR show good agreement with the literature[6] correctly predicting the majority of the chemical shifts and environments. A mismatch is seen with respect to the multiplicity of the proton peaks, something that arises from the in-built limitations of the calculation. Such is the inability to account for fluxionality effects mentioned earlier, but also the degeneracy tolerance set for the software which causes some protons to be considered as magnetically equivalent.
When considering the differences of the two conformers, one immediately notices that the olefinic proton is considerably more deshielded in the chair conformation than it is for the twist boat, with the latter being in better agreement with the literature[6]. In order to explain this phenomenon, one has to consider the shielding effects that arise from Van der Walls interactions[7]. In particular, the twist boat conformation shows four protons that are in the close vicinity of the olefinic proton (< 2.53Å). This is in contrast to the olefinic proton of the chair conformation which shows only two significant Van der Walls interactions with other H atoms. It is therefore believed that the constrained arrangement that arises from the twist boat conformation results in more Van der Walls interactions being present at the olefinic proton and this therefore contributes in overall shielding of its chemical shift.
It should be noted that while a more extensive comparison with the literature is done in the following 13C NMR assignment, it was not a possible to replicate the same procedure for the 1H NMR assignments as the literature not only has grouped many proton environments and labeled them simply as "multiplets", but has also failed to provide the raw 1H NMR spectra obtained for the compound. Thus an attempt at a more in depth comparison was deemed to be not fruitful. As a last point, due to time constrains no spin coupling calculations were performed for this assignment as the sheer amount of proton environments this molecule possesses demands an enormous amount of computational time.
13C NMR spectrum analysis
| Computed δ(ppm) DOI:10042/26531 |
Reported[6]δ(ppm) | 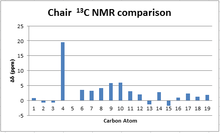 |
|---|---|---|
| 212.23 | 211.49 | |
| 148.07 | 148.72 | |
| 120.138 | 120.9 | |
| 94.11 | 74.61 | |
| 60.42 | 60.53 | |
| 54.88 | 51.30 | |
| 54.20 | 50.94 | |
| 49.69 | 45.53 | |
| 49.14 | 43.28 | |
| 46.77 | 40.82 | |
| 41.79 | 38.73 | |
| 38.74 | 36.78 | |
| 34.13 | 35.47 | |
| 33.65 | 30.84 | |
| 28.15 | 30.00 | |
| 26.46 | 25.56 | |
| 24.54 | 22.21 | |
| 22.62 | 21.39 | |
| 21.72 | 19.83 |
| Computed δ(ppm) DOI:10042/26538 |
Reported[6]δ(ppm) | 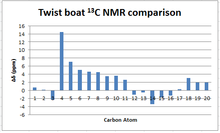 |
|---|---|---|
| 212.24 | 211.49 | |
| 148.89 | 148.72 | |
| 118.55 | 120.9 | |
| 89.06 | 74.61 | |
| 67.58 | 60.53 | |
| 56.31 | 51.30 | |
| 55.54 | 50.94 | |
| 50.09 | 45.53 | |
| 46.82 | 43.28 | |
| 44.47 | 40.82 | |
| 41.30 | 38.73 | |
| 37.68 | 38.73 | |
| 36.28 | 36.78 | |
| 32.08 | 35.47 | |
| 29.07 | 30.84 | |
| 28.70 | 30.00 | |
| 25.86 | 25.56 | |
| 25.21 | 22.21 | |
| 23.28 | 21.39 | |
| 21.74 | 19.83 |
When comparing the simulated 13C NMR with the literature, it can be seen that the calculation shows a consistent positive error with respect to the experimental values. This could be attributed to the modern notion of using external reference samples of TMS when conducting an NMR measurement rather than dissolving the TMS in solution. The optimization of TMS used in this study was done in a chloroform solvent at calculations of the same sophistication level. Hence, if for example an external reference was used in the literature, it would not account for the shift in the NMR signal of TMS when it is solvated and that would therefore result in positive deviations of the calculated values.
While the majority peaks lie within a ±5 ppm margin from the literature values, an extremely large deviation of more than +15 ppm is seen for the carbon atom adjacent to the two S atoms. This deviation is attributed to the low level of sophistication at which the calculation was made. In particular, the B3LYP method used does not take into consideration the contributions to the local magnetic fields generated by spin-orbit coupling, a phenomenon more prevalent in large nuclei such as Sulfur. If this effect was taken into account, such large deviation from experimental values would not be seen.
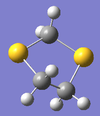
An attempt at rationalizing the magnitude of the deviation, a molecule of 1,3-dithiolane was optimized at the same level and its 13C NMR was then simulated. Since its 13NMR has already been reported[8], the deviation from literature values should ideally correspond to the spin-orbit coupling contribution terms.
| Computed value δ (ppm) Log file |
Reported value[8] δ (ppm) |
 |
|---|---|---|
| 44 (2C) | 8 | |
| 42 (1C) | 34.3 |
As one can see however, the results were not successful at introducing an accurate correction term. The simulation not only introduces an extremely large correction term, it also fails to assign the right order of chemical shift to the two carbons. Hence, it was deemed that only a calculation of much higher sophistication level could account for this deviation.
Part II - Analysis of the properties of the synthesised alkene epoxides
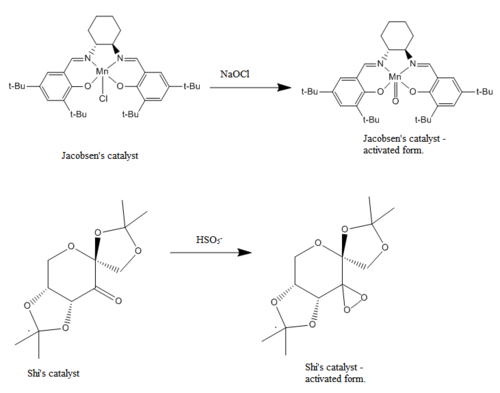
In experiment 1S, Shi's and Jacobsen's epoxidation catalysts were prepared. Both catalysts epoxidize olefins in a stereospecific manner and have revolutionized the field of asymmetric catalysis since their invention. The aim of this part of the computational exercise is to provide further insight on the transition states that give the catalysts their ability to promote said stereospecific epoxidations. Once the transition states are well understood, one could identify which epoxides were potentially formed during the synthetic lab sessions.
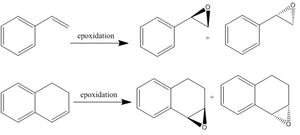
The two epoxides used in the laboratory are the ones that correspond to their styrene and 1,2-dihydronaphthalene alkene analogues.
Crystallographic Investigation of the two catalysts
In order to understand the structural properties of the two catalysts synthesized, the crystal structure of the two catalysts was obtained by searching the Cambridge Crystallographic Database using Conquest. The crystal structures were then analyzed using the Mercury software.
Shi's catalyst
Shi's catalyst is a ketone derivative of D-fructose and as per most carbohydrates, its structure is strongly defined by the stereoelectronic interactions that occur between the lone pair of the Oxygen atoms present and other low lying anti-bonding orbitals. This interaction is maximized when the lone pair of the O atom is antiperiplanar to the adjacent C-O bond as that maximizes orbital overlap between the donor and the acceptor.
Since an antiperiplanar arrangement maximizes this interaction, if the stabilization is strong enough then the acceptor group will preferentially align in an axial position, overcoming the destabilization caused by 1,3 diaxial repulsions. Having said the above, in order to quantify the catalyst's behavior one has to account for the anomeric interactions present and how those interactions affect the molecule's structure.
Two crystallographic structures of Shi's catalyst have been previously reported in the literature[9][10]. However, due to inability to access the publication it was decided that the second structure (NELQEA01 unit cell) would not be analyzed as, quite often, crystallographic data might contain huge errors in their assignment.
The NELQEA[9] unit cell is asymmetric and shows two molecules 'A' and 'B' of the ketone. Both molecules of the unit cell adopt a 3So conformation of the pyranose ring and an E4 conformation of the cis-fused dioxilane ring. The main difference between the two however arises from the conformation of the 1,3-dioxilane ring for which 'A' shows an E2 conformation whereas 'B' shows an E4 conformation. The analysis below will attempt to describe the structural features of only molecule 'A'.

| C-O Bond | Bond distance (Ǎ) |
|---|---|
| C10 - O4 | 1.439 |
| C10 - O5 | 1.409 |
| C5 - O5 | 1.416 |
| C4 - O4 | 1.395 |
| C6 - O6 | 1.428 |
| C2 - O6 | 1.403 |
| C2 - O2 | 1.403 |
| C7 -O2 | 1.441 |
| C7 - O1 | 1.413 |
| C1 - O1 | 1.400 |
| NELQEA | |||
|---|---|---|---|
|
The anomeric effect is a result of donation of electron density from the oxygen's high energy lone pair to a σ* orbital of low energy such as the σ* of C-O. Since electron density is contributed to an antibonding orbital, the acceptor C-O bond strength decreases and this can be identified as an increase in bond length. Conversely, the bond strength between the donor O atom and the carbon at which donation occurs increases and hence bond length shortening should be observed. Having in mind that a typical[11] C-O bond length for an alcohol is around 1.42 Å, deviations from that value should indicate where anomeric interactions are present.
A closer inspection to the geometry of molecule 'A' reveals three anomeric interactions. One of them involves donation of O5's lone pair to the C10-O4 σ* orbital. This is evident by the shorter length of O5-C10 and the longer length of C10-O4. A second anomeric interaction can be seen between O6 to C2-O2, however the arrangement is such that the lone pair of O2 is also antiperiplanar to C2-O6, hence the two anomeric effects cancel out. The third interaction is the donation of O1's lone pair to the C7-O2 bond which results in elongation of the latter.
It should be noted that while C4-O4 is the shortest C-O bond present, it doesn't participate in any anomeric interactions. It is presumed that the inductive effect from the adjacent carbonyl group makes C4 δ+ and therefore the δ- O4 will interact more strongly with it than the case of a typical C-O bond.
Jacobsen's catalyst

Jacobsen's catalyst lies at the pinnacle of catalyst design. However over the years, there has been a large amount of controversy[12] associated with the mechanism by which it derives its enantioselective activity.
It is generally accepted that the olefin travels to the activated center in a "side-on" approach which involves the alkene moving in a plane parallel to the salen ligand, while also allowing favourable π-π orbital overlaps with the catalyst[12].
What Jacobsen initially proposed[12] to explain the selectivity observed was that only trajectory 'b' would be observed while all others such as 'a' would be prohibited due to steric repulsions imposed by the bulky tert-butyl groups. This accounted for the observed stereochemistry of epoxidation, however slight variations to the ligand showed that this explanation was inconsistent as any change in the ligand shouldn't affect the topology of the 1,2-diaminocyclohexyl ligand significantly.
Katsuki[12] then proposed the generally accepted 'c' trajectory which involves travelling of the olefin over the imine ligand, something that would be favoured due to π-π interactions and is also what is observed in the transition state investigation of this study.
Lastly, H. Jacobsen and Cavallo[12], using computational methods and with the aid of crystallographic data were able to demonstrate that another plausible approach would be the path indicated by 'd'. The computational results showed that due to the di-equitorial conformation the salen ligand adopts, the two phenyl rings of the ligand are no longer planar but are found in an angle instead. This would therefore give enough space for an olefin to travel through the t-Bu groups and still give the observed stereochemistry after epoxidation.
From the above discussion, it is therefore quite evident that non-covalent intermolecular interactions are really important in understanding the enantioselectivity of Jacobsen's catalyst. As such, the crystallographic analysis of Jacobsen's catalyst focuses primarily on the Van der Walls interactions of the H atoms that are present in its structure. It should be noted that by Van der Walls radii considerations, 2.4 Å is the distance at which maximun attraction occurs between two H atoms. Furthermore, 2.1 Å is the distance at which the interactions between two H atoms become repulsive and are therefore destabilizing.
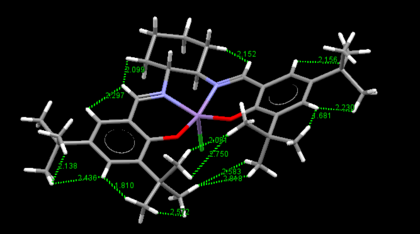
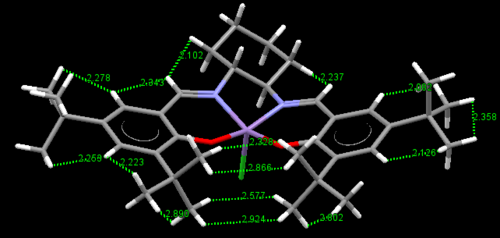
There are two crystal structures of Jacobsen's catalyst, TOVNB01[13] and TOVNBO2[14]. The former shows the methyl groups of t-Bu in a staggered conformation with respect to the adjacent phenyl group's methyls whereas the latter shows them in an eclipsed conformation.
For the former, this results in three H-H pairs that show attractive interactions and one H-H pair which shows repulsive interactions. The latter on the other hand shows four H-H pairs, all of which exhibit attractive interactions. This steric crowding is believed to block this site of attack, allowing for one access point 'c' through the diketimine ligand.
| TOVNIB01 | TOVNIB02 | ||||||
|---|---|---|---|---|---|---|---|
|
|
In the above rotatable images, the bond angle between the two salen ligands, with respect to the Mn center has been calculated. It can be seen that in both crystallographic structures the salen ligand is not planar. This non-planarity as stated earlier arises from the di-equitorial arrangement of the salen ligand at the 1,2-diaminocyclohexyl group and is further enhanced by repulsive Van der Walls interactions. As can be seen above, the TOVNIB02 structure is more distorted from planarity with a bond angle deviating more from 180o. The reason for this could be the attractive interactions that are generated when the methyls of the adjacent t-Bu groups are eclipsed and demonstrate attractive Van der Walls interactions which fold the ligand.
Assignment of the absolute configuration of the epoxides

In order to assign the products formed in experiment 1S, three investigations were carried out: Firstly, an NMR simulation was carried out in order to compare the spectra of the products obtained in the practical experiment and therefore verify whether the epoxidations were successful. Secondly, the optical rotation of the epoxides was calculated so as to allow the determination of their enantiomeric excess. Finally, a VCD analysis was carried out so as to demonstrate the predictive power of computational chemistry.
While ECD was also considered as another method to determine the absolute configuration of the epoxides, it was quickly dismissed as neither of the epoxides studied have a compatible chromophore unit. Furthermore, no ECD measurements of the two epoxides have been found in the literature. Hence, ECD would not help in the identification of the two compounds and no calculations were attempted using this method.
NMR analysis of products
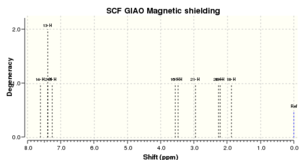
NMR analysis of (S,R)-1,2-Dihydronaphthalene
 |
Computed shift δ(ppm) DOI:10042/26569 |
Reported shift[15] δ(ppm) |
 |
|---|---|---|---|
| 7.62 (1H) | 7.44 (1H) | ||
| 7.40 (2H) | 7.33-7.21 (2H, m) | ||
| 7.25 (1H) | 7.13 (1H, d) | ||
| 3.56 (1H) | 3.89 (1H, d) | ||
| 3.48 (1H) | 3.77 (1H,t) | ||
| 2.95 (1H) | 2.83-2.79 (1H, m) | ||
| 2.27 (1H) | 2.59-2.55 (1H, m) | ||
| 2.21 (1H) | 2.49-2.41 (1H, m) | ||
| 1.87 (1H) | 1.80-1.76 (1H, m) |
 |
Computed shift δ(ppm) DOI:10042/26569 |
Reported shift[15] δ(ppm) |
 |
|---|---|---|---|
| 135.39 | 137.1 | ||
| 130.37 | 132.9 | ||
| 126.67 | 129.9 | ||
| 123.79 | 128.8 | ||
| 123.53 | 126.5 | ||
| 121.74 | 126.5 | ||
| 52.82 | 55.5 | ||
| 52.19 | 53.2 | ||
| 30.18 | 24.8 | ||
| 29.06 | 22.2 |
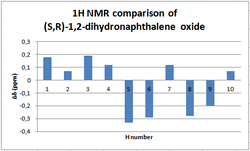
A symmetrical deviation profile is obtained when comparing calculated and literature values of the 1H NMR, thus indicating that the calculation is consistent enough to describe the experimental results. Furthermore, the maximun deviation in chemical shift observed is around -0.31 ppm and hence the calculations made are in good agreement with the literature.
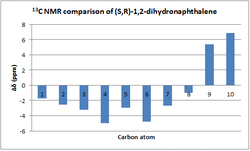
In the 13 NMR spectrum the largest deviation is observed in the carbons of the cyclohexyl ring that are not directly bonded to the oxygen. Their positive deviation from literature values perhaps shows that the software overestimates the contributions of ring currents from the adjacent phenyl ring.
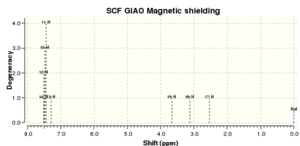
NMR analysis of R-Styrene Oxide
 |
Computed shift δ(ppm) DOI:10042/26541 |
Reported shift[16] δ(ppm) | 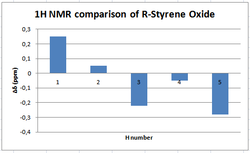 |
|---|---|---|---|
| 7.5 (4H) | 7.25 (5H, m) | ||
| 7.3 (1H) | |||
| 3.66 (1H) | 3.88 (1H, dd) | ||
| 3.11 (1H) | 3,16 (1H, dd) | ||
| 2.53 (1H) | 2.82 (1H, dd) |
 |
Computed shift δ(ppm) DOI:10042/26541 |
Reported shift[16] δ(ppm) |  |
|---|---|---|---|
| 135.13 (1C) | 137.2 | ||
| 124.13 (1C) | 128.1 | ||
| 123.42 (1C) | 127.7 | ||
| 122.96 (2C) | 125.1 | ||
| 118.27 (1C) | 125.1 | ||
| 54.05 (1C) | 51.9 | ||
| 53.46 (1C) | 50.8 |
A symmetrical deviation profile is obtained again. The literature values of the 1H NMR show small deviation from computed values in the chemical shift determined with a maximun deviation at less than -0.3 ppm.
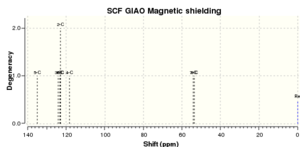
The 13C NMR spectrum shows smaller deviations than that of (S,R)-1,2-dihydronaphthalene oxide with a maximun deviation at -4 ppm from reported values. Overall good agreement is obtained with both simulations performed for R-styrene oxide.
Optical Rotation calculations
The optical rotation of the epoxides was calculated by using the B3LYP and 6-31++g(2df,p) basis set with chloroform as the solvation model. The optical rotation was then recorded at 589 and 365 nm. All literature values below correspond to optical rotations done in chloroform solvent. Unfortunately, no reported values were found for irradiation at 365 nm and hence comparison was made only with the 589 nm value of optical rotation. Furthermore, due to the unreliability of the reported values for optical rotations, two literature references were used for each epoxide.
| Epoxide | Optical rotation (o) | |
|---|---|---|
| Computed Value | Literature Value | |
| (R)-styrene oxide | DOI:10042/26557 |
-21.9[18] |
| (S)-styrene oxide | DOI:10042/26577 |
+28[20] |
| ((R,S)-1,2-dihydronaphthalene oxide | DOI:10042/26580 |
+129[22] |
| (S,R)-1,2-dihydronaphthalene oxide | DOI:10042/26576 |
-39[19] |
| Epoxide | Computed Value (o) |
|---|---|
| (R)-styrene oxide | DOI:10042/26557 |
| (S)-styrene oxide | DOI:10042/26577 |
| ((R,S)-1,2-dihydronaphthalene oxide | DOI:10042/26580 |
| (S,R)-1,2-dihydronaphthalene oxide | DOI:10042/26576 |
The optical rotation values for R and S styrene oxide are in well agreement with previously reported values. The value obtained for (R,S)-1,2-dihydronaphthalene oxide deviates positively by almost 24o, however this could as well be attributed to experimental errors as more often than not, not a single diastereomer might be present in solution. This assumption is enhanced when one considers the diversity of different optical rotation values found for this compound in the literature.
While it might seem that (S,R)-1,2-dihydronaphthalene oxide deviates significantly from the literature, one has to consider that under rotation of the plane of polarized light, any optical rotation value given by: Opt.Rot. + 180on is equivalent. It is rather a human conception to characterize optical rotatory power in a clockwise manner. Hence the value of +35.86o is equal to a value of 35.86o - 180o = -144.14o. Therefore this diastereomer is actually the one closest to the literature values, out of the ones obtained. The second value referenced (-39o) for the optical rotation of this compound was done simply to demonstrate the unreliability of experimental optical rotation values.
Vibrational Circular Dichroism calculations
VCD is an excellent technique for assigning absolute configuration of epoxides. By using circularly polarized Infrared light, one can identify which enantiomer is present by measuring the difference in attenuation between the left and right circularly polarized light while it passes through the sample. This is a direct consequence of the symmetry of the Cn and Dn point groups that chiral molecules exhibit because the circularly polarized infrared light that propagates through the sample medium is absorbed assymetrically from left to right. The absorbed light results in vibrational excitation of the molecules in the sample and hence the reason for the technique's name.
| Epoxide | VCD Spectrum | Epoxide | VCD Spectrum |
|---|---|---|---|
 R-Styrene Oxide |
 |
 S-Styrene Oxide |
 |
 (R,S)-1,2-Dihydronaphthalene Oxide |
 |
 (S,R)-1,2-Dihydronaphthalene Oxide |
 DOI:10042/26569 |
The VCD spectra of the R and S styrene oxide enantiomers are mirror images of one another with respect to the x axis. This is because equal amount of light is absorbed from the chiral center of the two enantiomers but in an opposite direction, with respect to the circularly polarized light's center.
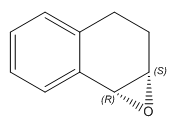
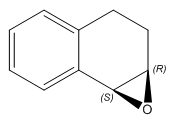
(R,S)-1,2-Dihydronaphthalene Oxide and (S,R)-1,2-Dihydronaphthalene Oxide are diastereoisomers rather than enantiomers. This results in the two VCD spectra not being a mirror image of eachother as two chiral centers are changed and hence the change in light absorption in the form of vibrational excitations doesn't map into a complete inversion when comparing the (R,S) and (S,R) derivatives.
Transition state analysis
This section aims to provide an insight to the workings of the two catalytic systems under investigation. In order to rationalize any shortcomings of the calculations used in this study, Styrene was used as the alkene under investigation. This is because styrene gives a low enantiomeric excess with either of the two catalysts as it is mono-substituted. Hence, any bias towards a transition state that might arise due to errors in the calculation will be easily spotted. For instance, such observations would not be possible if alkenes that gave 99% e.e were modelled instead.
Jacobsen's transition state
| Transition state | ΔG (hartees) |
|---|---|
| R-styrene oxide (1) | -3343.960889 |
| R-styrene oxide (2) | -3343.962162 (Lowest energy) |
| S-styrene oxide (1) | -3343.969197 (Lowest energy) |
| S-styrene oxide (2) | -3343.963191 |
The table to the left summarizes the sum of thermal and electronic free energies of the Jacobsen transition states with styrene. By choosing the lowest energy transition states for formation of R-styrene oxide and S-styrene oxide, one can find the predicted enantiomeric excess (e.e) that one might get by doing the epoxidation reaction.
The change in free energy from going from R-styrene oxide to S-styrene oxide is:
hartees
kJ mol-1
Furthermore, since:
, . This therefore implies that the S-styrene oxide transition state appears in solution 1729 times more often than the R-styrene oxide transition state.
Such large enantiomeric excess however have never been reported for styrene using this catalytic system. Previously reported values[24] suggest that the e.e of S-Styrene oxide is typically around 48%. Such large difference implies that the model employed in this calculation is inefficient to describe the system.
An explanation to this large deviation from reality could be attributed to the fact that the transition state provided for Jacobsen's catalyst does not include the t-Bu groups on the phenyl ring (to save computational time). The inclusion of the t-Bu groups would perhaps raise the energy of the S-styrene oxide transition state by a more significant amount than for the R-styrene oxide one, therefore tilting the enantiomeric excess of the S enantiomer down to the expected values of 48%.
Perhaps another way to better represent the transition state could be achieved by using more sophisticated basis set, or accounting for solvent interactions with the olefin substrates.
Non Covalent Interactions analysis of the transition states
|
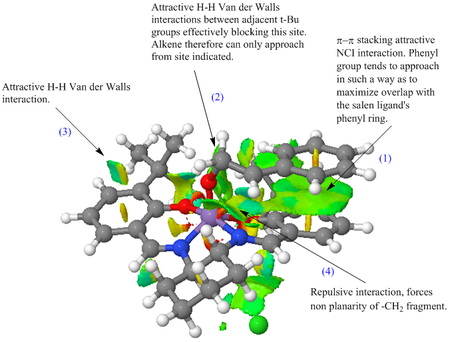
The NCI for the formation of S-styrene shows an abundance of attractive interactions that overally help stabilize the transition state. Of more importance perhaps is the π-π stacking interaction (1) between the salen's phenyl group and that of styrene's that helps stabilize the molecule over a large surface. This is an outcome of the "side on" approach of styrene through trajectory 'c' discussed earlier. The NCI analysis therefore further compliments the trajectory arguments made above. The more interesting interaction featured here however is the combined attractive interaction (2) in combination with the repulsive interaction (4) which help re-orient the alkene fragment in such a way as to form only the S-Styrene oxide enantiomer and therefore is the one that gives the catalyst its ability to promote this enantioselective reaction. Interaction (4) arises from the π bond of the imine ligand and the two hydrogen atoms present on the methine group of styrene whereas (2) is an attractive H-H VdW interaction between an H atom of the methyl group of styrene and another from a t-Bu group of the salen ligand.
QTAIM analysis of the transition states

The QTAIM analysis provides further insight as to the non-covalent interactions that take place in the transition state and provide the catalyst its asymmetric selectivity. By looking at the bond critical points of the non-covalent interactions one can pinpoint the exact interactions that take place. Of most interest is the attractive Van der Walls interaction between the olefin's H atoms and the H atom on one of the t-Bu's methyl groups. This results in slight 'tilting' of the plane of the molecule, exposing the S site of the olefin for epoxidation. Other NCIs can be seen throughout the molecular framework of the catalyst which result in bending from its planar structure and therefore allow only trajectory 'c' to be non sterically crowded. One such interaction is the H-H VdW interaction of the imine ligand's proton and an equitorial H atom of the 1,2-diaminocyclohexyl group, and also the H-H VdW interaction
Shi's Transition state

When carrying out an epoxidation with Shi's catalyst there are 23 transition states[25] that need to be taken into account. This number of transition states is associated with the two possible sites of epoxide formation (Re and Si of alkene), the two possible approaches of the alkene (spiro or planar transition state) and the two oxygen atoms of the dioxirane that might be abstracted by the olefin to form the epoxide.
Six of said transition states are disfavoured by steric and electronic interactions associated with the approach of the alkene and hence only two of the transition states are generally viable. One of them is the spirocyclic transition state depicted on the left and it involves the "side-on" approach of the olefin towards the less hindered dioxirane O atom. The other involves the "face-on" approach of the alkene, therefore resulting in a planar transition state, towards the same O atom in such a way as to minimise steric repulsions between the olefin substituents and the catalyst molecule.
This two different possible approaches yield the different enantiomer/diastereomer and as illustrated by Shi[25], one can gain control of which transition state is formed and hence the enantiomeric excess by varying the reaction conditions. It is generally accepted that due to steric effects, trans and tri-substituted alkenes will favour a spirocyclic transition state whereas cis-alkenes favour the planar transition state.
| Transition state | ΔG (hartees) | Transition state | ΔG (hartees) |
|---|---|---|---|
| R-styrene oxide (1) | -1303.730703 | S-styrene oxide (1) | -1303.733828 |
| R-styrene oxide (2) | -1303.730238 | S-styrene oxide (2) | -1303.724178 |
| R-styrene oxide (3) | -1303.736813 | S-styrene oxide (3) | -1303.727673 |
| R-styrene oxide (4) | -1303.738044 (lowest energy) | S-styrene oxide (4) | -1303.738503 (lowest energy) |
The table shown summarizes the sum of thermal and electronic free energies of the Shi transition states with styrene. By choosing the lowest energy transition states for formation of R-styrene oxide and S-styrene oxide, one can find the predicted enantiomeric excess (e.e) that one might get by doing the epoxidation reaction.
The change in free energy from going from R-styrene oxide to S-styrene oxide is:
hartees or equally, kJ mol-1
Furthermore, since:
, . This therefore implies that S-styrene oxide is gonna be the predominant species present.
Hence the enantiomeric excess as given by this calculation is equal to 23.84%. This is not in agreement with the paper Shi first published[25]. In particular, Shi reported a value of only 13.6% e.e towards the R enantiomer rather than the S enantiomer. One of the central points of that article are the solvation effects and how they reflect the selectivity of the reaction. Since our calculation ignores any solvation effects, it was inevitable that it would fall short of expectations.
NCI analysis of Shi's transition state
|
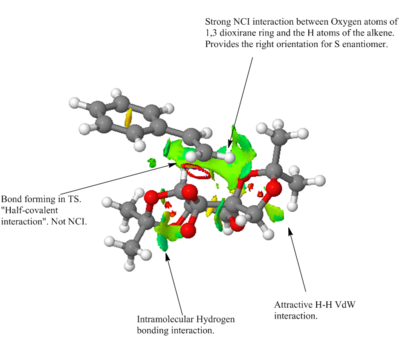
A plethora of NCI interactions is seen in the transition state of the formation of S-styrene using Shi's catalyst. This spirocyclic transition state shows strong through space interactions between the oxygen atoms of the 1,3-dioxilane ring and one of the terminal H atoms of styrene. This attractive interaction exposes only the S-enantiomer site for epoxidation.
Other NCI interactions affect primarily the structure of the catalyst molecule, effectively folding it into a zig-zag geometry. These interactions include intramolecular hydrogen bonding interactions between the non-participating O atom of the activated dioxirane ring and an H atom present in the adjacent cis-fused dioxilane ring.
Another such interaction is the attractive VdW interaction between two H atoms on the 1,3-dioxilane ring.
QTAIM analysis of Shi's transition state
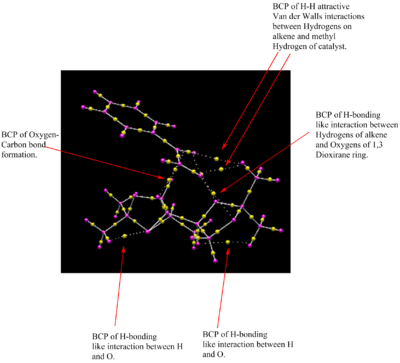
The QTAIM analysis done on the transition state helps pinpoint the exact NCI interactions that take place. In particular, one can now visualize the Bond Critical Point of the attractive H-H Van der Walls interactions that take place between the olefin Hydrogens and a hydrogen atom from one of the methyl groups found in Shi's catalyst. It is this interaction that gives strong stereocontrol to the spirocyclic transition state.
Furthermore, one can find a BCP due to intramolecular hydrogen bonding between an O atom of the 1,3-dioxilane ring and one H atom of the terminal carbon of the olefin. This helps stabilize the overall energy of the transition state and it is therefore partially responsible that it is this interaction that renders this spirocyclic state as the most stable.
New candidate for investigation

The following candidate is proposed for investigation in a similar study to this. The starting material is readily available as it is merely nitro quinoline. Its epoxidation from the alkene shown has been previously reported with good yield[26]. It could be a nice example to investigate as a comparison with the very similar 1,2-dihydronaphthalene. The introduction of a nitrogen atom to the ring could have an impact to the epoxidation stereochemistry and therefore provide further insight into how the active center of the catalyst works.
This molecule has been reported[26] to have an optical rotation of 627o at 539 nm and therefore it is likely that it has a mistake in its assignment.
References
- ↑ 1.0 1.1 M. Fox, R. Cardona, N. Kiwiet, J. Org. Chem., 1987, 52 1469–1474. DOI:10.1021/jo00384a016
- ↑ 2.0 2.1 D. Skála, Petroleum and Coal, 2003, 45, 105-108. DOI:[1]
- ↑ 3.0 3.1 L. Paquette, S. Elmore, Tetrahedron Letters, 1991, 32, 319-322. DOI:10.1016/S0040-4039(00)92617-0
- ↑ 4.0 4.1 4.2 4.3 W. Maier, P. Schleyer, J. Am. Chem. Soc., 1981, 103, 1891-1900. DOI:10.1021/ja00398a003
- ↑ J. Kim, Bull. Korean Chem. Soc., 1997, 18, 488-495.
- ↑ 6.0 6.1 6.2 6.3 6.4 6.5 6.6 6.7 6.8 L. Paquete, N. Pegg, D. Toops, G. Maynard and R. Rogers, J. Am. Chem. Soc., 1990, 112, 277-283.DOI:10.1021/ja00157a043
- ↑ R. Abraham, M. Canton, L. Griffiths, Magn. Reson. Chem., 2001, 39, 421-431. {{DOI|10.1002/mrc.862}
- ↑ 8.0 8.1 Y. Cao, Y. Lai, H. Cao, X. Xing, X. Wang, W. Xiao, Can. J. Chem., 2006, 84, 1529-1533. DOI:10.1139/v06-151
- ↑ 9.0 9.1 9.2 M.Durik, V.Langer, D.Gyepesova, J.Micova, B.Steiner, M.Koos, Acta Crystallogr., 2001, 57, o672. DOI:10.1107/S160053680101073X
- ↑ Z. Wang, S.M.Miller, O.P.Anderson, Y. Shi, J.Org.Chem, 2001, 66, 521. DOI:10.1021/jo001343i
- ↑ J. Demaison, A. Csaszar, J. Mol. Struct., 2012, 1012, 7-14. DOI:10.1016/j.molstruc.2012.01.030
- ↑ 12.0 12.1 12.2 12.3 12.4 E. McGarrigle, D. Gilheany, Chem. Rev., 2005, 105, 1563-1602. DOI:10.1021/cr0306945
- ↑ 13.0 13.1 J. Yoon, T. Soon, S. Lee, W. Shin, Acta Cryst., 1999, 55, 1766. DOI:10.1107/S0108270199009397
- ↑ 14.0 14.1 F. Fronczek, X. Bu, Private Communication, 2002.
- ↑ 15.0 15.1 M. Robinson, A. Davies, R. Buckle, I. Mabbett, S. Taylor and A. Graham,Org. Biomole. Chem., 2007, 7, 2559-2564. DOI:10.1039/B900719A
- ↑ 16.0 16.1 Y. Kon, H. Hachiya, T. Matsumoto, Y. Ono, K. Sato, Synthesis, 2011 , 7, 1092 - 1098. DOI:10.1055/s-0030-1258467
- ↑ D. Forbes, S. Bettigeri, S. Patrawala, S. Pischek, M. Standen, Tetrahedron,, 2009, 65, 70-76. DOI:10.1016/j.tet.2008.10.019
- ↑ M. Hayashi, H. Miwata, N. Oguni, J. Chem. Soc. Perkin Trans., 1991, 1, 1167-1171. DOI:10.1039/P19910001167
- ↑ 19.0 19.1 H. Lin, J Qiao, Y Liu, Z. Wu, J. Mol. Cat. B., 2010, 67, 236-241. DOI:10.1016/j.molcatb.2010.08.012
- ↑ K. Huang, H. Wang, V. Stepanenko, M. Jesus, C. Torruellas, W. Correa, M. Marciales, J. Org. Chem., 2011, 76, 1883–1886. DOI:10.1021/jo102294j
- ↑ D. Boyd, N. Sharma, R. Agarwal, N. Kerley, A. McMordie, A. Smith, H. Dalton, J. Blacker, G. Sheldrake, J. Chem. Soc. Chem. Comm., 1994, 14, 1693-1694. DOI:10.1039/C39940001693
- ↑ S. Pedragosa-Moreau, A. Archelas, R. Furstoss,Tetrahedron, 1996, 52, 4593-4606. DOI:10.1016/0040-4020(96)00135-4
- ↑ H. Sasaki, R. Irie, T. Hamada, K. Suzuki, T. Katsuki, Tetrahedron, 1994, 50, 11827-11838. DOI:10.1016/S0040-4020(01)89298-X
- ↑ J. Hanson, J. Chem. Educ., 2001, 78, 1266. DOI:10.1021/ed078p1266
- ↑ 25.0 25.1 25.2 Z. Wang, Y. Tu, M. Frohn, J. Zhang, Y. Shi, J. Am. Chem. Soc., 1997, 119, 11224-11235. DOI:10.1021/ja972272g
- ↑ 26.0 26.1 R. Heier, M. Moon, W. Stolle, J. Easter, R. Hsi, J. Labelled Comp. Radiopharm., 1996, 38, 1087-1098. DOI:<1087::AID-JLCR933>3.0.CO;2-O 10.1002/(SICI)1099-1344(199612)38:12<1087::AID-JLCR933>3.0.CO;2-O


