Rep:Mod:sc4011
Structure Optimization
BH3 Optimization
BH3 3-21G optimization: media:BH3 OPT 3-21G.LOG
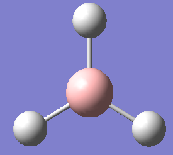
The planar BH3 molecule was constructed in gaussview. The bond length of the B-H bond in BH3 was then altered to 1.5 Å and the molecule was then optimized using a 3-21G basis set using a B3LYP method.
| Summary | Results |
|---|---|
| File Type: | .LOG |
| Calculation Type: | FOPT |
| Calculation Method: | RB3LYP |
| Basis Set: | 3-21G |
| Final Energy (au): | -26.46226338 |
| Gradient (au): | 0.00020672 |
| Dipole Moment (D): | 0 |
| Point Group: | D3H |
| Calculation Time: | 59 seconds |
| Bond Length (Å): | 1.193 |
| Bond Angle: | 120o |
Convergence verification:
    Item               Value     Threshold  Converged?
 Maximum Force            0.000413     0.000450     YES
 RMS     Force            0.000271     0.000300     YES
 Maximum Displacement     0.001610     0.001800     YES
 RMS     Displacement     0.001054     0.001200     YES
 Predicted change in Energy=-1.071764D-06
 Optimization completed.
    -- Stationary point found.
Higher level basis set optimization
The molecule was then optimized with a higher level basis set, 6-31G(d,p) as to provide a more accurate representation of the structure of the compound.
BH3 6-21G(d,p) optimization: media:BH3 OPT 6-31G D P.LOG
| Summary | Results |
|---|---|
| File Type: | .LOG |
| Calculation Type: | FOPT |
| Calculation Method: | RB3LYP |
| Basis Set: | 6-31G(d,p) |
| Final Energy (au): | -26.61532363 |
| Gradient (au): | 0.00000235 |
| Dipole Moment (D): | 0 |
| Point Group | D3H |
| Calculation Time | 27 seconds |
| Bond Length (Angstroms): | 1.192 |
| Bond Angle: | 120o |
Convergence verification:
  Item               Value     Threshold  Converged?
 Maximum Force            0.000005     0.000450     YES
 RMS     Force            0.000003     0.000300     YES
 Maximum Displacement     0.000019     0.001800     YES
 RMS     Displacement     0.000012     0.001200     YES
 Predicted change in Energy=-1.304899D-10
 Optimization completed.
    -- Stationary point found.
Energy difference between the two optimizations: -0.1530602 au or equally, -401.86 kJ mol-1
GaBr3 Optimization
In order to optimize a molecule containing heavier atoms, a calculation that involves pseudo-potentials was accomodated, LANL2DP. In heavier atoms, we can treat the repulsive forces arising from the core orbital electrons as a background potential, rather than moving-interacting particles. This allows the calculation to employ several of the relativistic features that the electrons show in heavier atoms without sacrificing much computational time.
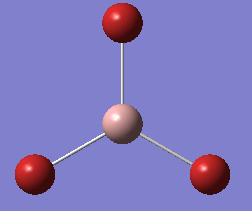
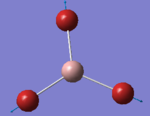
GaBr3 LANL2DZ optimization: DOI:10042/25201
Log file: media:SC GaBr3 opt LANL2DZ.log
| Summary | Results |
|---|---|
| File Type: | .LOG |
| Calculation Type: | FOPT |
| Calculation Method: | RB3LYP |
| Basis Set: | LANL2DZ |
| Final Energy (au): | -41.70082783 |
| Gradient (au): | 0.00000016 |
| Dipole Moment (D): | 0 |
| Point Group | D3H |
| Calculation Time | 27.7 seconds |
| Bond Length (Å): | 2.350 |
| Bond Angle: | 120o |
Convergence verification:
Item               Value     Threshold  Converged?
Maximum Force            0.000000     0.000450     YES
RMS     Force            0.000000     0.000300     YES
Maximum Displacement     0.000003     0.001800     YES
RMS     Displacement     0.000002     0.001200     YES
Predicted change in Energy=-1.282679D-12
Optimization completed.
-- Stationary point found.
Literature comparison:
| Ga-Br Bond length | Br-Ga-Br Bond angle |
|---|---|
| 2.239 ± 0.007 | 119.1 ± 0.1 |
As it can be seen in the table above, the literature[1] suggests a value which differs by 0.111 Å than the computed value (2.35018 ± 0.01 Å). Such error is not within the accuracy of this calculation and perhaps a more sophisticated approximation that exceeds the Pseudo potential approximation must be incorporated.
BBr3 Optimization
For BBr3 which contains both heavy and light atoms, a generic basis set was used, GEN, which allows the use of different basis sets for different molecules. This allows us to use the PP approximation for the Br atoms, for which it applies well but not use it for the B atom for which it does not apply as properly. A 6.31g(d,p) basis set was used for the B atom in this molecule whereas a LANL2DZ basis set was used for the Br atoms.
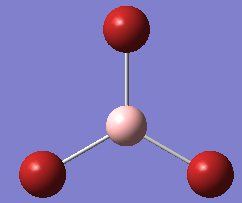
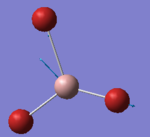
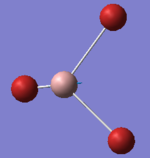
BBr3 GEN optimization: DOI:10042/25216
Log file: media:SC BBr3 opt GEN.log
| Summary | Results |
|---|---|
| File Type: | .LOG |
| Calculation Type: | FOPT |
| Calculation Method: | RB3LYP |
| Basis Set: | GEN |
| Final Energy (au): | -64.43645296 |
| Gradient (au): | 0.00000382 |
| Dipole Moment (D): | 0 |
| Point Group: | D3H |
| Calculation Time: | 32.7 seconds |
| Bond Length (Angstroms): | 1.93396 |
| Bond Angle: | 119.99o |
Convergence Verification:
Item               Value     Threshold  Converged?
Maximum Force            0.000008     0.000450     YES
RMS     Force            0.000005     0.000300     YES
Maximum Displacement     0.000036     0.001800     YES
RMS     Displacement     0.000023     0.001200     YES
Predicted change in Energy=-4.027604D-10
Optimization completed.
-- Stationary point found.
Structure Comparison
In covalent chemical bonds the bond length is dependent upon both the atomic orbital size of the participating atoms as well as the orbital overlap which takes place. As one would expect, the larger the valence orbitals participating in bonding the larger the length of the bond formed. In order to draw comparisons between the bonding of this compounds it is more wise to consider how the bond lengths of the computed compounds differ from a purely covalent model. Such analysis will aid one to reveal other factors are in play and how they contribute in the overall bonding of the molecule.
| Compound | Computed bond Length (Å) | Predicted bond length (Å) |
|---|---|---|
| BH3: | 1.192 | 1.15 Å |
| BBr3: | 1.933 | 2.04 Å |
| GaBr3: | 2.350 | 2.42 Å |
Discussion:
In the case of BH3 the bond length computed in this study is in good agreement with the predicted value[2] based on covalent radii data.
Upon changing the ligand to Br, despite both H and Br being X ligands donating one electron to the metal centre, deviations can be seen in the case of BBr3. In particular, the bond length of the B-Br bond is smaller than what would be predicted if the covalent radius of Boron and Bromine were added. This is mainly contributed to two reasons; The first one has to do with the larger difference in electronegativity between B and Br than that of B and H. These additional attractive electrostatic forces, also known as ionic contributions, contribute to the overall bond strength and hence equilibrium distance of the two atoms is smaller than what a completely covalent model would predict. The other factor that governs this bond shortening is the donation of the Bromine's lone pair to the vacant p orbital of the Boron atom. This p ↔ p orbital overlap offers additional stabilization energy to the B-Br bond, making the bond stronger and thus making the bond length shorter than predicted.
By changing the metal centre from Boron to Gallium, the valence orbitals become larger and more diffuse. As a consequence the orbital overlap between the metal and ligand is weaker and thus the bond strength also becomes weaker. Furthermore, Gallium is less electropositive than Boron and hence the ionic contributions are not as prevalent as in the case of BBr3. As a consequence, the effects that contributed to the bond shortening of B-Br are not as pronounced in the case of Ga-Br and hence the computed value is closer to the completely covalent model.
Definition of a bond:
A bond is the equilibrium description of the sum of all electrostatic and exchange interactions present between the nuclei and electrons of different atoms, often found in close proximity to one another. The former is the sum of all coulombic interactions, attractive and repulsive exerted by the nuclei and electrons present. The exchange interaction on the other hand is non-classical. When in close proximity to another atom, the electrons present are in a superposition state which allows them to be partly localized in the nucleus of the other atom(s) that are in close proximity. This spreading of the electron to both nuclei increases the binding energy it feels (or equally reduces its kinetic energy) and hence electron density is built up between the centres of the nuclei present.
Gaussview uses a database that includes common bond lengths that are often seen in known compounds. If the distance is equal or smaller, it draws a bond betwen the two atoms. However, there could be significant attractions between two atoms that lead to a stable equilbrium at a distance greater than what the database Gaussview uses. As a consequence a bond won't be drawn between the two atoms.
Frequency analysis of optimized structures
BH3
A frequency analysis was carried out on the optimized BH3 structure which allows one to verify whether the optimized structure has reached a minimun in the potential energy surface. Both the method and basis sets used were the same as the optimization performed in order to ensure compatibility of the methods. A different method for instance might use approximations that would give erroneous results when used on a structure optimized with different approximations assumed.
Log file: media:BH3 FREQUENCY.LOG
| Summary | Results |
|---|---|
| File Type: | .LOG |
| Calculation Type: | FREQ |
| Calculation Method: | RB3LYP |
| Basis Set: | 6-31G(d,p) |
| Final Energy (au): | -26.61532363 |
| Gradient (au): | 0.00000237 |
| Dipole Moment (D): | 0 |
| Point Group | D3H |
| Calculation Time | 9 seconds |
Low Frequencies:
 Low frequencies ---   -0.9033   -0.7343   -0.0054    6.7375   12.2491   12.2824
 Low frequencies --- 1163.0003 1213.1853 1213.1880
As one can see all external degrees of freedom are within a small range indicating a good optimized structure. Furthemore no imaginary frequencies were present, hence the structure optimized did not fall into a metastable state.
The Infrared spectrum of BH3

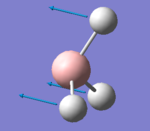
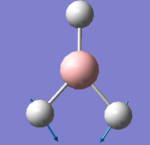
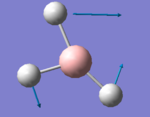
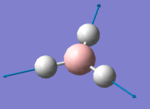
While the molecule has 6 vibrational modes, only three peaks appear in the Infrared spectrum. In order to interpret that one has to take into account the degenerate representations present in the point group, but also the selection rules that govern the coupling of electromagnetic radiation and electrons.
In particular, there are two sets of degenerate vibrations overlapping at the same frequency (1213.19 cm-1 and 2715.43 cm-1) and hence only one peak is seen in the spectrum.
Furthermore, the a1' vibration, is totally symmetric and hence has a 0 transition dipole moment. As a consequence it will not interact with the electromagnetic wave and will be of zero intensity. Therefore 3 vibrations won't show up in the IR spectrum, leading to only 3 peaks being observed.
GaBr3
A frequency analysis was carried out for GaBr3 as to ensure that optimized structure is a minimun. The same method and basis sets were used as to ensure that the molecule stayed in an energy minimun.
GaBr3 frequency analysis: DOI:10042/25232
Log file: media:SC GaBr3 freq 6 31G dp.log
| Summary | Results |
|---|---|
| File Type: | .LOG |
| Calculation Type: | FREQ |
| Calculation Method: | RB3LYP |
| Basis Set: | LANL2DZ |
| Final Energy (au): | -41.70082783 |
| Gradient (au): | 0.00000011 |
| Dipole Moment (D): | 0 |
| Point Group | D3H |
| Calculation Time | 13.9 seconds |
Low Frequencies:
Low frequencies ---   -0.5252   -0.5247   -0.0024   -0.0010    0.0235    1.2010
Low frequencies ---   76.3744   76.3753   99.6982
There are two lowest 'real' normal modes, the degenerate E' pair which can be seen as a peak at 76 cm-1 in the IR spectrum..
The Infrared spectrum of GaBr3

Again, 6 vibrational modes exist but only three peaks appear in the Infrared spectrum. Since both GaBr3 and BH3 are in the same point group, the same principles used earlier to interpret the IR spectrum of BH3 apply here as well.
There are two sets of degenerate vibrations which overlap at the same frequency (76 cm-1 and 316 cm-1) and hence only one peak is seen in the spectrum.
Similarly to BH3, the a1' vibration, is totally symmetric and hence has a 0 transition dipole moment. As a consequence it will not interact with the electromagnetic wave and will be of zero intensity. Therefore 3 vibrations won't show up in the IR spectrum, leading to only 3 peaks being observed.
Vibrational Comparison of BH3 and GaBr3
| BH3 Frequencies (cm-1) | GaBr3 Frequencies (cm-1) |
|---|---|
| 1163 (a2" | 76 (e') |
| 1213 (e') | 76 (e') |
| 1213 (e') | 100 (a2") |
| 2582 (a1' | 197 a1' |
| 2715 (e') | 316 (e') |
| 2715 (e') | 316 (e') |
The Infrared spectra of the two compounds both show three peaks. There are two low frequency peaks (a2" and e') of similar wavenumbers corresponding to the bending modes of the molecules and one high frequency peak e' corresponding to the stretching mode of the two compounds. As stated earlier the a1' stretching mode occurs with zero transition dipole moment and hence is of zero intensity (IR inactive). The stretching modes are seen in much higher wavenumber frequency as the compression of a bond leads to high Pauli repulsions between the electrons of the two atoms sharing said bond. This is not the case with the bending modes as the bond length stays essentially invariant and the atoms do not approach eachother as much as to exert strong Pauli repulsions.
In order to understand the large difference in the wavenumber frequencies between BH3 and GaBr3 vibrations, one has to consider which parameters govern said frequencies. In the harmonic oscillator model, the wavenumber frequency is given by where k is the force constant of the chemical bond and μ is the reduced mass.
As one would expect, the reduced mass of BH3 is much smaller than that of GaBr3 and hence we would expect the BH3 frequencies to appear in higher wavenumbers. However if we were to assume that the force constant of the two compounds was approximately equal, we still wouldn't expect the frequencies for the former to appear at such low frequencies when compared to the latter. Since the wavenumber frequencies are significantly higher than what would be expected for similar force constants, the bonding in BBr3 is stronger than in GaBr3.
This difference in strength is attributed to the larger difference in electronegativity between B and Br, with respect to Ga and Br, the strength of the orbital overlap and the p-p overlap of the ligand and metal atoms. The first factor leads to increased ionic contributions present owed to the increased electrostatic attractions between the atoms. The second factor has to do with the interacting orbitals present; In the case of Ga, the orbitals donated to form the sigma framework are more diffuse than that of B and hence a weaker orbital overlap is produced between the metal centre and the ligand. Finally, the p↔p stabilization mentioned above is weaker in the case of Ga-Br as there is less π donation from the ligand orbitals as its p orbital is more diffuse than that of B. Overally these factors lead to a weaker metal-bromide bond and hence lower vibrational frequencies.
Another noticeable feature is the energy reordering of the vibrational modes of those two D3H compounds. In particular, for GaBr3 the a2" vibrational mode is no longer the lowest energy mode, as was the case for BH3. This is attributed to the quantum mechanical mixing of the e' vibrational states, an effect also known as Fermi Resonance. In general, significant mixing occurs between wavefunctions of the same point group and of similar energy. Whereas in BH3 the energy difference between the two e' pairs was in the order of 1000 cm-1, for GaBr3 it is merely around 200 cm-1. As a consequence significant mixing occurs and one pair of e' vibrations goes down in energy while the other goes up, resulting to an inversion of energy levels between the a2" and e' vibrational modes.
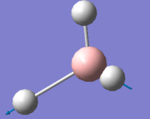
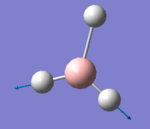
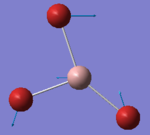
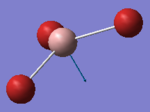
Evidence in this claim is backed up by the fact that in the first pair of e' vibrations for GaBr3, vibration no.1 as indicated in the table shows the Ga atom to oscillate in a motion thats perpendicular to the bending modes of the Br atoms. In BH3 the B atom was stationary. Similarly in the scissoring vibration no.2, the third Br atom has a small oscillation amplitude something not seen in the case of BH3 where only the two Hydrogen atoms oscillate with the third being stationary. This is effectively evidence of a coupled oscillation where the first pair of e' vibrational modes, due to quantum mechanical mixing, shows properties of the second e' pair.
The same basis set and method must be carried out for both optimisation and frequency calculations as the calculations follow similar ansatz and hence the frequency analysis will be heavily depended on the structure obtained through the optimization method. For instance the approximations assumed by one method might not be compatible with that of the other and thus this might lead to erroneous results.
The low frequencies represent the external degrees of freedom of the molecule, i.e the three translational motions (one in each cartesian dimension) and the three rotational motions (one axis along each cartesian dimension) of the whole molecule.
Molecular Orbitals
Population analysis of BH3
A population analysis of BH3 was carried out as to draw a comparison between the real orbitals and the qualitative LCAO theory.
BH3 6-31G(d,p) population analysis: media:BH3 pop analysis 631G d p.log
Dspace link: DOI:10042/25257
| Summary | Results |
|---|---|
| File Type: | .LOG |
| Calculation Type: | SP |
| Calculation Method: | RB3LYP |
| Basis Set: | 6.31G(d,p) |
| Final Energy (au): | -26.61532363 |
| Gradient (au): | -- |
| Dipole Moment (D): | 0 |
| Point Group | D3H |
| Calculation Time | 15 seconds |
Molecular orbital diagram and correlation with computed MOs:
As one can tell, the real molecular orbitals and the ones obtained via MO theory show the same features and ordering. This accuracy of MO theory makes it extremely useful for qualitative analysis. However, while for simple molecules such as BH3 MO theory is really accurate, for more complicated compounds it fails to describe the unoccupied orbitals properly. As a consequence, more complex models are generally adopted in favour of the LCAO method.
NBO Analysis of NH3
NH3 Optimization
The NH3 molecule was optimized using a B3LYP method and 6.31G(d,p) basis sets. A no symmetry command was accomodated as to allow for better optimization of the molecule.

NH3 6-31G(d,p) optimization: DOI:10042/25262
Log file: media:SC NH3 opt 631G d p.log
| Summary | Results |
|---|---|
| File Type: | .LOG |
| Calculation Type: | FOPT |
| Calculation Method: | RB3LYP |
| Basis Set: | 6.31G(d,p) |
| Final Energy (au): | -56.55776856 |
| Gradient (au): | 0.00000885 |
| Dipole Moment (D): | 1.8464 D |
| Point Group | C1 |
| Calculation Time | 38.1 seconds |
Convergence test:
Item               Value     Threshold  Converged?
Maximum Force            0.000024     0.000450     YES
RMS     Force            0.000012     0.000300     YES
Maximum Displacement     0.000079     0.001800     YES
RMS     Displacement     0.000053     0.001200     YES
Predicted change in Energy=-1.629715D-09
Optimization completed.
-- Stationary point found.
Frequency Analysis of NH3
A frequency analysis was ran as to ensure that the optimized NH3 molecule has a reached a minimun of the potential energy surface.
NH3 Frequency analysis 6-31G(d,p): DOI:10042/25265
Log file: media:SC NH3 freq 631g d p.log
| Summary | Results |
|---|---|
| File Type: | .LOG |
| Calculation Type: | FREQ |
| Calculation Method: | RB3LYP |
| Basis Set: | 6.31G(d,p) |
| Final Energy (au): | -56.55776856 |
| Gradient (au): | 0.00000880 |
| Dipole Moment (D): | 1.8464 D |
| Point Group | C1 |
| Calculation Time | 23.7 seconds |
Low Frequencies:
Low frequencies ---  -30.8069   -0.0014   -0.0011    0.0009   20.2226   28.2150
Low frequencies --- 1089.5530 1694.1234 1694.1863
| no. | Form of the vibration | Frequency (cm-1) | Intensity | symmetry C3V point group |
|---|---|---|---|---|
| 1 | 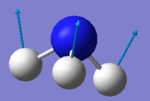 |
1090 | 145 | A1 |
| 2 |  |
1694 | 14 | E |
| 3 |  |
1694 | 14 | E |
| 4 |  |
3461 | 1 | A1 |
| 5 |  |
3589 | 0 | E |
| 6 |  |
3589 | 0 | E |
Note: All computations were done using a C1 point group to allow for better optimization of the molecule. However, the C3V symmetry labels have been used to assign the vibrations. As a consequence of using the no symmetry point group, the E vibrational modes are not exactly degenerate but rather show deviations in the first decimal place.
Natural Bond Order analysis of NH3
An NBO analysis of NH3 was ran as to visualize the charge distribution of the NH3 molecule. The method used was B3LYP with 6.31G(d,p) basis sets.
DSpace Link: DOI:10042/25269
Log file: media:SC NH3 pop analysis 631G d p.log
| Summary | Results |
|---|---|
| File Type: | .chk |
| Calculation Type: | SP |
| Calculation Method: | RB3LYP |
| Basis Set: | 6.31G(d,p) |
| Final Energy (au): | -56.55776856 |
| Gradient (au): | 0.00000000 |
| Dipole Moment (D): | 1.8464 D |
| Point Group | C1 |
| Calculation Time | - |
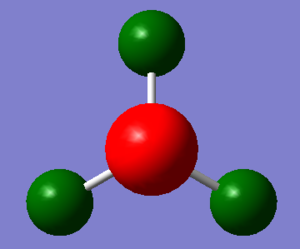
| Atom | Charge |
|---|---|
| Nitrogen | -1.125 |
| Hydrogen: | +0.375 |
Nitrogen is more electronegative than Hydrogen and as a consequence it withdraws electron density from the H atoms via the inductive effect. This results in a partially negative Nitrogen atom and three partially positive Hydrogen atoms. The sum of this charges however equals to 0, in accordance with a neutral charged molecule.
Reaction Energies
NH3BH3 Optimization
The structure of NH3BH3 was optimized using the same basis sets and method as for NH3 and BH3 as that will allow one to draw correlations between the energy of the three structures and hence the association energy of ammonia borane.
NH3BH3 optimization 6.31G(d,p): DOI:10042/25282
Log file: media:SC NH3BH3 opt 631G d p.log
| Summary | Results |
|---|---|
| File Type: | .LOG |
| Calculation Type: | FOPT |
| Calculation Method: | RB3LYP |
| Basis Set: | 6.31G(d,p) |
| Final Energy (au): | -83.22468897 |
| Gradient (au): | 0.00011154 |
| Dipole Moment (D): | 5.5664 |
| Point Group | C3 |
| Calculation Time | 1 minute, 25.7 seconds |
Item               Value     Threshold  Converged?
 Maximum Force            0.000233     0.000450     YES
 RMS     Force            0.000083     0.000300     YES
 Maximum Displacement     0.000978     0.001800     YES
 RMS     Displacement     0.000369     0.001200     YES
 Predicted change in Energy=-4.037156D-07
 Optimization completed.
    -- Stationary point found.
Vibrational Analysis of NH3BH3
A frequency analysis was ran on the optimized structure of NH3BH3 as to ensure that the structure reached a minimun on the potential energy surface.
NH3BH3 Frequency analysis 6.31G(d,p):) DOI:10042/25283
Log file: media:SC NH3BH3 freq 631G d p.log
| Summary | Results |
|---|---|
| File Type: | .LOG |
| Calculation Type: | FREQ |
| Calculation Method: | RB3LYP |
| Basis Set: | 6.31G(d,p) |
| Final Energy (au): | -83.22468897 |
| Gradient (au): | 0.00011157 |
| Dipole Moment (D): | 5.5664 |
| Point Group | C3 |
| Calculation Time | 48.1 seconds |
Low frequencies:
Low frequencies ---   -0.1566   -0.0574   -0.0117   14.8076   14.8893   42.0155
Low frequencies ---  265.6478  634.4597  639.6940
Associative energy determination
| Molecule | Energy (au) |
|---|---|
| NH3 | -56.55776856 |
| BH3 | -26.61532363 |
| NH3BH3 | -83.22468897 |
ΔE = E(NH3BH3) - E(BH3) - E(NH3)
Therefore, ΔE = -83.22468897 - (-56.55776856-26.61532363)
ΔE = -0.05159678 au
Equally, ΔE = -135.47 kJ mol-1
Hence the dissociation energy is: Edis= +135.47 kJ mol-1
The bond's energy is in the right order of magnitude that one would expect from a strong covalent bond.

