Rep:Mod:s j hines inorg
Computational Inorganic Chemistry Laboratory
Introduction
In this laboratory, a variety of computational techniques were used in order to structurally and energetically optimise, and analyse characteristics of, a number of molecules. At first, simple factors were found and compared:
- Bond Lengths
- [ http://en.wikipedia.org/wiki/Molecular_geometry Bond Angles]
- Final Energy for the Molecule
- Dipole Moments
- Point Groups
Further investigation saw the vibrations of particular molecules calculated and compared with each other and to literature/experimental values.
Semi-empirical Molecular Orbital Theory[1] was the method used for the optimisation of energy and structure. For analysis of the molecules, BH3, BCl3, SiH4, and Mo(CO)4(PMe3)2, it was the common density-functional B3LYP Hamiltonian that was used in the calculation.[2] This method and another were used to examine ammonia and comparisons were made between the two and the effects of using each method of optimisation were investigated. This is the MP2 method. It is based on 'Moller-Plesset Theories', it is known to be more reliable than the above density-functional method. Along with investigating the effects of different calculations, another factor is symmetry of the molecule and how this affects the optimisation. This was also considered, with respect to ammonia.
For all of the above calculations, values evolved from these were compared to literature values (where appropriate and available).
Calculations in this laboratory were examined in the 'GaussView' interface, having used the 'Gaussian' program to perform them.
The BH3 Molecule
Due to reasons discussed in the introduction, optimisation calculations made with a particular Hamiltonian and a particular basis set on a molecule cannot be compared with any accuracy or validity to a calculation made via a different method of optimisation. For this reason, exactly the same method/basis set was used to optimise two further molecules to allow comparison. This, and the results for these two molecules (BCl3 and SiH4) are shown in below sections.
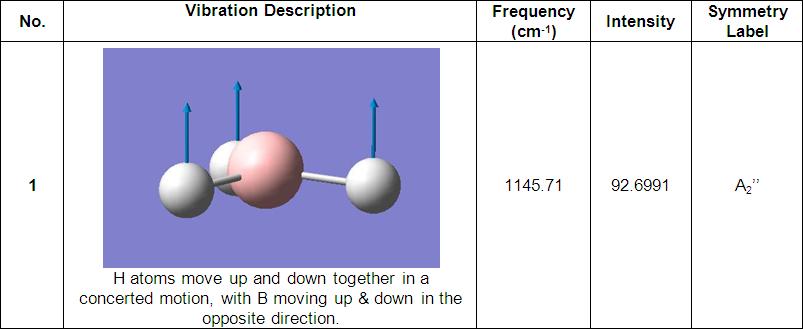 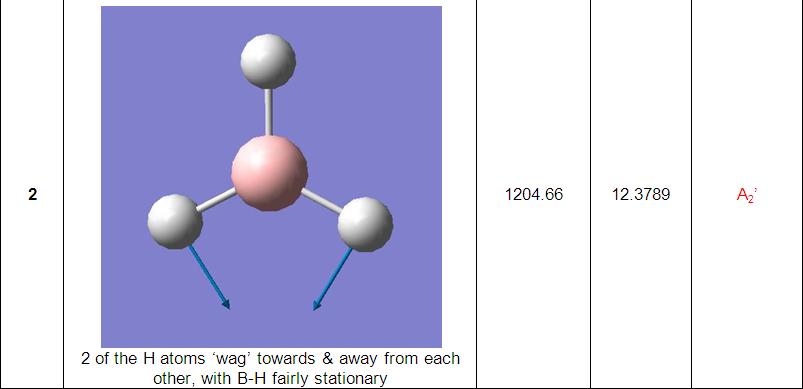    
 The final part of the investigation of the BH3 molecule involved calculation and examination of its molecular orbitals. Before these were calculated using the ‘Gaussian’ program, a molecular orbital diagram[3] was constructed using 'ChemDraw' program (pictured below). 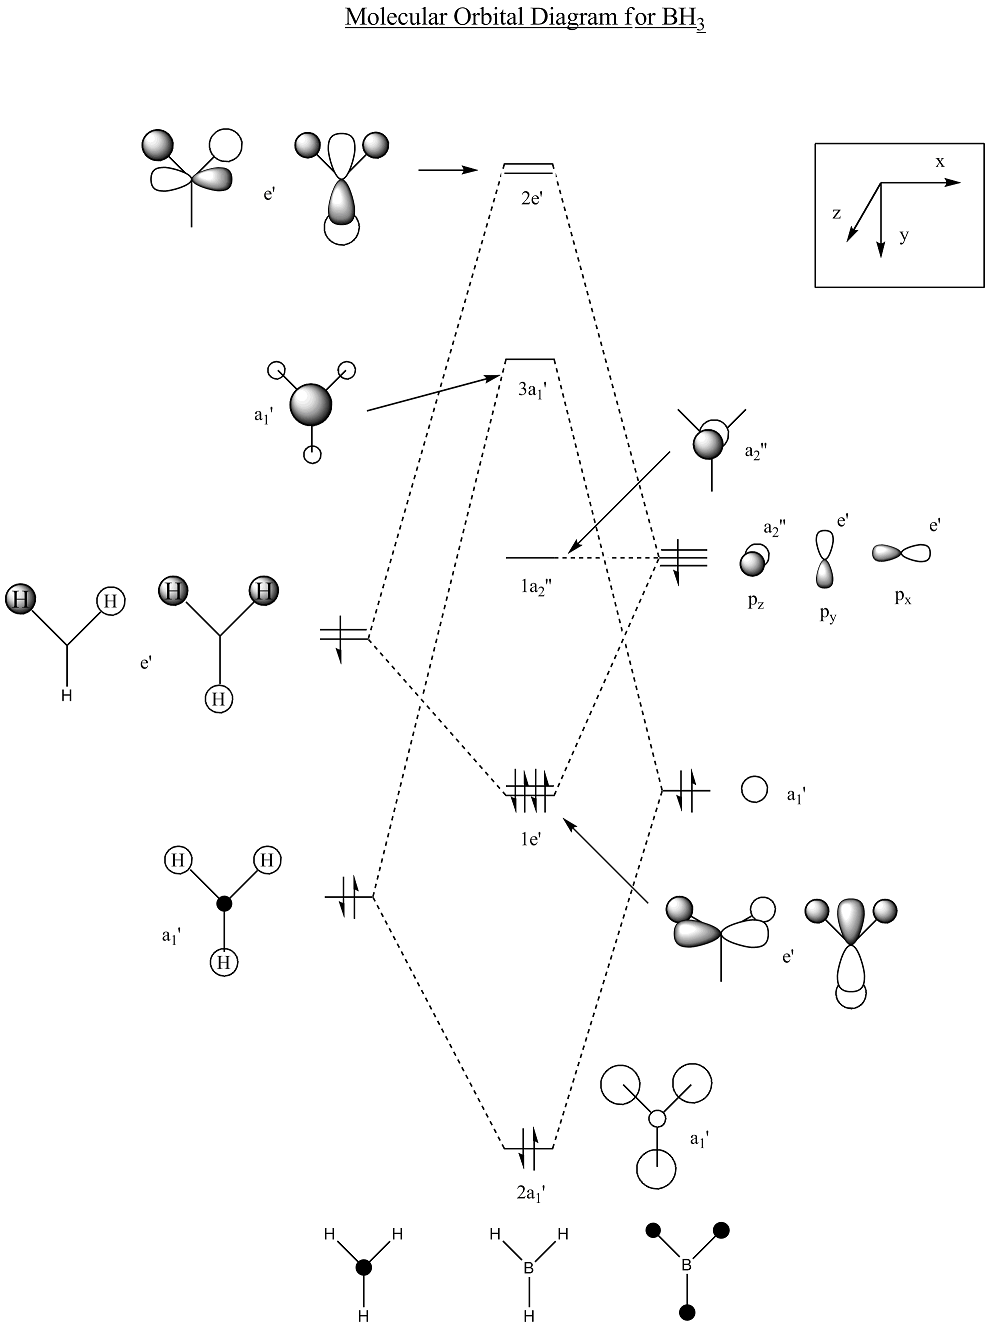
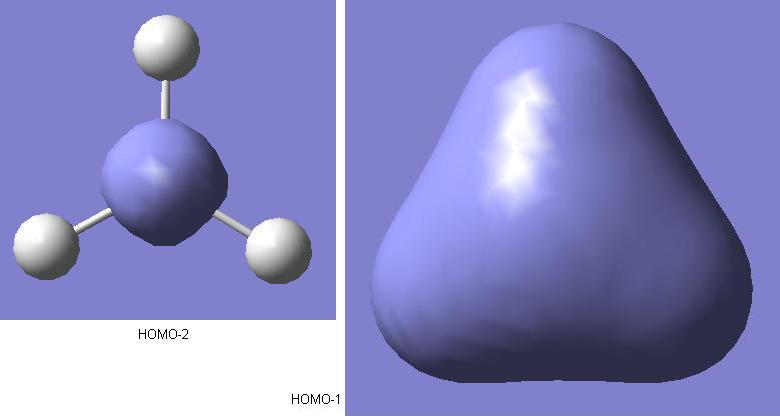 As shown above, these are the calculated predicted molecular orbitals for the HOMO-2 and HOMO-1 levels. For the bonding in this borane molecular orbital diagram, it is the 2s and 2p levels of the boron atom that are taking part. The HOMO-2 level molecular orbital is the non-bonding boron 1s level. The reason that it is not shown on the diagram is that it too low in energy for interaction with the hydrogen 1s orbitals, so will not effect the bonding. The first molecular orbital on the diagram is the HOMO-1. There is a clear resemblance between this qualitative prediction from the MO diagram and the quantitive prediction from the calculation. Early indications show that for this simple BH3 molecule, the qualitative MO analysis in the diagram is useful for giving an idea as to the form of the real molecular orbitals.
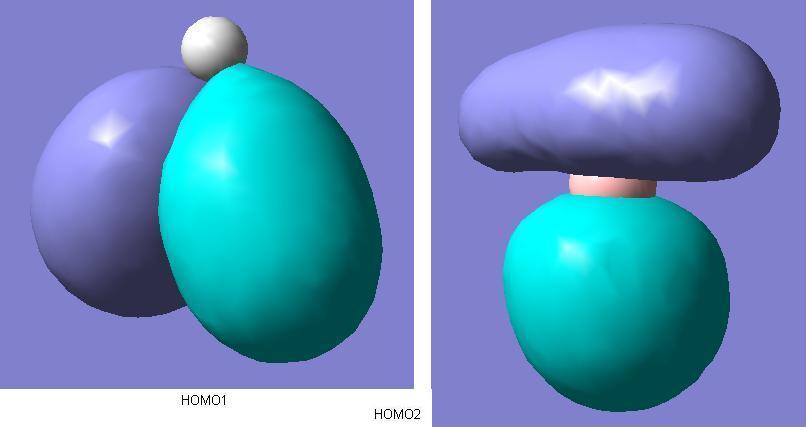 There are two degenerate molecular orbitals at the [http://en.wikipedia.org/wiki/HOMO HOMO level shown above here. These again show good alignment with what was expected in the MO diagram. However, the limited nature of the method of calculation is demonstrated as well. The two HOMO level degenerate molecular orbitals shown here exhibit imperfect symmetry, which obviously is not expected. If a more time consuming, accurate method with a larger basis set were used for the molecular orbitals calculations, then we would expect the molecular orbitals to be showing the appropriate σ symmetry to a greater degree of accuracy. 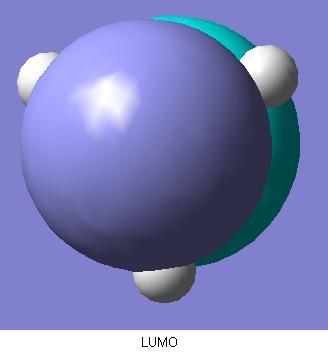 Comparing the qualitative LUMO from the diagram and the above quantitive prediction from the calculation, they're exactly the same as each other. Construction of the MO diagram is a very good method for predicting simple orbitals such as this, but gives a slightly more vague idea of molecular orbitals that are a little more complicated. Examples of this case would be comparison between the below 2 LUMO+1 level molecular orbitals, and the ones predicted in the diagram. Although these are still easily assigned to the ones in the diagram, the more complicated the molecular orbitals become, the more difficult it becomes to visualise the real molecular orbitals to the qualitative predicted ones. 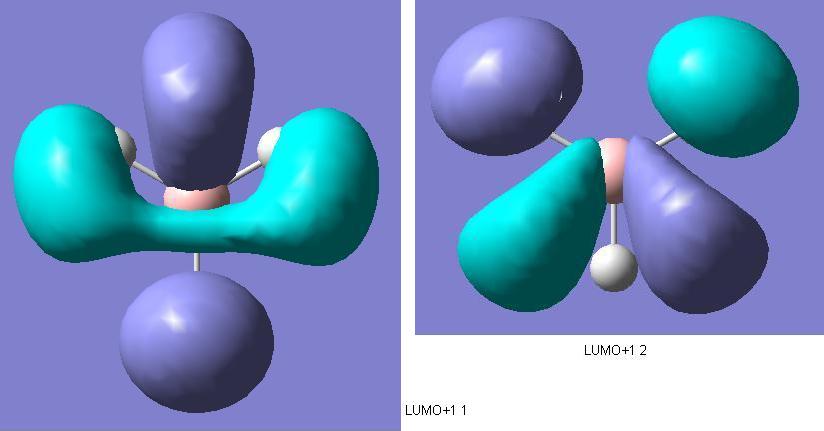 | ||||||||||
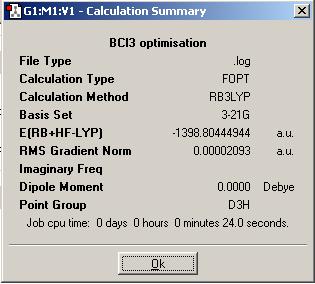
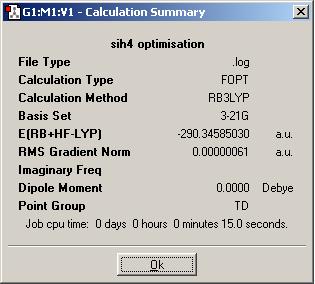
The BCl3 MoleculeThe BCl3 molecule was also optimised using the B3LYP method with the 3-21G basis set. The SiH4 MoleculeSimilar basic calculations that were carried out for the BH3 molecule above were performed on another molecule: SiH4. It was optimised (DOI:10042/to-1332 ) using the B3LYP method with the 3-21G basis set - exactly the same method as with the borane. As discussed previously, this has to be the case to allow comparison between the values evolved from the calculation for each molecule to be accurate/valid.
| ||||||||||
Isomers of the Mo(CO)4L2 Molecule
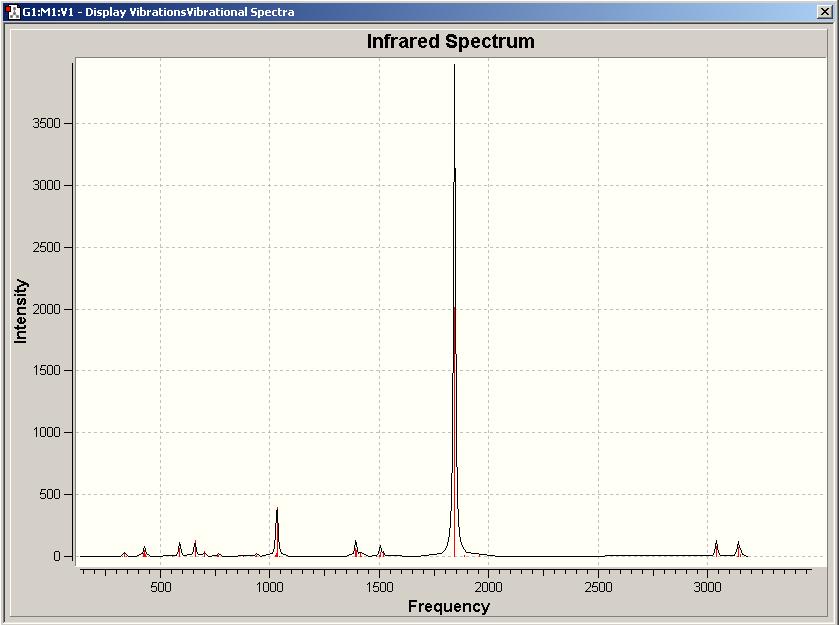
The two isomers are similar in energy, the difference in energy between them is 0.00076730 a.u. (2.015 kJ/mol), with the trans isomer more stable due to it being lower in energy. The bond lengths for Mo-C and Mo-P are longer in the cis isomer than they are in the trans isomer. Trans: 2.02869 , and 2.52471 respectively, whilst cis: 2.03199 , and 2.5891 respectively. Shorter bonds means stronger bonds, thus the trans isomer is more stable overall. Sometimes it is necessary to alter the ligands of a complex in order to stabilise the isomer that provides most use e.g. as a catalyst. It has been found that the trans isomer of the complex examined in this section is the most stable. However if it is the cis isomer that is most the most useful in catalysis, then the phosphorus-based ligands need to be altered to make sure the cis isomer is produced. An efficient way to ensure that the phosphorus ligands are cis to each other in the complex, is to insert a bridge between the two phosphorus atoms, 'locking' them in place.
| ||||||||||
The Ammonia Molecule
 It can be seen that the starting symmetry does affect the final structure. It is possible to tell this from the different dipole moments that are shown. If the final structure obtained was exactly the same in each case, then the dipole moments should be exactly the same. The preferred configuration of ammonia, the molecule with C3v symmetry, has taken the least time to optimise (32.0 secs), and as the molecule moves away from this symmetry, the time for optimisation increases, as shown above, from 45.0 secs to 76.0 secs. The 'Gaussian' program optimises the molecule for the symmetry given to the molecule in the input file. Symmetry will not break in the optimisation unless it is specifically set for the program to 'ignore' this factor. If a high symmetry structure needs to be analysed, the fact that symmetry breaking cannot take place causes the calculation time to be much slower. According to this optimisation, the C1 geometry has the lowest energy. This makes the difference in energy between the highest (D3h) and next lowest (C3v), 0.00034401 a.u. The energy difference corresponds to the energy barrier of inversion => 0.903 kJ/mol.
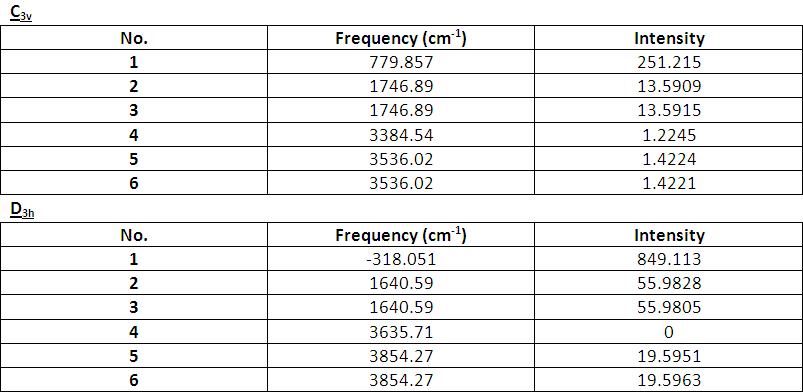
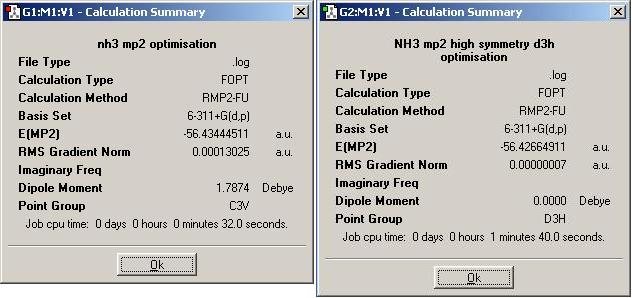 From the summary snapshot, the time for the optimisation calculation the C3v geometry can be seen as the same for the second method as the simpler first method. However, considering the calculation was carried out on the pre-optimised molecule, the time for calculation has actually increased for the second, more intense calculation. The same is true for the D3h geometry; although it has increased compared to the time for the first, this increase is larger than seen due to the same reasons. The difference in energies between these two geometries is again the barrier energy of inversion. In this case this energy is 0.007796 a.u. The energy calculated here is much higher than the energy calculated for the same factor in the first calculation, but as this is a much more accurate method, it shows good correlation with the experimental value of 24.3 kJ/mol[4] - this difference in energy equates to 20.899 kJ/mol.

 References
|

