
Rep:Mod:s1t2r3l4u
James Cochrane's Wiki
NH3
3D view
Summary table for optimised NH3
| Details | |
|---|---|
| Molecule | NH3 |
| Calculation method | B3LYP |
| Basis set | 6-31G(d,p) |
| Job type | Opt+Freq |
| E(RB3LYP) | -56.55776873 [a.u.] |
| RMS Gradient Norm | 0.00000485 [a.u.] |
| Point group | C3v |
| N-H bond length | 1.02 [Å] (database[1] value 1.012 [Å]) |
| H-N-H bond angle | 105.7 [°] (database[1] value 106.67 [°]) |
| Item table | |
Item Value Threshold Converged? Maximum Force 0.000004 0.000450 YES RMS Force 0.000004 0.000300 YES Maximum Displacement 0.000072 0.001800 YES RMS Displacement 0.000035 0.001200 YES | |
| Parameters being optimised | |
                          Optimized Parameters
                              (Angstroms and Degrees)

 Name  Definition              Value          Derivative Info.

 R1    R(1,2)                  1.018          -DE/DX =    0.0
 R2    R(1,3)                  1.018          -DE/DX =    0.0
 R3    R(1,4)                  1.018          -DE/DX =    0.0
 A1    A(2,1,3)              105.7412         -DE/DX =    0.0
 A2    A(2,1,4)              105.7412         -DE/DX =    0.0
 A3    A(3,1,4)              105.7412         -DE/DX =    0.0
 D1    D(2,1,4,3)           -111.8571         -DE/DX =    0.0
| |
| NH3 optimisation *.log file | |
"Display Vibrations" window

Comparison of computed IR spectrum with experimental IR spectrum


Clearly, the experimental and calculated IR spectra have a fairly high degree of similarity: the main peaks occur at similar frequencies. A thing to notice is that the calculated IR spectrum does not feature the wide, noisy bands which associate with the rotational motion of the molecule, whereas the experimental one obviously shows this feature. Also, the peak at frequency is much more intense than the other peaks in the calculated spectrum. Compare this to the experimental spectrum where the other two peaks are more prominent.
Questions pertaining to vibrations of NH3
- How many modes do you expect from the 3N-6 rule?
- We expect there to be 6 modes of vibration for the non-linear molecule using the 3N-6 rule and the fact that there are 4 atoms (N=4).
- Which modes are degenerate?
- Modes 2 and 3 have the same energy. So too do modes 5 and 6.
- Which modes are "bending" vibrations and which are "bond stretch" vibrations?
- Modes 1,2 and 3 are "bending" vibrations whereas modes 4,5 and 6 are "bond stretch" vibrations.
- Which mode is highly symmetric?
- Mode 4 is the most symmetric although mode 1 is also quite symmetric too.
- One mode is known as the "umbrella" mode, which one is this?
- Mode 1.
- How many bands would you expect to see in an experimental spectrum of gaseous ammonia?
- 2 bands. One at frequency due to H-N-H scissoring and another, much larger band, at frequency due to N-H wagging.
Charge Analysis

The charge on the nitrogen atom is -1.125; the charge on each hydrogen atom is +0.375. The first good sign is that the sum of the charges equals zero (because ammonia is a neutral species). The second good sign is that hydrogen atoms all have the same charge (because they are evenly disposed around the C3 rotation axis). However, we would expect (from elementary considerations) that the charge on nitrogen would be -3 and the charge on each hydrogen would be +1. This doesn't agree with the calculated results.
N2
3D view
Summary table for optimised N2
| Details | |
|---|---|
| Molecule | N2 |
| Calculation method | B3LYP |
| Basis set | 6-31G(d,p) |
| Job type | Opt+Freq |
| E(RB3LYP) | -109.52412868 [a.u.] |
| RMS Gradient Norm | 0.00000060 [a.u.] |
| Point group | D |
| N-N bond length | 1.106 [Å] (database[3] value 1.098 [Å]) |
| Item table | |
         Item               Value     Threshold  Converged?
 Maximum Force            0.000001     0.000450     YES
 RMS     Force            0.000001     0.000300     YES
 Maximum Displacement     0.000000     0.001800     YES
 RMS     Displacement     0.000000     0.001200     YES
| |
| Parameters being optimised | |
                Optimized Parameters
                    (Angstroms and Degrees)

Name  Definition    Value          Derivative Info.

R1    R(1,2)        1.1055         -DE/DX =    0.0
| |
| N2 optimisation *.log file | |
"Display Vibrations" window

Comparison of computed IR spectrum with experimental IR spectrum

No experimental IR spectrum for N2 exists because the homo-nuclear diatomic molecule has no permanent dipole moment and therefore lacks the mechanism by which it can interact with the electric field of light. Gaussian's calculated spectrum therefore agrees with experiment.
Vibrations of N2
We expect there to be 1 mode of vibration for the linear molecule using the 3N-5 rule and the fact that there are 2 atoms (N=2). This single mode is obviously a "bond stretch" vibration. However, as explained above, we would never expect to observe this band in an experimental spectrum of gaseous N2.
Charge Analysis
The calculated charges are completely expected. They are both 0 which agrees with the fact that nitrogen is in its elemental form here.
H2
3D view
Summary table for optimised H2
| Details | |
|---|---|
| Molecule | H2 |
| Calculation method | B3LYP |
| Basis set | 6-31G(d,p) |
| Job type | Opt+Freq |
| E(RB3LYP) | -1.17853936 [a.u.] |
| RMS Gradient Norm | 0.00000017 [a.u.] |
| Point group | D |
| H-H bond length | 0.743 [Å] (database[4] value 0.741 [Å]) |
| Item table | |
         Item               Value     Threshold  Converged?
 Maximum Force            0.000000     0.000450     YES
 RMS     Force            0.000000     0.000300     YES
 Maximum Displacement     0.000000     0.001800     YES
 RMS     Displacement     0.000001     0.001200     YES
| |
| Parameters being optimised | |
                          Optimized Parameters
                              (Angstroms and Degrees)

Name  Definition              Value          Derivative Info.

R1    R(1,2)                  0.7428         -DE/DX =    0.0
| |
| H2 optimisation *.log file | |
"Display Vibrations" window

Comparison of computed IR spectrum with experimental IR spectrum

No experimental IR spectrum for H2 exists because the homo-nuclear diatomic molecule has no permanent dipole moment and therefore lacks the mechanism by which it can interact with the electric field of light. Gaussian's calculated spectrum therefore agrees with experiment.
Vibrations of H2
We expect there to be 1 mode of vibration for the linear molecule using the 3N-5 rule and the fact that there are 2 atoms (N=2). This single mode is obviously a "bond stretch" vibration. However, as explained above, we would never expect to observe this band in an experimental spectrum of gaseous H2.
Charge Analysis
The calculated charges are completely expected. They are both 0 which agrees with the fact that nitrogen is in its elemental form here.
Haber-Bosch process calculation
Here we will calculate the energy of the reaction (N2 + 3H2 -> 2 NH3), using the data below which was obtained earlier.
| Property | Value in [a.u.] |
| E(NH3) | -56.55776873 |
| 2*E(NH3) | -113.11553746 |
| E(N2) | -109.52412868 |
| E(H2) | -1.17853936 |
| 3*E(H2) | -3.53561808 |
| -0.0557907 |
Hence, the energy in [kJ/mol], is -0.0557907 * 2625.5 = -146.48 [kJ/mol]. We can conclude that ammonia product is more stable than the gaseous reactants which form it.
Formaldehyde
3D view
Summary table for optimised methanal
| Details | |
|---|---|
| Molecule | H2CO |
| Calculation method | B3LYP |
| Basis set | 6-31G(d,p) |
| Job type | Opt+Freq |
| E(RB3LYP) | -114.50319933 [a.u.] |
| RMS Gradient Norm | 0.00007490[a.u.] |
| Point group | C2v |
| C-H bond length | 1.111 [Å] (database[5] value 1.1110 [Å]) |
| C=O bond length | 1.207 [Å] (database[5] value 1.2050 [Å]) |
| H-C-H bond angle | 115.22 [°] (database[5] value 116.134 [°]) |
| H-C=O bond angle | 122.39[°] (database[5] value 121.93 [°]) |
| Item table | |
         Item               Value     Threshold  Converged?
 Maximum Force            0.000201     0.000450     YES
 RMS     Force            0.000086     0.000300     YES
 Maximum Displacement     0.000213     0.001800     YES
 RMS     Displacement     0.000142     0.001200     YES
| |
| Parameters being optimised | |
                          Optimized Parameters
                              (Angstroms and Degrees)

 Name  Definition              Value          Derivative Info.

R1    R(1,2)                  1.2068         -DE/DX =   -0.0002
R2    R(1,3)                  1.1106         -DE/DX =   -0.0001
R3    R(1,4)                  1.1106         -DE/DX =   -0.0001
A1    A(2,1,3)              122.3908         -DE/DX =    0.0
A2    A(2,1,4)              122.3908         -DE/DX =    0.0
A3    A(3,1,4)              115.2184         -DE/DX =    0.0
D1    D(2,1,4,3)            180.0            -DE/DX =    0.0
| |
| Methanal optimisation *.log file | |
"Display Vibrations" window

Comparison of computed IR spectrum with experimental IR spectrum


Questions pertaining to vibrations of methanal
- How many modes do you expect from the 3N-6 rule?
- We expect there to be 6 modes of vibration for the non-linear molecule using the 3N-6 rule and the fact that there are 4 atoms (N=4).
- Which modes are degenerate?
- None of them are.
- Which modes are "bending" vibrations and which are "bond stretch" vibrations?
- Modes 1,2 and 3 are "bending" vibrations whereas modes 4,5 and 6 are "bond stretch" vibrations.
- Which mode is highly symmetric?
- Mode 4 is the most symmetric.
Charge Analysis
We would expect the oxygen atom (being the most electronegative atom present) to the have the most negative charge, which is what the result of the calculation shows. Surprisingly, the carbon atom bears a more positive charge than the connected hydrogen atoms. This comes as a surprise because the carbon atom has higher electron negativity than hydrogen (2.55[7] and 2.2[7] respectively) and this would make us assume that charge on carbon would be less positive. The reason for this is that the oxygen atom withdraws a lot of electron density surrounding the carbon atom.
Molecular orbitals
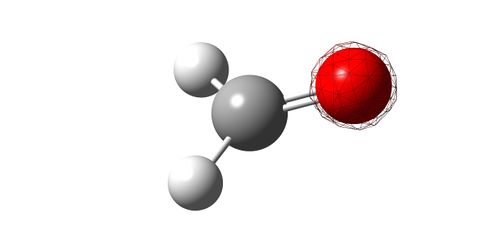
Image showing the deepest bonding MO (mesh).

- The energy of this MO is -19.17 [a.u.]. Clearly, the major contribution to this orbital comes from the oxygen 1s AO. As it is so low in energy, it will never be involved in reactions; it won't ever be used in bonding.
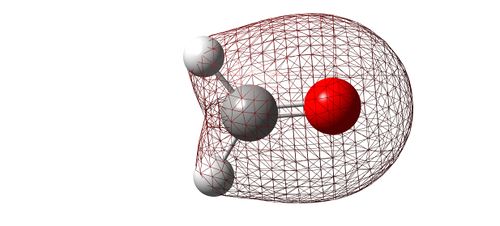
Image showing the bonding interaction between 2s AO's.

- The energy of this MO is much higher in energy than the previously mentioned with an energy of -1.06 [a.u.]. This time, there seems to be an almost equal contribution from both the 2s AO's of oxygen and carbon. This results in a rounded figure; there is slight distortion on the carbon side due to the hydrogen AO's contributing to this MO too. Therefore, there is some degree of "mixing" taking place here. This MO is still probably too low in energy to be involved in bonding.
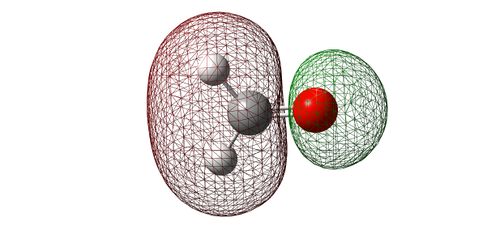
Image showing the antibonding interaction between 2s AO's.

- This this is the result of 2s AO's combining out of phase from oxygen and carbon. The fact that there is a larger coefficient on the more electropositive atom (carbon) indicates that this is indeed the antibonding from the 2s AO's. Yet again, this MO will seldom be used in reactions due to its low energy of -0.637 [a.u.].
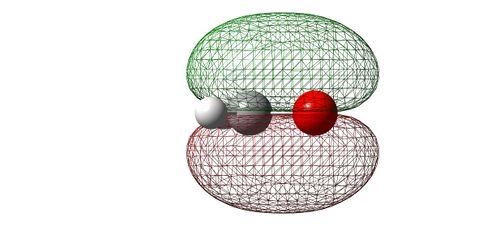
Image showing the bonding MO

- When the 2p orbitals interact in a constructive way from the oxygen and carbon atoms, also in a side-ways manner, the resulting MO is produced. This MO has equal electron density above and below the plane of the molecule. It is the first "pi" orbital we have encountered. It has an energy of -0.399 [a.u.].

Image showing the antibonding MO

- By far the most important MO in this molecule, the antibonding LUMO is responsible for nucleophilic addition to the carbonyl group, for example. It has an energy of -0.043 [a.u.] so is willing to accommodate electrons provided by nucleophiles. Yet again, the larger coefficient on the carbon atom helps us confirm that this is an antibonding MO. Nucleophiles attack the carbon coefficient at an angle of 107 [°], known as the Burgi-Dunitz trajectory.
References
- ↑ 1.0 1.1 http://cccbdb.nist.gov/exp2x.asp?casno=7664417, (accessed March 2017).
- ↑ J. Melville, Infrared Spectroscopy and Interferometry as Methods for Structural Determination of Ammonia, Science, (No date), 2, https://www.ocf.berkeley.edu/~jmlvll/lab-reports/FTIR-NH3/FTIR-NH3.pdf, (accessed March 2017).
- ↑ Computational Chemistry Comparison and Benchmark DataBase, http://cccbdb.nist.gov/exp2x.asp?casno=7727379, (accessed March 2017).
- ↑ http://www.millsian.com/summarytables/SummaryTables022709S.pdf, (accessed March 2017).
- ↑ 5.0 5.1 5.2 5.3 http://cccbdb.nist.gov/exp2x.asp?casno=50000, (accessed March 2017).
- ↑ https://www2.chemistry.msu.edu/faculty/reusch/virttxtjml/Spectrpy/InfraRed/infrared.htm, (accessed March 2017).
- ↑ 7.0 7.1 https://en.wikipedia.org/wiki/Electronegativities_of_the_elements_%28data_page%29, (accessed March 2017).