Rep:Mod:rvirdee2
3rd Year Computational Lab Module 2:
Bonding (Ab initio and Density Functional Molecular Orbital)
Rajvinder Virdee
Introduction:
From module 1 of the course, we learnt how to apply the basic types of calculations in computational chemistry to small organic compounds. In this module, we extended this knowledge and moved towards applications in Inorganic chemistry. Organic systems generally only contain "small" atoms, from the first two rows of the periodic table, with small numbers of electrons. However, as we start to study heavier elements in Inorganic Chemistry, we need to be able to extend these same calculations to systems containing more electrons. As these quantum methods require iterative solving of the Schrödinger equation, and as we are using systems with many more electrons, this starts becoming more and more complicated.
To start off the module, we looked at a small inorganic molecule, borane (BH3). Using this, we learnt how to optimise the structure using a good basis set for the system, and check whether or not the optimisation had reached the true ground state. We then looked at the vibrations of the molecule, which became of more importance later. We looked at the molecular orbitals of BH3 as calculated by the Gaussian Interface to the orbitals generated via the LCAO approach, therefore we can see how well LCAO can be applied to real depictions of orbitals. We then moved to a heavier molecule with a similar structure (trigonal planar), we used Thallium Bromide (TlBr3). As this is a system with many more electrons than borane, using a basis set that modelled all of the electrons would lead to an extremely time consuming calculation. Therefore, we used what is called psuedo-potentials to model the core electrons of the system as a potential as opposed to a nucleus and electrons. This allowed for a much faster reaction time.
After this, we moved on to look at how the IR spectrum of a transition metal complex is affected by its geometry of ligands being cis- or trans-. Again, psuedo potentials were used to speed up the calculation, this was required as Molybdenum was used as the metal. The complex used to observe the change was the octahedral compound Mo(CO)4(PCl3)2. We also learnt how we can replace large computationally demanding groups with smaller groups that can allow the calculations to run much faster. In the second year lab, we looked at the isomers of Mo(CO)4(PPh3)2, however, as the phenyl group is extremely demanding, we replaced it with chloride. The results calculated for the PCl3 form were then compared against literature values for the PPh3 so we can see how accurate the results are compared against the original complex.
Finally, we moved on the mini-project part of the module. For this, I looked at N-heterocyclic silylenes and the factors that effect their stability. I shall look at the effect of sterics on the thermodynamics of the silylene (mainly to see if there is any effect) and how the electronic nature of the R groups bound to the nitrogen effects electron donation to the silicon centre and how it effects the overall stability. I shall use various computational methods, including optimisations, frequency calculation and analysis, NBO analysis and MO analysis all to try an ascertain why and how certain parameters effect their stability. Obviously, however, due to time restrictions, I was unable to get to the full underlying causes for this stabilising/destabilising of the structures, however, using the analysis from results I obtained from various calculations, I made a good attempt to explain what was observed, with full justification of my propositions.
DFT Optimisation of BH3:
To learn how the Gaussian and GaussView interfaces worked, the borane molecule, BH3, was used for a simple optimisation calculation. Firstly, the molecule was drawn in GaussView using the functions palette and the periodic table interface, and picking the geometry of the boron-based fragment to be trigonal planar. Once this setting had been fixed, and the mouse was clicked on the MolGroup window, a molecule of BH3 appeared in the window. The Gaussian Calculation dialogue box was opened and the calculation was set up with the following parameters:
Job Type: Optimization
Method: DFT (Density Functional Theory)
Theory: B3LYP
Basis Set: 3-21G
Results of the Optimisation:
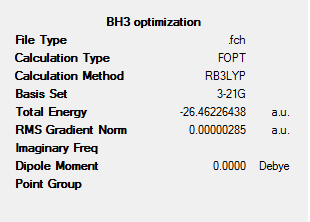
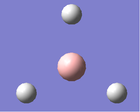
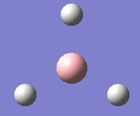
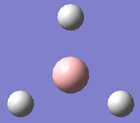
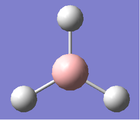
The job was submitted on the laptops as the calculations were relatively simple. Although the two molecules were relatively similar in structure, their B-H bond lengths were infact different. The two structures, both pre-optimised and optimised are shown below.
 | |||||||
|---|---|---|---|---|---|---|---|
|
| ||||||
Analysis of the Results:
To check whether or not the optimisation had occured properly, we need to look at the final set of forces and displacements to check whether or not the calculation had converged. The following lines were present in the output...
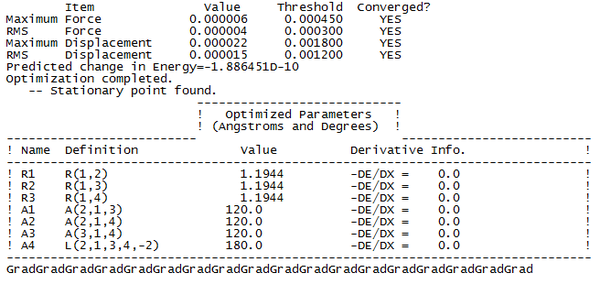
This tells us that the calculation has reached completion, as both the derivative of the force and the displacement had dropped below the present threshold value, and the structure is the fully optimised form of BH3. Once the calculation was complete, we could analyse the output file in GaussView, and generate the forms of the structure, their energy, and the derivative of the energy at each iterative step of the calculation.
| Optimisation Step | Structure | B-H Bond Length (Å) | Plot of Energy and RMS Gradient |
|---|---|---|---|
 |
 | ||
 |
|||
 |
|||
 |
|||
 |
As we can see from both the graphical representation of the data, and the Gaussian Log file output, the optimisation calculation of BH3 is complete. We can see from the images of each step of the calculation and from the B-H bond lengths generated from the Gaussian programme, that initially, the B-H bond length was 1.5 Å (as set in the input file) and the calculation brings the Hydrogen atoms closer to the Boron centre to try to minimise the energy of the structure. As we can see from the plot of the energy against the optimisation step given by the programme, as the bond length is decreased, the energy of the molecule decreases (i.e. becomes more negative), thus resulting in the structure becoming more stable. By step 5, the change in the energy between the two structures has fallen below the pre-set threshold value as defined by the programme therefore indicating the structure has reached its minimum energy state.
Molecular Orbitals of BH3:
Not only can we use DFT based calculations to optimise the structure of a molecule (in terms of energy and geometry), we can also use it to generate the Molecular Orbitals of a molecule. To show how this is done, firstly we shall construct the MO diagram for BH3 and use LCAO to determine the vague form we expect from the MOs. Then, using the DFT calculation, we shall generate the computer's solution to the MOs (giving a more accurate depiction), and use these to look at the accuracy of LCAO in predicting the shape and geometry of the orbitals.
Molecular Orbitals Generated via LCAO:
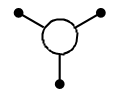
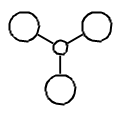
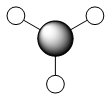
The Molecular Orbital diagram for BH3 is shown below. The molecule was split into two fragments, one with all three hydrogen atoms, the other with just the boron atom. The Molecular orbitals have been drawn as simple LCAO orbitals, by simply overlaying the contributing orbitals on top of eachother.
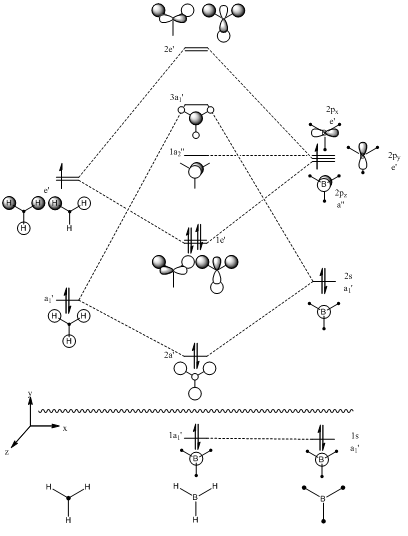
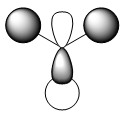
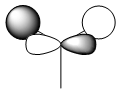
To generate the MO diagram above, the molecule was split into 2 parts, one fragment containing the 3 hydrogen atoms, and the other the boron centre. As we have a total of 8 orbitals from the 2 fragments we used, we expect there to be 8 molecular orbitals in the system. As you can see above, the symmetries and the LCAO depiction of each orbital has been drawn. We can now go on and compare these LCAO form of the Molecular Orbitals with those calculated using the DFT method.
Molecular Orbitals Generated via DFT Calculation:
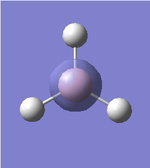
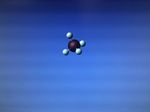
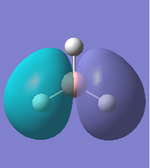
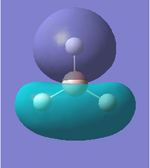
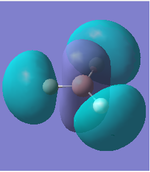
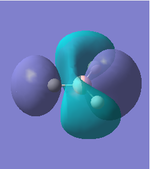
As a part of the optimisation calculation for BH3, as we are using a DFT based calculation, the Gaussian interface also generates the Molecular Orbitals of the molecule. As discussed above, the LCAO form of the orbitals can be easily generated from the MO diagram, however now, we shall compare these simple depictions with more accurate forms of the orbitals.
| Molecular Orbital | LCAO Predicted Form | DFT Calculation Depcition | Orbital Symmetry | Energy wrt H Atom (amu) |
|---|---|---|---|---|
 |
 |
|||
 |
 |
|||
 |
 |
|||
 |
 |
|||
 |
 |
|||
 |
 |
|||
 |
 |
|||
 |
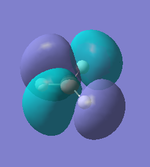 |
As we can see from the comparison above, LCAO gives us a very good approximation to the shape and relative energies of the orbitals. Although we heavily simplify the orbitals and the mathematics to use LCAO, the general shape between those orbitals, and those calculated in the DFT method do show a good likeness to eachtother. On top of that, LCAO also predicts the same ordering of the orbitals (order of energies), however, its obviously cannot predict the exact energies. One interesting observation was that in the case of LCAO, we only predict 8 Molecular Orbitals for BH3, however, the output of the calculation gives us 15 orbitals. This is because of the basis sets used. When we use the LCAO method to generate molecular orbitals, we usually only consider orbitals up to and including the valence orbitals on any species. However, using the basis set used in the calculation, we include more orbitals. The more orbitals used in the calculation, the more molecular orbitals generated. For a simple system such as BH3, we have seen that LCAO can give us a good fit to the orbitals, however, we can predict that more likely than not, LCAO will have its failures for more complicated systems with more atoms and more valence electrons.
Natural Bond Order Analysis of BH3:
 |
|---|
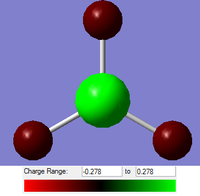
As well as just looking at the molecular orbitals of BH3 to look at the electronic distribution in the molecule, we can perform NBO (Natural Bond Order) Analysis. Using this, instead of looking at the orbitals for electronic distribution, we can use the calculation to put a number on this. As Gaussian is a simple graphical interface, we can either view the data as a contoured colour depiction of the molecule, or as a number for the charge on each atom. As we know trivalent boron compounds tend to be Lewis Acidic, with an empty pz orbital, we would expect to see a lower electron density on the boron centre than on the the hydrogen atoms. And this is what we observe. The GaussView interpretation of the numbers is shown to the left. Red implies that there is a high electron density localised in those positions, and green implies a low electron density. As we can see from the diagram, the three hydrogen atoms are in fact shaded red, and the boron atom is shaded green.
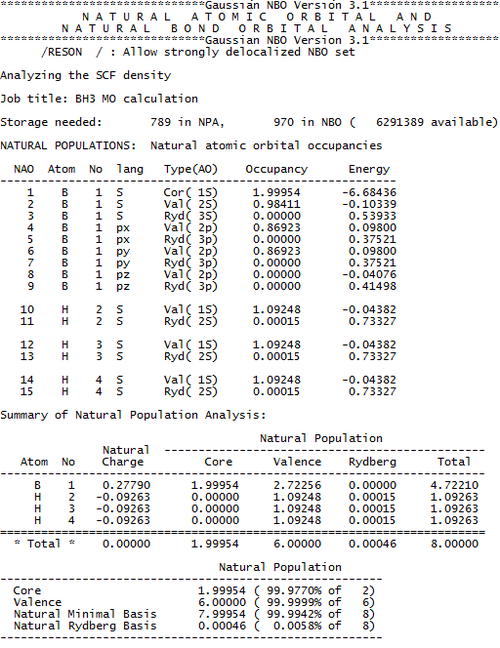
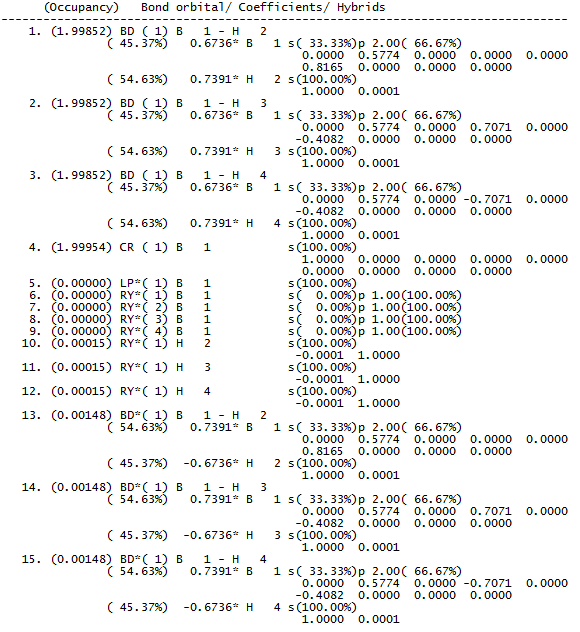
However, what if we want to go further than this? What if we want to know the exact numbers relating to the electron density. GaussView cannot help us there, however, we can look into the Gaussian Log File for our answers. Deep within the log file, we can find a section titled "Natural Atomic Orbital and Natural Bond Order Analysis". In this part of the file, we can find details concerning the charge density, the occupancy of each orbital and the bond orders. Those results of interest are displayed below.
 |
 |
|---|
From this data, we can draw some interesting conclusions:
- The H atoms have a larger proportion of the electrons localised upon them than the boron atom.
- In the B-H bond, approximately 45% of the electron density is from the boron atom, and 55% from the hydrogen atom.
- The boron based orbitals forming the bond have c.a. 33% s character, and 67% p character, therefore, we can say the boron is sp2 hybridised (as expected, as we have an empty pz orbital, therefore would expect sp2 hybridisation).
- The hydrogen based orbitals forming the bond have 100% s character (as expected, as the only orbitals energetically accessible to Hydrogen are s orbitals).
Vibrational Analysis of BH3:
To confirm that the optimisation of the molecule is complete, and has not ended abruptly, or the calculation has not converged, we can use vibrational analysis of the optimised structure. To understand the background to vibrational analysis, we must go back to the basic concepts of derivatives and turning points of functions.
 |
|---|
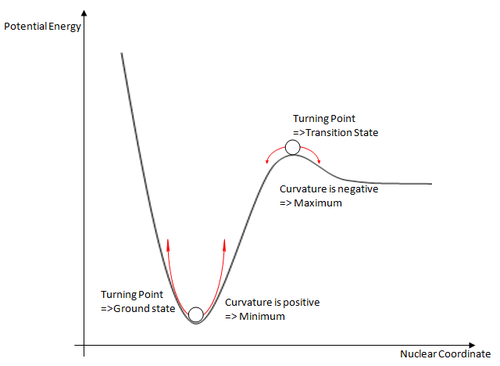
The calculation determines whether or not the solution has converged by looking at the gradient of the potential energy surface. However, if we look at the PE surface drawn to the left, both the ground state and the transition state of a molecule both have a gradient equal to zero. To determine whether or not we are actually at the ground state of the molecule, or the transition state, we must look at the second derivative of the potential energy surface to determine the nature of the turning point.
The second derivative of the potential energy surface is known as its curvature. Using this we can discern between the two turning points and assign them as either a minimum or a maximum. As discussed above, a maximum implies that we have a transition state, whereas a minimum implies a ground state for the molecule has been found.
Bringing this back to the idea of vibrational analysis, we can use this to our advantage. Once the vibrations have been generated for a molecular system, we can analyse the data, and quickly see if we truly have the ground state. As the curvature is negative for the turning point, it gives us "negative frequencies" in the vibrational calculations. Obviously, this cannot exist in real life, and are only negative because of the negative curvature. So, if we have any vibrations with a negative frequency in the vibrational calculations, we have optimised to a transition state, and not a ground state geometry of the molecule in question.
To check whether or not the vibrational calculation has been successful, we look in the log file from the calculation and look at the "low frequencies". The following lines were present in the text...
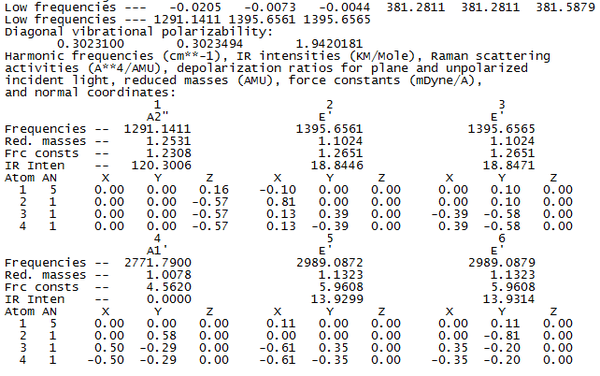
As the largest "low frequency" is approximately an order of magnitude than the lowest normal mode of vibration, we can say that the results will be acceptable to analyse. The origin of low frequencies is from the the 3N-6 number of vibrational modes for a non-linear molecule. The low frequencies correspond to the "-6" term in the number of vibrations, hence we have 6 of them in the log file.
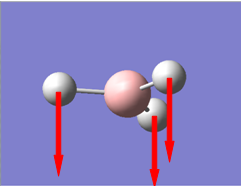
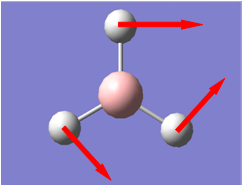
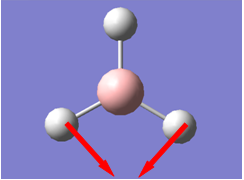
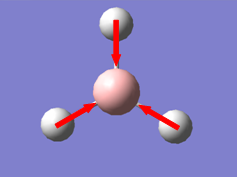
As we now know what to look for in the vibrations calculation output to check whether or not we have reached a ground state optimisation, we can go on to do this calculation. It was set up using the same method (DFT), type (B3LYP), and basis set (3-21G) as used in the optimisation calculations, as this is only way to ensure the results have any real significance, and can be fairly analysed. The results of the vibrations calculation are displayed below.
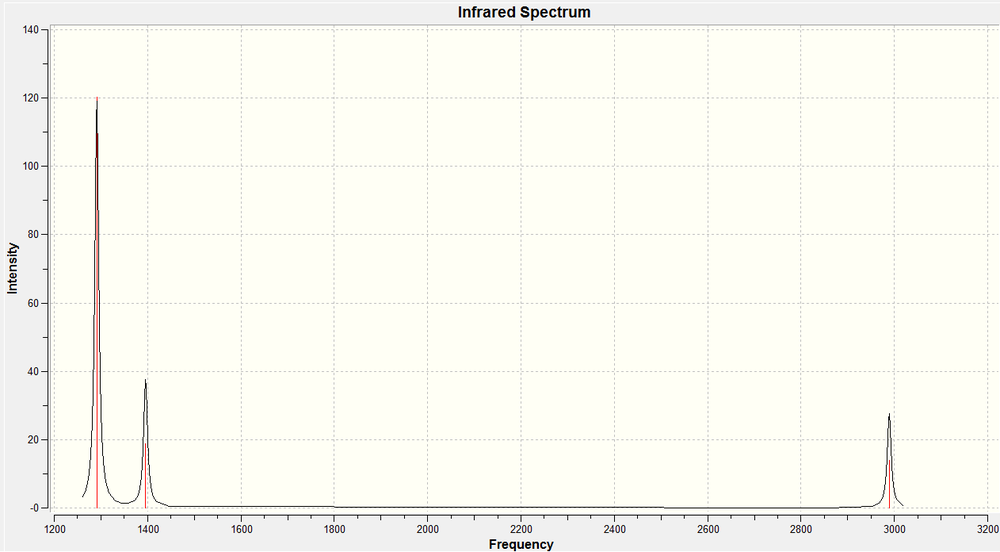
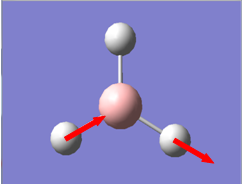
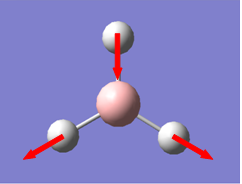
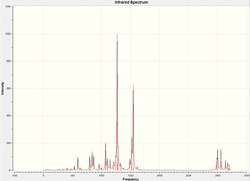
The calculation predicts 6 different vibrational modes for BH3, however, in the IR spectrum, we only observe 3 peaks. This can be explained for two reasons. Firstly, the vibration at 2772 cm-1 will not show up on IR. Infra-red spectroscopy can only detect vibrations that cause a change in the dipole of the molecule, and as that vibration has the same symmetry as the whole molecule, we do not observe this vibration in the spectrum (and hence the calculation gives it an intensity of 0). Also we observe two sets of degenerate vibrational modes, (at 1397 and 2989 cm-1), hence instead of four peaks, we only observe two for these vibrations. So, by combining these two facts, we arrive at 3 peaks being visible in the IR spectrum.
Links to Calculations:
| Calculation | Reference | DOI |
|---|---|---|
| Calculation of BH3 Molecular Orbitals | http://hdl.handle.net/10042/to-6870 | DOI:10042/to-6870 |
Using Psuedo-Potentials in the DFT Optimisation of TlBr3:
The use of Psuedo-potentials is an attempt to simplify the Schrödinger equation for systems that contain a large number of electrons. It does this by replacing the motion of the core (non-valence) electrons of the atom and its nucleus by an "effective potential", or "psuedo-potential". This psuedo-potential replaces the Coulombic potential terms for these parts in the Schrödinger equation thus vastly simplifying the calculations. In this part of the module, we will be investigating the molecule TlBr3, a molecule with a large number of electrons (321 electrons in total). Doing a calculation using the Schrödinger equation (i.e. a quantum based calculation) would be extremely time and resource consuming, therefore, it is obvious how useful the use of psuedo-potentials is in this case.
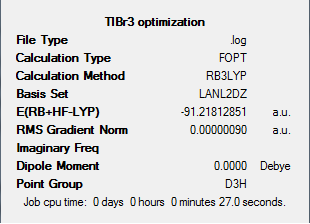
As the elements in use in this part of the investigation have vastly more electrons, we must use a more complicated basis set than that used in previous calculations in this course. As the system being investigated gets more and more complicated, we need a larger range of orbitals to describe it in any real detail. Therefore, in the case of this system, we use a larger basis set, the LanL2DZ set. This is a combination of 2 different basis sets, one for first row elements (D95V) and one for heavier ones (Los Alamos ECP). The Los Alamos ECP basis set contains the psuedo-potential part of the calculation. Again a DFT type calculation was run to optimise the structure of the B3LYP type. This combination of method and basis set gives us medium level of accuracy. We could use a more accurate basis set with more complex psuedo-potentials, but these take much longer to compute, and therefore, are unnecessary for this part of the investigation.
Results of the Optimisation:
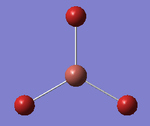
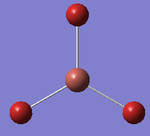
Again, like the case of the BH3 optimisation done earlier, just by looking at the pre-optimised and the optimised structure, we cannot tell the difference between the two structures, however, by looking at the Tl-Br bond length before and after optimisation, we can see the slight difference between the two structures. To perform the calculation, the point group of TlBr3 was set as D3h. This means that during the optimisation, all structures must have that same point group. We do this to ensure the molecule stays in a planar structure during the optimisation, and does not deform into a pyramidal form.
 | |||||||
|---|---|---|---|---|---|---|---|
|
| ||||||
Analysis of the Results:
To check whether or not the calculation had actually reached completion, and not ended prematurely, the Gaussian Log file was examined to look for indications that the energy had reached a minimum. The following lines were present in the output...
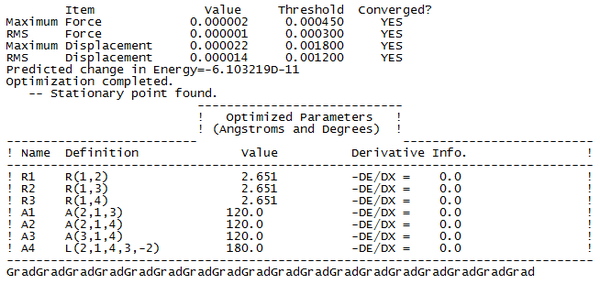
This tells us that the calculation has reached completion, as both the derivative of the force and the displacement had dropped below the present threshold value, and the structure is the fully optimised form of TlBr3. Once the calculation was complete, we could analyse the output file in GaussView, and generate the forms of the structure, their energy, and the derivative of the energy at each iterative step of the calculation.
| Optimisation Step | Structure | Tl-Br Bond Length (Å) | Plot of Energy and RMS Gradient |
|---|---|---|---|
 |
 | ||
 |
|||
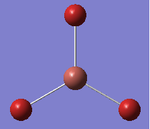 |
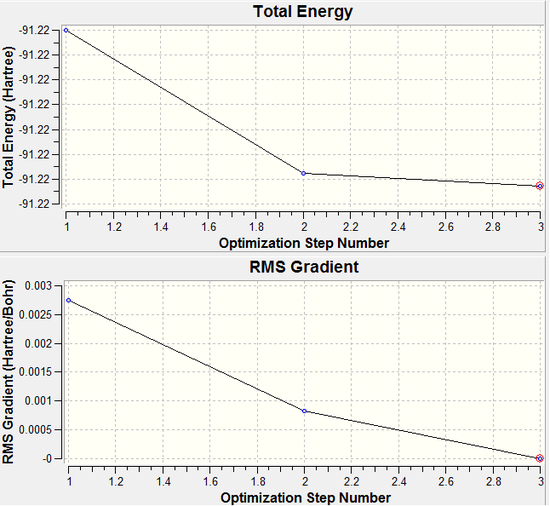
As we can see from both the graphical representation of the data, and the Gaussian Log file output, the optimisation calculation of TlBr3 is complete. We can see from Tl-Br bond length was 2.69 Å (as set in the input file) and the calculation brings the Bromine atoms closer to the Thalium centre to try to minimise the energy of the structure, until the bond length is 2.65 Å (lit=2.52 Å [1]). As we can see from the plot of the energy against the optimisation step given by the programme, as the bond length is decreased, the energy of the molecule decreases (i.e. becomes more negative), thus resulting in the structure becoming more stable. By step 3, the change in the energy between the two structures has fallen below the pre-set threshold value as defined by the programme therefore indicating the structure has reached its minimum energy state.
Vibrational Analysis of TlBr3:
Once the molecule of TlBr3 was optimised, we performed vibrational analysis on the output molecule to check whether or not we had reached the ground-state of the molecule (c.f. BH3 vibrational analysis). Again, we had to ensure that the calculation conditions were the same as those used for the optimisation, i.e. same method, type, basis set, etc. To check whether the output of the calculation was worth analysing, we looked at the "low frequencies" of the molecule, and their relative size to the normal modes of vibration. The significant part of the output file is shown below...
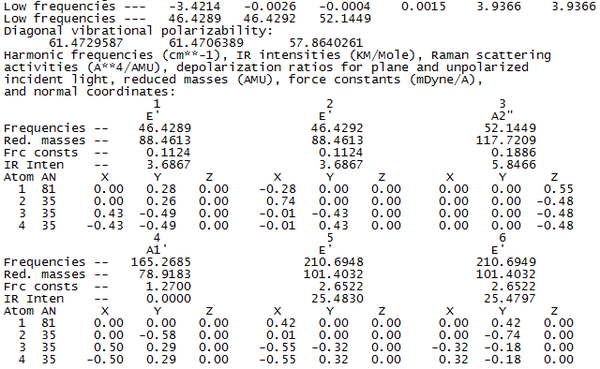
As we can see from the output file, the highest frequency "low frequency" vibration is about 1 order of magnitude smaller than the lowest frequency normal mode of vibration. Therefore we can say the calculation result is valid, and continue with the analysis of the results of the calculation. The calculated vibrations are shown below.
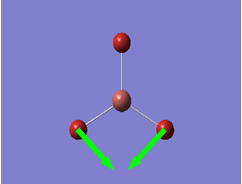
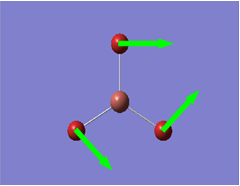
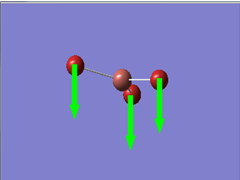
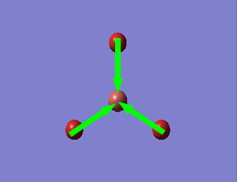
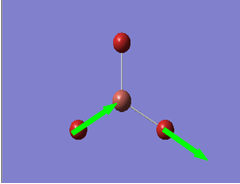
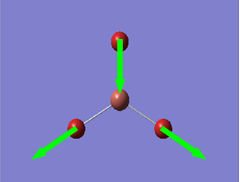
As we can see from the vibrations calculated above, we observe a different ordering of the vibrations in terms of energy between BH3 and TlBr3. This can be explained by the large increase in reduced mass for the Thallium compound from borane. This increases the energy of the vibration where the three bromine atoms move up and down with respect to the other vibrations, as it results in the largest change in centre of mass in the molecule.
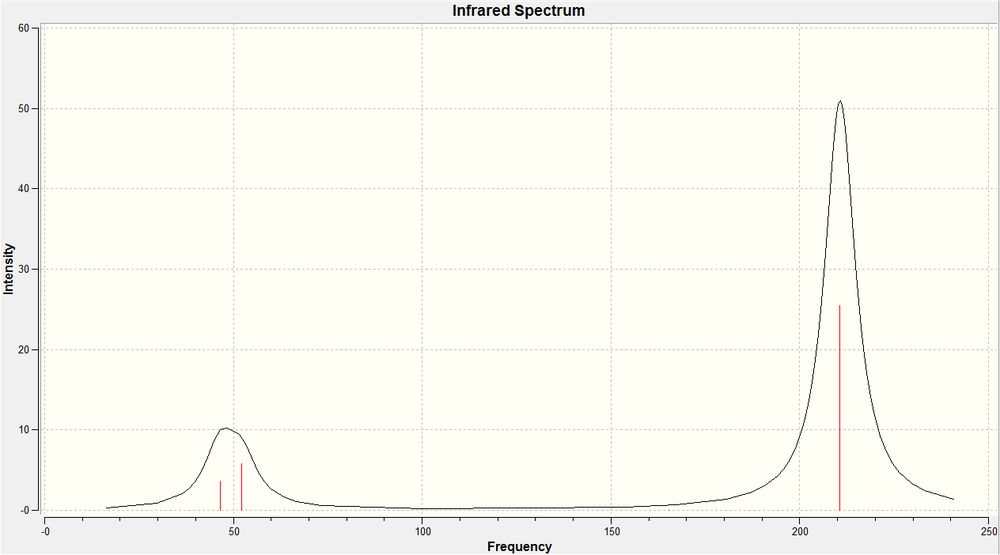
The calculation predicts 6 different vibrational modes for TlBr3, however, in the IR spectrum, we only observe 3 peaks. This can be explained for two reasons. Firstly, the vibration at 165 cm-1 will not show up on IR. Infra-red spectroscopy can only detect vibrations that cause a change in the dipole of the molecule, and as that vibration has the same symmetry as the whole molecule, we do not observe this vibration in the spectrum (and hence the calculation gives it an intensity of 0). Also we observe two sets of degenerate vibrational modes, (at 46 and 211 cm-1), hence instead of four peaks, we only observe two for these vibrations. So, by combining these two facts, we arrive at 3 peaks being visible in the IR spectrum.
What is a Chemical bond?:
Sometimes, GaussView will not draw in the bonds between atoms, even though we know that there should be a bond there. This shows a limitation of GaussView. GaussView has a predetermined set of bond lengths (generally tailored towards organic compounds), and if the bonds lengths computed are outside of this range, GaussView will not draw in the bonds. However, it still knows that there is electron density localised in the area between the two atoms in question. This brings us to a more important question however. What is a chemical bond?
The IUPAC definition of a bond is as follows...
"There is a chemical bond between two atoms or groups of atoms in the case that the forces acting between them are such as to lead to the formation of an aggregate with sufficient stability to make it convenient for the chemist to consider it as an independent "molecular species" [2]
Just as many IUPAC definitions are, this is a very vague description of what a chemical bond is. I would define it differently. In my view, a chemical bond refers to an area of localised electron denisty between two or more nuclear centres. The energy of the electrons in this area is such that it is lower than the energy of the electrons if they were not found between the nuclei. This area of electron density keeps the nuclei together via strong electrostatic interactions. If the two adjacent atoms have electronegativities that are similar, they share the electron density between them (a covalent bond). If however, one is more electroneative than the other, the bond becomes polarised towards the centre than is more electrophilic. In the extreme case of this, where one centre is significantly more electronegative than the other, not only is the bond polarised, but the more electronegative atom will completely pull the electrons off the other atom causing ionisation, and the formation of an anion and a cation pair (an ionic bond).
Cis and Trans isomers of Mo(CO)4L2:
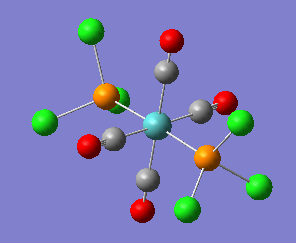
We can also use computational methods to analyse the different isomers of transition metal complexes. In this part of the investigation, we shall look at the cis and trans isomers of Mo(CO)4(PCl3)2. In the second year labs, we synthesised the cis and trans isomers of Mo(CO)4(PPh3)2 and identified which was which via the use of infra-red spectroscopy. An ideal situation would be that we could analyse that exact same compound using computational methods to predict the structure and vibrational spectra of the two molecules. However, we encounter problems when running calculations with phenyl groups, and this is compounded when we have to consider 6 phenyl groups in the same molecule. The calculation must scan through 360o of rotation of each phenyl group, which could lead to numerous localised energy minima, not the true ground-state minimum, due to steric interactions, making the calculations extremely demanding with respect to computing resources. Therefore, it has been deduced that using chloride groups gives very similar results to phenyl groups, therefore we shall use these to model the system.

Optimisation of the Complexes:
Due to the highly sensitive nature of the complexes in question, we cannot assume that just running an optimisation and getting the correct geometry for the two products will occur. Therefore, we must do the optimisation on 3 steps, the first being a loose optimisation with a low basis set, second being the changing of the geometry to the expected orientation, and the third being a more accurate optimisation with a higher basis set. Both optimisations were run using DFT methods.
The first level of optimisation was run in a DFT method with a B3LYP calculation type. This was then run with a LANL2MB basis set with the calculation set to loose convergence using the keywords "opt=loose". LANL2MB is a combination of numerous basis sets, with STO-G3 being used on the first row elements, then Los Alamos ECP being used on the rest (plus MBS on Na-La and Hf-Bi). This gave us the product optimised to the first level. The relative orientations of the phosphorus based substituents to what we expect them to be in the final product. This is to stop the calculation from stopping in localised energy minima (as discussed above). In the case of the cis isomer, the torsion angle between the chloride and the carbonyl groups was set to 180o. For the trans complex, this was also set with the same torsion angle, but also, we set the phosphorus based groups to eclipse each other. Once this was done, we moved to the finer level of optimisation. This time, we used the LANL2DZ basis set, running D95V basis set on first row elements, and Los Alamos ECP on the rest (plus DZ on Na-La and Hf-Bi) with the keywords "int=ultrafine scf=conver=9".
As we can see, the energies of the two products are very similar, there is only a difference of 0.001 amu between the two. This corresponds to ca. 3 kJmol-1 which in terms of the energy of a reaction, is very little. Therefore, we would expect the relative proportions of each product to be determined by the kinetics of the reaction. The result of this energy difference is interesting, as we would expect there to be a strong preference to form the trans isomer due to possible steric clashes between two adjacent -PCl3, however, perhaps this steric interaction effects the kinetics (i.e. the rate of formation and the mechanism) as opposed to the thermodynamics.
We could adjust the relative energies of the two products by adjusting the nature of the groups on the phosphorus ligands. This would most probably only effect the cis complex however. Using more electron withdrawing groups instead of the standard alkyl groups, we could remove electron density from the Molybdenum centre, and thus reduce the degree of back-bonding to the carbonyl ligands. The flip side of this is also true, we could use electron donating ligands to increase electron density on Molybdenum and therefore increase the degree of back-bondong. A common modification done to these phosphorus ligands is to add groups to make the complex water soluble. Such a case is the use of R=C6H5SO3-Na+ in the case of catalysts used in hydroformylation[3]. Before these are synthesised, one could run computer based calculations on these catalysts to observe how labile the ligands are, and other calculations to determine how effective a catalyst they would be, instead of having to synthesise the compound first, and observe how effective it is via a practical means.
Vibrations of the Cis- Complex:
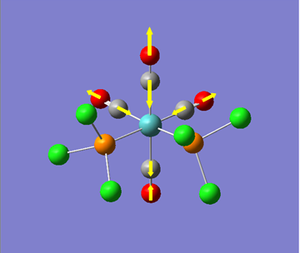
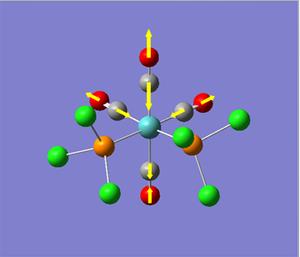
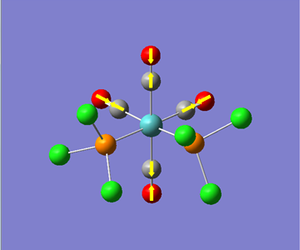
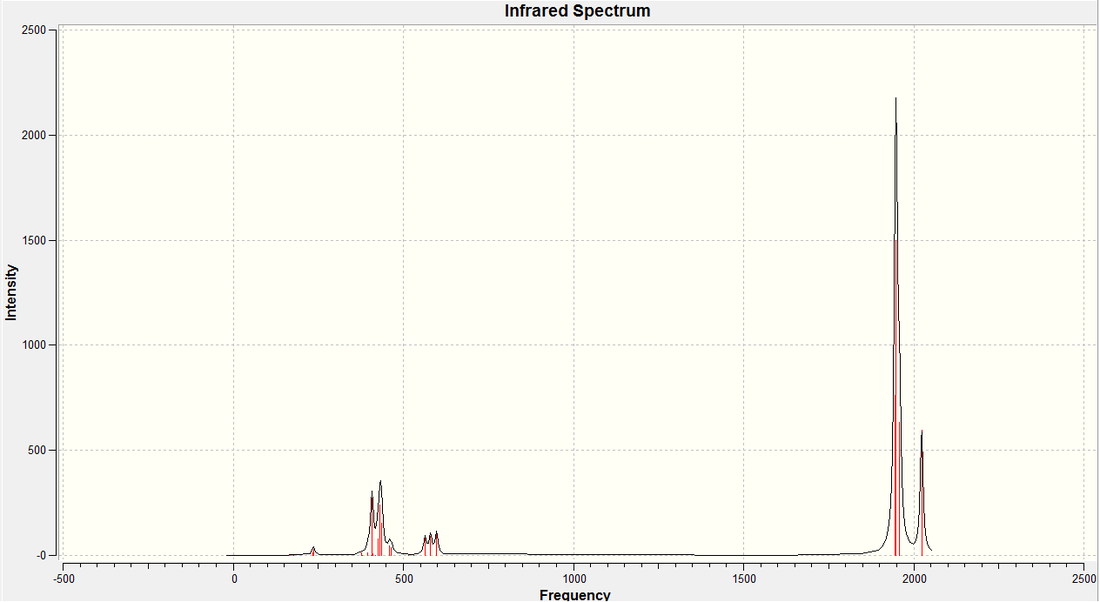
Once the structure of the cis- complex had been fully optimised, the vibrations of the molecule we calculated. It was ensured that the same calculation method, type and basis set were used, to ensure that the results could be analysed properly and with some degree of accuracy. We are particulary interested in the carbonyl stretches in the complex, so these are what we shall concentrate on. The carbonyl strteches is what would allow us to differentiate between the two products in a practical environment. The vibration, their energies, and their intensities are shown below...
| Calc. ν C=O (cm-1) | Lit. ν C=O (cm-1) [4] |
|---|---|
In the case of the cis complex, all of the possible C=O vibrations are observed in the IR spectrum. The cis complex has no axes of rotational symmetry through any of the bonds, therefore, every vibration of the carbonynl groups will result in a change in the dipole of the molecule. As we know, IR spectroscopy only shows up vibrations that cause a change in dipole, therefore, all of he vibrations result in signals in the spectrum. In this part of the investigation, not only were we looking at prediction of IR spectrum to differentiate between the two products, but at how well we can use the ligand PCl3 as a computationaly less demanding form of PPh3, therefore, we can compare the calculated vibrations using the PCl3 ligand, and values reported for the compex using PPh3 from literature. These can be seen in the table to the left. As you can see, there seems to be quite a large degree of error in the calculated values (using PCl3) and the literature values (using PPh3), except for the vibration when all 4 carbonyl groups vibrate in phase with each other.
Vibrations of the Trans- Complex:
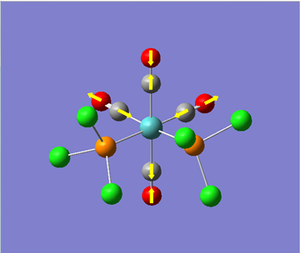
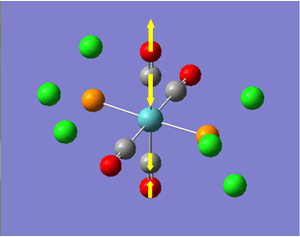
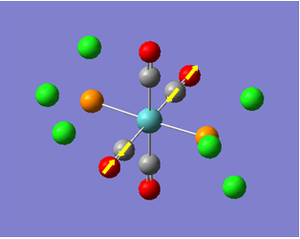
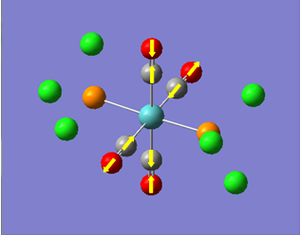
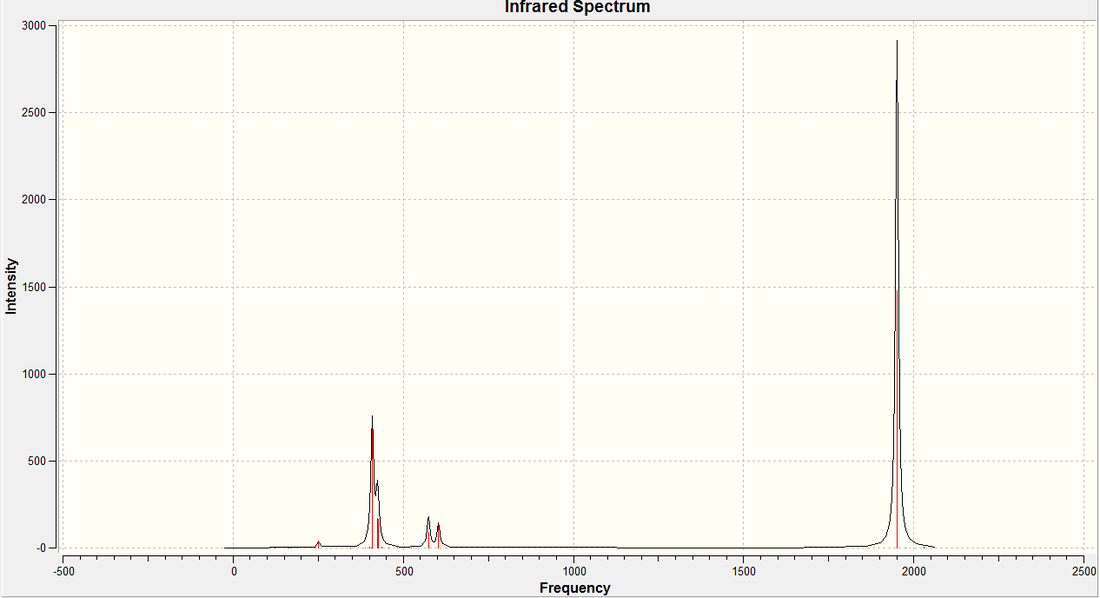
Once the structure of the trans- complex had been fully optimised, the vibrations of the molecule we calculated. It was ensured that the same calculation method, type and basis set were used, to ensure that the results could be analysed properly and with some degree of accuracy. We are particulary interested in the carbonyl stretches in the complex, so these are what we shall concentrate on. The carbonyl strteches is what would allow us to differentiate between the two products in a practical environment. The vibration, their energies, and their intensities are shown below...
| Calc. ν C=O (cm-1) | Lit. ν C=O (cm-1) [5] |
|---|---|
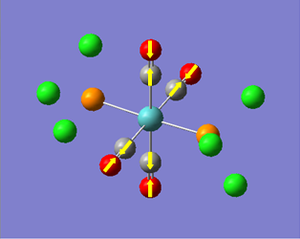
In the case of the trans complex, we have numerous axes and planes of symmetry in the molecule (symmetry group is D4h) which has a profound effect on the vibrational spectrum. The first two vibrations (in terms of energy) both create a change in dipole moment in the molecule and are therefore observed in the spectrum. However, they are so close in energy (we would actually expect them to be degenerate due to symmetry, however, the calculation has come up with non-degenerate vibrations) that one would only observe one peak in the IR spectrum because of them. The last two however, create very little change in the dipole of the molecule, and therefore, are not observed in the IR spectrum. The comparison between the calculated and literature values for the carbonyl stretch are given to the right. As you can see, there seems to be quite a large degree of error in the calculated values (using PCl3) and the literature value (using PPh3). As discussed above, it is assumed that both vibrations should be degenerate, and this is what is observed in literature.
Links to Calculations:
| Calculation | Reference | DOI |
|---|---|---|
| 1st Optimisation of the Trans-Complex | http://hdl.handle.net/10042/to-6864 | DOI:10042/to-6864 |
| 1st Optimisation of the Cis-Complex | http://hdl.handle.net/10042/to-6865 | DOI:10042/to-6865 |
| 2nd Optimisation of the Trans-Complex | http://hdl.handle.net/10042/to-6866 | DOI:10042/to-6866 |
| 2nd Optimisation of the Cis-Complex | http://hdl.handle.net/10042/to-6867 | DOI:10042/to-6867 |
| Cis-Complex Frequency Calculation | http://hdl.handle.net/10042/to-6868 | DOI:10042/to-6868 |
| Trans-Complex Frequency Calculation | http://hdl.handle.net/10042/to-6869 | DOI:10042/to-6869 |
Mini-Project: Stability of N-Heterocyclic Silylenes:
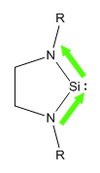
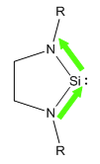
It has been known that carbenes can be stabilised by the use of nitrogen based heterocycles to donate electron density into empty pz orbitals on the carbene carbon. The first main example of this type of molecule was reported by Arduengo et al in 1991[6]. Ever since, various groups have tried to find other methods to stabilise carbenes in a similar fashion. In the case of carbon, the triplet state is the favoured carbene over the singlet. However, the singlet state can be stabilised by the use of the nitrogen atoms in a five membered ring. This occurs by the lone pairs on nitrogen donating electron density into the vacant pz, reducing the energy of the orbital, and therefore stabilising the molecule.
Soon after this was found, researchers started to push the boundaries further to see whether corresponding compounds could be made with other group 14 elements. Silicon was an obvious starting point, just 1 row below carbon. Unlike carbon however, in the case of silicon, it is the singlet state that is favoured over the triplet (due to better mixing of orbitals), therefore, we would expect that the addition of nitrogen into the system, should stabilise these products further. The first recorded occurance of an N-heterocyclic Silylene was by West et al in 1994 [7], synthesising what is now known as West's Silylene
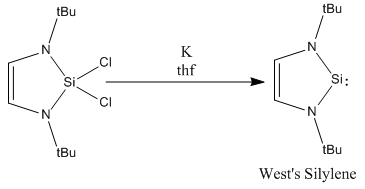
When West's silylene was introduced to Et3SiH, no reaction was observed, which implied that the pz orbital was no longer vacant to attack by a nucleophilic species. Building on this coumpound made by West et al, I shall investage numerous different structures of N-heterocyclic silylenes by varying the steric and electronic nature of the groups bound to the nitrogen. To investigate the effect of sterics, calculations shall be run where R=Me and R=tBu, and to investigate the effect due to the electronic nature, I shall use R=Ph, R=PhOMe and P=PhNO2.
Proposed Structures to Investigate:
As discussed above, there are two different areas that shall be investigated in looking at the stability of the silylenes. The first area is steric bulk. We could conventionally attribute sterics as being a kinetic effect, and therefore, we wouldn't expect to see a significant difference in these types of calculations. However, we know that due to hyperconjugation, alkyl groups can donate electron density, sp perhaps we will see some electronic effect. Also, the increase steric bulk could effect the ring strain on the 5 membered ring containing the silylene, with the tBu group acting as a conformational lock, forcing the Si-N bond length to increase. The two structures that shall be used to investigate sterics is one with a methyl substituent, and one with a tBu. In an ideal case, perhaps we could use two more extreme cases, however, due to limited computational resources and time, these are the two groups I shall consider.

The second criteria that I shall investigate is the electronic nature of the substituents. Using a phenyl substituent as a reference point, I shall then change the group using different substituents. Phenyl groups are very versitile for investigating electronic effects, as their electron density can easily be varied. We shall consider the cases of an electron donating group (PhOMe) and an electron withdrawing group (PhNO2). An electron donating group should increase electron density in the phenyl ring, and therefore promote donation of the nitrogen lone pair into the empty pz orbital on Si, thus, we would expect it to stabilise the silylene. On the other hand, and electron withdrawing group should reduce electron density in the phenyl ring. This should pull the electron density off the nitrogen, thus limiting the donation of the lone pair into the empty pz orbital. Thus, we would expect electron withdrawing groups to destabilise the silylene.

To look at the stability of the compounds in question, I shall compare the energy of the silylene as calculated and the chlorinated form. I have done it like this, as it follows the real synthetic pathway of the reaction, therefore, the energies calculated will give a better understanding of how the R groups on nitrogen affect the reaction. To calculate the energy change of the reaction, we included all of the reagents in the reaction and the products. The silylenes are synthesised by reacting their chlorinated form with two equivalents potassium, to form potassium chloride (the thermodynamic driving force of the reaction) and the silylene. This approach will also allow us to discount all other species in the overall energetics of the reaction, so we can soley concentrate, and obtain an energy for, the conversion of a tetravalent silicon, to a divalent one with a lone pair and an empty pz orbital. Once the energies of the four species in the reaction, we can calculate the energy change of the reaction. To model the stability of the silylene, we will assume that the more negative the energy change of the reaction, the more stable the silylene.

Optimisation of Structures:
The optimisation of the structures were done in two steps. The first optimisation was run using a DFT calculation, B3LYP type with the 3-21G (d) basis set. Once these calculations had converged, the structures were then sent to second round of optimisation using the same calculation method and type, but with a more accurate basis set. For this optimisation, the basis set used was 6-311G (d) to give a more accurate optimisation of the structures. It was these forms (from the 6-311G (d) optimisation) that the energy was taken from, and the Si-N bond lengths. The nomencalature used to describe the substituted phenyl groups can be explained as follows: The "p-" indicates that the phenyl ring is substituted in the para- position, and the "OMe/NO2" indicates the group that is present in that position. This is the nomencalute that shall be used in the rest of this part of the investigation for these groups.
| Parameter | R = Me | R = tBu | R = Ph | R = Ph(p-OMe) | R = Ph(p-NO2) |
|---|---|---|---|---|---|
 |
 |
 |
 |
 | |
 |
 |
 |
 |
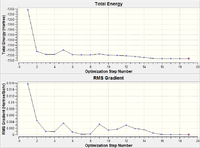 | |
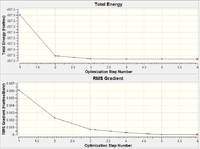
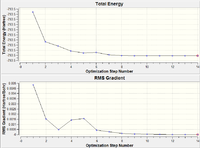
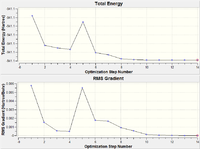
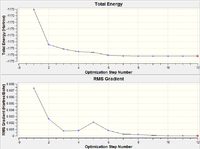
By looking at the progress of the optimisations, we can assume that the optimisation calculations had in fact converged (this was later confirmed using vibrational analysis). The inital attempt at optimisation of the methyl substituted silylene resulted in an optimisation to a transition state, not the ground state we wanted. This was known via the presence of a vibration with a "negative frequency". To ensure that the ground state was found, the transition state geometry of the compound was taken, and a further optimisation was performed (using the same method, calculation type, and basis set). To try and force the calculation towards the ground state, the parameters of the calculation were changed by the addition of the keywords "int=ultrafine" and "scf=conver=9". These further limited the conditions for convergence of the calculation, and as the transition state was closer in structure to the ground state than the inital geometry, we found the required ground state.
On first inspection of the results of the Si-N bond lengths of the structures analysed, you could propose that the methyl substituted silylene is the most stable. This could be true, as the Si-N bond strength could be an indication of stability of the silylene, and as bond length is inversely proportional to bond strength, we could say its the most stable. However, due to the largely different steric nature of the groups, we could also put this change in bond length down to the forcing apart of the 5-membered ring to try and minimise steric interactions. We shall look further at the stability of the silylenes below.
One way in which the bond length data does agree with initial expectations is in the case of the phenyl and substituted phenyl groups. We would expect to see a change in the bond length according to the electronic nature of the phenyl group. In the case of the Ph(p-OMe) group on the silylene, we would observe a larger than usual electron density in the phenyl ring. This would lessen the removal of electron density off the nitrogen, thus allowing better donation of its lone pair to silicon. This would increase the bond order of the Si-N bond, strengthening it, and therefore, resulting in a reduction in the bond length. The opposite is true in the case of the Ph(p-NO2) group on the silylene. The nitro group would remove electron density off the phenyl ring, which would in turn remove electron density off nitrogen. This would lessen the extent to which nitrogen could donate its lone pair to Si, therefore reducing the bond order and bond strength, thus increasing the Si-N bond length.
Using Energetics as a Measure of Stability:
The manner in which the energy was used to observe the stability of the silylenes is decribed as above. Using the full reaction equation, and all the products and reactants, an estimation of ΔE Formation was made for each case (negative ΔE Formation implies a favourable reaction, as products are more stable than reactants). As we can see below, the ΔE Formation for each silylene has been calculated in this fashion. To increase the accuracy of this approach, instead of calculating the energy of KCl in GaussView, it should have been done in Crystal. GaussView as very good for optimising and understanding covalently bound system, but has its downfall with ionic lattices. Therefore, if more time was available, a calculation would have been run on Crystal using the same calculation type, method and basis set to obtain a more accurate energy for KCl. However, we can still use the energy of KCl from GaussView, as we want to look at the relative energies, not the absolute energies.
The data from the energetics of the reaction, and the ΔE Formation of the silylenes gives us very interesting results. Firstly, lets consider the effect of increasing steric bulk. By changing the group bound to the nitrogen from a methyl to a tBu group, we do see a small added thermodynamic stability. This indicates that the formation of the tBu substituted silylene is approximately 2kJmol-1 more favourable than the methyl substituted one. This is quite interesting, although it is a small effect, it is still definately there. This would most probably be due to hyperconjugation as discussed earlier, allowing better σ donation to the nitrgen. However, we would expect the main added stability of having a tBu substituted silylene over a methyl substituted one would be kinetics. The tBu group would act as a steric shield lowering the chance of attack at the silylene functionality. As methyl is very small, you would not see the same steric protection. However, this type of stability cannot be probed using these calculations, instead, we need to look at transition state to observe kinetic effects. This however, is beyond the scope of the course, and therefore, from now onwards in the investigation, I shall concentrate on the phenyl and substituted phenyl based silylenes.
The silylenes used to investigate the electronic effects come out with far more interesting results than those used to look at the effects of sterics. The data from the bond lengths seemed to indicate that the Si-N bond was strongest in the case of the Ph(p-OMe) silylene, and weakest in the case of the Ph(p-NO2) silylene, thus, we made the initial prediction that the more electron donating the substituent, the more stable the silylene. However, the data calculated from the energies of the systems seems to contradict this. As expected, the addition of the electron donating -OMe group has further stabilised the silylene, this is not out of the ordinary. What is bizarre though, is the result for the addition of the -NO2 group. We initiall expected that an electron withdrawing group would destabilised the silylene, as it would restrict electron donation from nitrogen into the empty pz orbital on silicon. However, we observe the complete opposite. Instead of observing a slight destabilisation of the molecule, we actually observe a rather large stabilisiation (ca. 80kJmol-1) with respect to the unsubstitutes phenyl group. This is very interesting, and shall be further investigated.
Molecular Orbital Analysis:
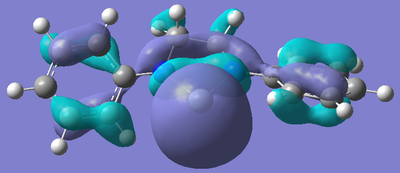
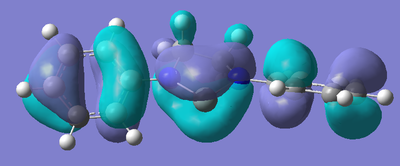
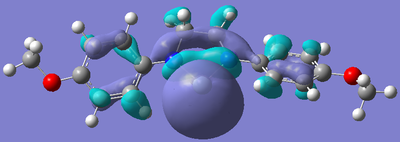
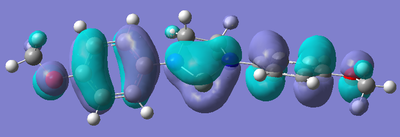
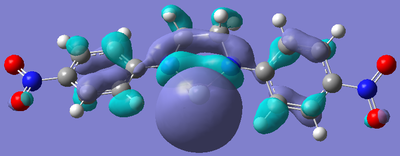
After the bizarre results seen in the energy calculations of the silylenes, naturally, the next step was to look at the molecular orbitals of the structures, in particular, the empty pz orbital on the silicon, and the lone pair on silicon, as we would expect most of the characteristics of the compound to originate from the electronic nature of these orbitals. The form of these orbitals as calculated by Gaussian are displayed with their relative energy to the 1s orbital on hydrogen.
| R Group | Mo containing Si lone pair | Energy of Mo | Mo containing N lone pair -> Si empty Pz | Energy of Mo |
|---|---|---|---|---|
 |
 |
|||
 |
 |
|||
 |
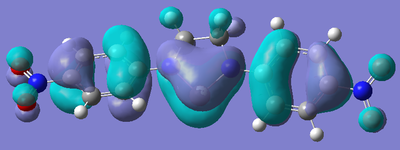 |
Again, the results from looking at the molecular orbitals gives us interesting results. The first obvious thing to notice just by looking at the orbitals, is that they are all antibonding. That means that both the lone pair on silicon, and the donation of the nitrogen lone pairs into the empty pz occur in anitbonding orbitals. We shall come back to this later. Looking at the energies again, we see an interesting trend. The electron donating group (Ph(p-OMe)) seems to increase the energy of the lone pair on Si and the empty pz orbital with respect to the phenyl group. This does not seem to explain why the Si-N bond length is shorter in the Ph(p-OMe) system than the Ph system, or why the Ph(p-OMe) substituted silylene is more stable than the Ph substituted one. This does go some way into explaining the stability of the Ph(p-NO2) substituted silylene. The frontier orbitals for this silylene are much lower in energy than those for the other phenyl based ones, therefore, we would expect the total energy of the molecule to be lower.
The bonding nature of the orbitals can also be used to describe some of the values observes. As discussed above, in all three cases, both the empty pz orbital on Si and the Si lone pair are in antibonding molecular orbitals. We can now describe to a degree why the Ph(p-NO2) substituted silylene is more stable than the Ph(p-OMe) silylene. In the case of the electron donating group, we are effectively donating electrons from low energy bonding/non-bonding orbitals into high energy anti-bonding orbitals. This will decrease the bond order and thus destabilise the system to a certain degree. Now, if we consider the case of the electron withdrawing group, we observe the opposite effect. In this case, we are lowering the occupancy of the higher energy anti-bonding orbital, and pulling electrons towards the lower energy bonding/non-bonding orbitals, therefore increasing the total bond order, thus increasing the stability of the silylene. By consider these two ideas, we can understand to a certain level why the electron withdrawing group results in a more stable silylene than using an electron donating group.
NBO Analysis:
The analysis of the molecular orbitals of the structure tells us about the relative energies of the empty pz orbital and lone pair on Si, and the bonding characteristics of the orbitals. However, we can look at the same problem from a different approach, and look at the electronic occupation of each of the orbitals using NBO (natural bond order) analysis. By looking through the output files of the nbo calculation (calculating energy with full nbo set and pop=full), we can look at these occupancy. In particular, we shall look at the pz orbital on nitrogen to look at the occupation of its lone pair, and the 3p orbitals on silicon, to observe the occupation of its lone pair and empty pz orbital. These results are shown below. Charge density maps were also generated (showing Muliken Charges) so we can understand where charge is localised in each of the silylene systems.
Firstly, we shall look at the occupation of the nitrogen lone pair, which looking at the cartesian axes defined by GaussView, is the 2px orbital. By comparing the occupancy of the nitrogen orbitals of the phenyl substituted and Ph(p-OMe) substituted silylene, we observe very little difference between the two. However, the occupancy of the nitrogen lone pair of the Ph(p-NO2) substituted silylene is significantly lower than that of the other two (by ca. 0.25). To observe whether or not there is any correlation between the occupancy of the nitrogen lone pair, and its degree of donation, we need to now look at the occupancy of the empty pz on Si.
We can see that the occupancy of this orbital in the case of the Ph(p-OMe) substituted silylene is the highest, and the case of the Ph(p-NO2) substituted silylene is the lowest. This seems to tell us that the introduction of electron donating and electron withdrawing groups does not significantly affect the nitrogen, whereas, these electron effects change the electronic distribution of silicon instead. To look at the occupancy of the silicon based lone pair, we need to look at the 3py orbital (again chosen via the cartesian coordinates defined by GaussView). The occupancy of this orbital follows what we would have expected from the electronic nature of the substituents on the silylene. The Ph(p-OMe) substituted silylene has the highest occupancy of the lone pair, and the Ph(p-NO2) substituted silylene has the lowest. The occupancy of the 3px hardly changes across the range of substituents used, therefore we can ignore this orbital, as it gives us not further understanding of the systems.
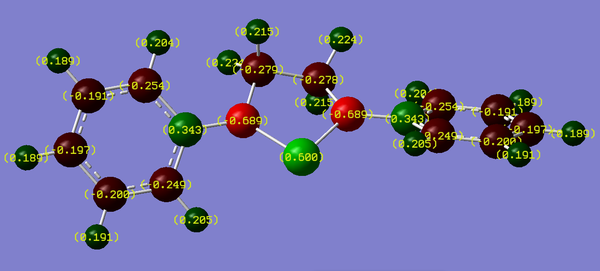
If we look at the charge density maps, we can see the total effect of the electronic nature of the substituents on the silylene and the adjacent nitrogens. We can see that the electron donating group (Ph(p-OMe)) increases the total electron density on the silicon atom, but does not significantly change the density on the nitrogens. However, in the case of the electron withdrawing group (Ph(p-NO2)) we significantly reduce the electron density on silicon, but at the same time, it increases the density on nitrogen. This seems to indicate that the introduction of these electron withdrawing group not only firstly removes density off of the silicon, but it also prevents the donation of electrons from the nitrogen to the silicon, which explains why the charge is more negative on the nitrogen and more positive on the silicon in the case of the Ph(p-NO2) substituted silylene over the other two groups investigated.
By looking at the orbital occupancy from the NBO data and the charge density maps, we can come to the following conclusions...
- The stability of the silylene is determined by the occupancy of the lone pair on silicon and the empty pz orbital on silicon.
- Having a higher occupancy of the empty pz orbital increases the stability of the silylene. A lower occupancy therefore decreases the stability.
- Having a lower occupancy of the lone pair on silicon increases the stability of the silylene. A higher occupancy therefore decreases the stability.
- Electron donating groups (e.g. Ph(p-OME)) increase the occupancy of the empty pz orbital, but also increase the occupancy of the lone pair.
- Electron withdrawing groups (e.g. Ph(p-NO2)) decrease the occupancy of the empty pz orbital, but also decrease the occupancy of the lone pair.
- As the energetics seems to tell us that the Ph(p-NO2) substituted silylene is more stable than the Ph(p-OME) substituted one, we can say (using the arguments about stability and orbital occupancy above) that the stability of the silylene is dictated more by the occupancy of the lone pair on silicon (where a lower occupancy is favourable) than the occupancy of the empty pz orbital (where a higher occupancy is favourable).
Vibrational Analysis:
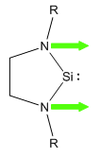
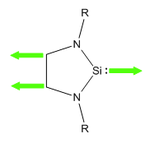
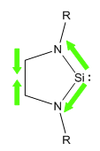
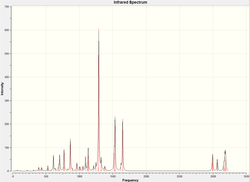
Now we have a better understanding of the bonding picture of the silylenes and their stability, we are in a better position to predict the outcome and explain the results of the vibrations generated via the calculations. We will look at 7 key vibrations centred around the 5-membered ring containing the silylene. The vibrations are shown below (in a general schematic form) with the wavenumbers of the vibrations and the IR spectrum of each compound.
From my initial preconceptions about the stability of silylenes, and what causes their stability. The results from the vibrational calculations would not seem to make any sense. However, now we have seen the bonding situation in the silylenes, and how the donation and withdrawal of electrons effects the silylene's structure and stability, these results make more sense. As discussed above, the electron donating Ph(p-OMe) group removes electrons from low-lying bonding orbitals, and pushes them towards the anti-bonding orbitals of the ring system, thus destabilising the compound. We can see the manifestation of this in the vibrational results.
In the case of the Ph(p-OMe) substituted silylene, we see that any vibration that increases the Si-N bond length is seen at a higher energy than in the case of the Ph substituted one. This is because increasing the bond length would decrease the anti-bonding character of the bond, therefore stabilising and strengthening the bond. These vibrations that increase the Si-N bond length have the opposite effect on the Ph(p-NO2) substituted silylene. In this case, we are removing electrons from anti-bonding orbitals and lowering their energy. So, any vibration preventing this from occurring will increase the anti-bonding nature of the bond, thus destabilising and weakening the bond.
If we look at the vibrations that decrease the Si-N bond length, we observe the opposite effect. In the case of the electron withdrawing Ph(p-NO2) group, we stabilise the Si-N bond, so decreasing the bond length will further stabilise the bond, resulting in the vibration occurring at a higher frequency (and therefore energy) than in the case of the Ph substituent. When the electron donating group is used (Ph(p-OMe)), we destabilise the bond, so decreasing the bond length will further destabilise the bond, and therefore weaken it. Therefore, the vibration will occur at lower frequency (and therefore energy). If we look at the vibrations that result in no net change in the bonding or anti-bonding characteristics of the Si-N bond, we observe very little change in the vibrational frequency across the range of electronic environments used in the species.
Conclusion:
By combining the results we have observed in the molecular orbital calculations, the NBO analysis and the vibrational analysis, we can finally understand the observed stability of the substituted silylenes. The analysis of the molecular orbitals of the silylenes, and the orbitals in which we observe the donation of the lone pairs on nitrogen into the empty pz orbital on silicon, and the lone pair on silicon gives us the first level of understanding as to why the order of stability of the silylenes is Ph < Ph(p-OMe) < Ph(p-NO2). We have seen why using electron donating groups to increase the electron density is putting electron density into anti-bonding orbitals and therefore destabilising the system, and how using electron withdrawing groups pulls electrons out of these anti-bonding orbtials, and stabilising the system. This by itself does not fully explain the observed order of stability of the silylenes.
The next level of understanding came from the NBO calculations and the charge density maps. In this part of the analysis, we saw how the electronic nature of the substituents effected the orbital occupancy of the key orbitals of the structures (the empty pz and the lone pair). We saw how the electron donating group (Ph(p-OMe)) allowed a higher occupation of the empty pz orbital, but it also increases the occupancy of the lone pair. So, in one respect, we are stabilising the system by increasing the Si-N bond strength, but we are also destabilising it by increasing the occupancy of the unstable lone pair. The opposite is true of the electron withdrawing group (Ph(p-NO2)). We observed reduction of the occupancy of the empty pz indicating a reduction in electron donation, but also a reduction of the occupancy of the lone pair. So once again, we see a simultaneous destabilisation of the molecule via a removal of electrons from the Si-N bond and therefore destabilisation of the molecule, but we also see a stabilisation via a removal of electrons from the unstable silicon lone pair, therefore stabilising the system.
The charge density maps of the molecules show these effects very well. In the case of the the Ph(p-OMe) substituted silylene, we observe the lowest Mulliken Charge on the silicon and largest (least negative) on nitrogen. This minimises the polarisation of the Si-N bond therefore increasing the bond strength (hence the small bond length observed in the calculation). In the case of the Ph(p-NO2) substituted silylene we observe the opposite effect. The electron withdrawing nature of the substituent on nitrogen prevents electron donation to silicon, whilst also removing electron density from the Si. This results in a large polarisation of the Si-N bond therefore reducing the bond strength which explains the observed large bond length. These have been justified by the correct prediction of the IR spectra using these primarily as assumptions. Once we assumed these were true, I made an initial prediction as to what the resulting shifts in the energies of the vibrations should be, and these seemed to hold true. Therefore, we can say that what has been stated holds true.
By looking at the combined results of these two pieces of analysis and comparing it to the energy of formation of each silylene, we came to an overall conclusion as to what controls the stability of N-heterocyclic silylenes. It seems that the unstable nature of the silicon lone pair, and trying to minimise the occupation of this orbital seems to give a greater stability than trying to occupy the empty pz orbital. It seems that you cannot affect one whilst not changing the other (i.e. increasing the occupation of the empty p orbital increases occupation of the lone pair, and decreasing occupancy of the lone pair decreases occupancy of the p orbital) we can come to the conclusion that electron withdrawing groups stabilise N-heterocyclic silylenes more than electron donating groups.
Links to Calculations:
| Calculation | Reference | DOI |
|---|---|---|
| R=Me Silylene Frequency and Optimisation Calculation (attempt 1) | http://hdl.handle.net/10042/to-6871 | DOI:10042/to-6871 |
| R=Me Dichlorinated Silylene Frequency and Optimisation Calculation | http://hdl.handle.net/10042/to-6872 | DOI:10042/to-6872 |
| R=tBu Silylene Frequency and Optimisation Calculation | http://hdl.handle.net/10042/to-6873 | DOI:10042/to-6873 |
| R=tBu Dichlorinated Silylene Frequency and Optimisation Calculation | http://hdl.handle.net/10042/to-6874 | DOI:10042/to-6874 |
| R=Ph(p-OMe) Silylene Frequency and Optimisation Calculation | http://hdl.handle.net/10042/to-6875 | DOI:10042/to-6875 |
| R=Ph(p-OMe) Dichlorinated Silylene Frequency and Optimisation Calculation | http://hdl.handle.net/10042/to-6876 | DOI:10042/to-6876 |
| R=Ph Silylene Frequency and Optimisation Calculation | http://hdl.handle.net/10042/to-6877 | DOI:10042/to-6877 |
| R=Ph Dichlorinated Silylene Frequency and Optimisation Calculation | http://hdl.handle.net/10042/to-6878 | DOI:10042/to-6878 |
| R=Ph(p-NO2) Silylene Frequency and Optimisation Calculation | http://hdl.handle.net/10042/to-6880 | DOI:10042/to-6880 |
| R=Ph(p-NO2) Dichlorinated Silylene Frequency and Optimisation Calculation | http://hdl.handle.net/10042/to-6881 | DOI:10042/to-6881 |
| R=Ph Silylene NBO Analysis Calculation | http://hdl.handle.net/10042/to-6882 | DOI:10042/to-6882 |
| R=Ph(p-OMe) Silylene NBO Analysis Calculation | http://hdl.handle.net/10042/to-6883 | DOI:10042/to-6883 |
| R=Ph(p-NO2) Silylene NBO Analysis Calculation | http://hdl.handle.net/10042/to-6884 | DOI:10042/to-6884 |
References:
- ↑ J.Blixt, J.Glaser, J.Mink, I.Perrson, P.Perrson and M. Sandstrom, J. Am. Chem. Soc., 1995, 117, pp 5089-5104:DOI:10.1021/ja00123a011
- ↑ Glossary of Terms used in Physical Organic Chemistry (IUPAC Recommendations 1994), PAC, 1994, 66, pg 1077:DOI:10.1351/pac199466051007
- ↑ R.Anderson, E.Campi, W.Jackson, Catalysis Letters, 1991, 9 (1-2), pp 55-58:DOI:10.1007/BF00769081
- ↑ D.J.Darensbourg, R.L.Kemp, Inorg. Chem., 1978, 17, pg 2680:DOI:10.1021/ic50187a062
- ↑ W.Hieber, J.Peterhans, Z. Naturforsch., 1959, 14b, pg 462
- ↑ Arduengo et al, J. Am. Chem. Soc., 1991, 113, pp 361-3:DOI:10.1021/ja00001a054
- ↑ West et al, J. Am. Chem. Soc., 1994, 116, pp 2691:DOI:10.1021/ja00085a088

