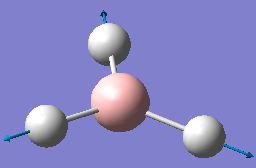
Rep:Mod:rt70
Module 2a: Bonding
Ab initio and density functional molecular orbital
Introduction
The aim of this module is to draw and run calculations on a range of inorganic molecules. Computational chemistry allows us to predict the structure and bonding of molecules without actually making them. The IR and RAMAN and NMR spectra of molecules can be studied, as well as the electron density and dipole moments. Practically, molecules which are unstable or dangerous can be studied more easily; or the transition state/s of a reaction can be modelled.
BH3 - optimisation
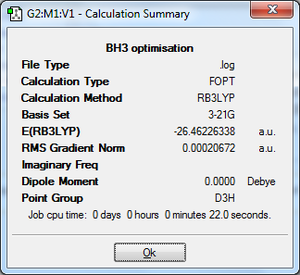
A BH3 molecule was drawn into Gaussview. The bond lengths were changed from 1.18Å to 1.50Å by keeping the B atom fixed and the molecule was optimised in order to find out the minimum energy and electron density. This is done by solving the Schrodinger equation; the position of the nuclei resolved by finding out which geometry has the lowest energy. The method used was: B3LYP, basis set: 3-21G, type of calculation: OPT. This basis set has a drawback in that its accuracy is low, however for this reason the calculation is quick to run. The results were analysed via the .out file[1]. The summary of these results, shown on the left gives us information about the calculation type, basis set, final energy in au, etc. The gradient is <0.001, i.e. it is close to 0, indicating that the molecule has been optimised and that optimisation is complete. The final bond length for the B-H atom was found to be 1.19Å, which is very close to the original bondlength drawn by Gaussview. As expected, the bond angles were 120o because it is a triganol planar molecule.
The "real" output was then opened at to see whether the job had converged, more specifically the final displacements and forces were looked at:
        Item               Value     Threshold  Converged?
Maximum Force            0.000413     0.000450     YES
RMS     Force            0.000271     0.000300     YES
Maximum Displacement     0.001610     0.001800     YES
RMS     Displacement     0.001054     0.001200     YES
Predicted change in Energy=-1.071764D-06
Optimization completed.
   -- Stationary point found.
                          ----------------------------
                          !   Optimized Parameters   !
                          ! (Angstroms and Degrees)  !
--------------------------                            --------------------------
! Name  Definition              Value          Derivative Info.                !
--------------------------------------------------------------------------------
! R1    R(1,2)                  1.1935         -DE/DX =    0.0004              !
! R2    R(1,3)                  1.1935         -DE/DX =    0.0004              !
! R3    R(1,4)                  1.1935         -DE/DX =    0.0004              !
! A1    A(2,1,3)              120.0            -DE/DX =    0.0                 !
! A2    A(2,1,4)              120.0            -DE/DX =    0.0                 !
! A3    A(3,1,4)              120.0            -DE/DX =    0.0                 !
! D1    D(2,1,4,3)            180.0            -DE/DX =    0.0                 !
--------------------------------------------------------------------------------
As we can see, the force, which is the gradient of a plot of energy against distance, shows that the forces have converged. The data indicates that the placements have converged too, therefore within reasonable boundaries, if the displacement is small the energy does not alter.
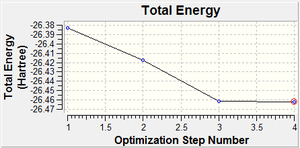

Graphical representations of the optimisation was then viewed - one displayed how the energy of the molecule changed during the optimisation, the other gave information about how the gradient changed. The energy shows a linear drop until the 3rd step where it levels off, indicating that the molecule becomes more stable during the optimisation process; during this process the programme is finding the structure which is at minimum energy. The gradient also shows a decrease, however it is not linear, decreasing slowly to begin with then somewhat more sharply until it reaches zero. An animation of the optimisation shows that the first two structures do not have bonds; this could be because it regards the interaction as ionic as the atoms are too far away from each other; as they get closer the covalent nature, and thus likelihood of a bond increases. A bond is the attraction between atoms or molecules that results in a compound. It is the results of electromagnetic forces between opposite charges.
TlBr3 - optimisation

This molecule is an example where larger pseudo-potentials and basis sets are required for the calculation. All of the atoms involved have a large number of electrons, therefore the calculation cannot be solved using the "standard" Schrodinger equation. The main assumption is that valence electrons influence the interactions, so the core electrons can be modelled with a pseudo-potential. The basis set also needs to be larger; but overcomplicating it would extend the length of time required to carry out the calculations so a compromise has to be reached. Some of the advantages of investigating such large systems it that Tl is highly toxic, therefore its properties can be investigated without handling it.
A molecule of TlBr3 was drawn in Gaussview; the symmetry was then assigned by changing the point group to D3h and the tolerance to very tight (0.0001), to prevent later problems with the MOs and vibrations. A gaussian calculation was then run, as before with BH3 - job type: optimisation, method: DFT, B3LYP, basis set: LanL2DZ. This basis set is a "medium level" set, better ones are not used because of the amount of time it takes to run them. The .log file[2] was then opened to analyse the results. The Tl-Br bond distance was found to be 2.65Å, which is similar to the literature value of 2.52Å[3]; the difference highlights the simplifications made in this model. The Br-Tl-Br bond angle was found to be 120o, which is expected as the molecule is triganol planar in structure. The summary file for this molecule is shown to the left, again the gradient is very close to 0 so the optimisation is complete.
BH3 - energy

In this section the electronic structure was solved in order to get computed MOs. For this part, the .chk file from the optimisation of the molecule was used. The method was changed to: energy, additional keywords: pop=full, NBO: full NBO. This was run via the SCAN and not on the laptop[4]. The MOs were then visualised, starting with the occupied orbitals under the visualise tab. The orbitals were then compared to LCAOs from an MO diagram[5]. We can see that the unoccupied orbitals are more diffuse than the occupied MOs. The LCAOs and real/computed MOs are very similar, suggesting that MO theory is very useful and accurate in predicting what MOs look like.
A natural bonding orbital analysis, or NBO was then carried out using the .log file. The charge distribution in the molecule was examined; atoms in bright red had a high negative charge - the H atoms, whereas the atoms in bright green - the B atom, had a high positive charge because they are electron/Lewis deficient. The NBO charge for the B: 0.096, whereas each of the Hs were: -0.032. The file was looked at to provide more detail about the NBO analysis:
Summary of Natural Population Analysis:

                                      Natural Population
               Natural  -----------------------------------------------
   Atom  No    Charge         Core      Valence    Rydberg      Total
-----------------------------------------------------------------------
     B    1    0.27816      1.99954     2.72230    0.00000     4.72184
     H    2   -0.09272      0.00000     1.09256    0.00015     1.09272
     H    3   -0.09272      0.00000     1.09256    0.00015     1.09272
     H    4   -0.09272      0.00000     1.09256    0.00015     1.09272
=======================================================================
  * Total *    0.00000      1.99954     6.00000    0.00046     8.00000
  (Occupancy)   Bond orbital/ Coefficients/ Hybrids
---------------------------------------------------------------------------------
    1. (1.99854) BD ( 1) B   1 - H   2
               ( 45.36%)   0.6735* B   1 s( 33.33%)p 2.00( 66.67%)
                                           0.0000  0.5774  0.0000  0.0000  0.0000
                                           0.8165  0.0000  0.0000  0.0000
               ( 54.64%)   0.7392* H   2 s(100.00%)
                                           1.0000  0.0001
    2. (1.99854) BD ( 1) B   1 - H   3
               ( 45.36%)   0.6735* B   1 s( 33.33%)p 2.00( 66.67%)
                                           0.0000  0.5774  0.0000  0.7071  0.0000
                                          -0.4082  0.0000  0.0000  0.0000
               ( 54.64%)   0.7392* H   3 s(100.00%)
                                           1.0000  0.0001
    3. (1.99854) BD ( 1) B   1 - H   4
               ( 45.36%)   0.6735* B   1 s( 33.33%)p 2.00( 66.67%)
                                           0.0000  0.5774  0.0000 -0.7071  0.0000
                                          -0.4082  0.0000  0.0000  0.0000
               ( 54.64%)   0.7392* H   4 s(100.00%)
                                           1.0000  0.0001
    4. (1.99954) CR ( 1) B   1           s(100.00%)
                                           1.0000  0.0000  0.0000  0.0000  0.0000
                                           0.0000  0.0000  0.0000  0.0000
    5. (0.00000) LP*( 1) B   1           s(100.00%)
This analysis looks at the electron density of the molecule and divides it into orbitals that are used to get information about the bonding in the molecule. The first bond shows that 54.64% of the bond comes from the H atom; the remaining 45.36% comes from B. The hybridisation of these orbitals are 100% s-character for the H and 33% s-character, 66% p-character for the B. Orbital 5 is the lone pair on the B atom.
The final section is headed "Natural Bond Orbital (Summary)", in this section are recorded the energy and population or occupation of the B-H bonds, and the boron lone pair (B(LP*)):
The interactions, more specifically mixing between MOs, was then examined - this is usually between bonding and non-bonding NBOs. Since none of the values in E(2) are >20kcalmol-1, they are not of particular interest. Finally the natural bond orbitals, which look at the occupation and energy of B-H bonds, has also been given. From this we can see the B lone pair.
Second Order Perturbation Theory Analysis of Fock Matrix in NBO Basis
    Threshold for printing:   0.50 kcal/mol
                                                                             E(2)  E(j)-E(i) F(i,j)
        Donor NBO (i)                     Acceptor NBO (j)                 kcal/mol   a.u.    a.u.
===================================================================================================
within unit  1
  4. CR (   1) B   1                / 10. RY*(   1) H   2                    0.70    7.42    0.064
  4. CR (   1) B   1                / 11. RY*(   1) H   3                    0.70    7.42    0.064
  4. CR (   1) B   1                / 12. RY*(   1) H   4                    0.70    7.42    0.064
Natural Bond Orbitals (Summary):
                                                           Principal Delocalizations
          NBO                        Occupancy    Energy   (geminal,vicinal,remote)
====================================================================================
Molecular unit  1  (H3B)
    1. BD (   1) B   1 - H   2          1.99854    -0.43328
    2. BD (   1) B   1 - H   3          1.99854    -0.43328
    3. BD (   1) B   1 - H   4          1.99854    -0.43328
    4. CR (   1) B   1                  1.99954    -6.68393  10(v),11(v),12(v)
    5. LP*(   1) B   1                  0.00000     0.53915
BH3 - frequency
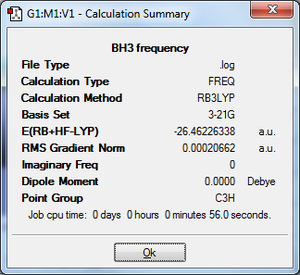
A frequency analysis was carried out to see whether the optimisation has been successful, and to see whether there is a minimum or transition state in the potential energy surface. The IR and Raman modes can also be obtained from this, which we can use to compare with experimental data. On the fully optimised structure - job type: frequency, additional key words: pop=(full,nbo). The same method and basis set have been used to keep the accuracy/errors consistent in the calculation and so that the same structure was analysed both times. In the .out file the summary was pulled up, shown left. It shows that the energy matches the one from the optimisation, therefore the structures are the same. The frequencies were then examined in the output file. The low frequencies are roughly one order of magnitude smaller than the first vibration, therefore it is considerably smaller. Since every molecule has 3N-6 vibrational frequencies, this is what was expected. Ideally the frequencies would be closer to 0, but that would require using a better method which is more time consuming.
Low frequencies ---  -66.7625  -66.3592  -66.3589   -0.0019    0.0032    0.2123
Low frequencies --- 1144.1483 1203.6413 1203.6424
Diagonal vibrational polarizability:
       0.6013547       0.6012848       1.9090953
Harmonic frequencies (cm**-1), IR intensities (KM/Mole), Raman scattering
activities (A**4/AMU), depolarization ratios for plane and unpolarized
incident light, reduced masses (AMU), force constants (mDyne/A),
and normal coordinates:
                    1                      2                      3
                   A"                     E'                     E'
Frequencies --  1144.1483              1203.6413              1203.6424
Red. masses --     1.2531                 1.1085                 1.1085
Frc consts  --     0.9665                 0.9462                 0.9462
IR Inten    --    92.8665                12.3148                12.3173
Atom AN      X      Y      Z        X      Y      Z        X      Y      Z
  1   5     0.00   0.00   0.16     0.00   0.10   0.00    -0.10   0.00   0.00
  2   1     0.00   0.00  -0.57     0.00   0.08   0.00     0.81   0.00   0.00
  3   1     0.00   0.00  -0.57    -0.38  -0.59   0.00     0.14   0.38   0.00
  4   1     0.00   0.00  -0.57     0.38  -0.59   0.00     0.14  -0.38   0.00
Next, each of the vibrations aas animated. None of the vibrations were negative, therefore the molecule was fully optimised. The IR column tells us the intensity of the vibrations; the data has been tabulated below.

The IR spectrum shown on the left does not have 6 peaks because there are 2 doubly degenerate frequencies. It can also be seen that the molecule either has fairly low or high vibrations, but nothing inbetween.
Mo(CO)4(PCl3)2 - optimisation
To begin with the ground state structures of Mo(CO)4(PCl3)2, trans- and cis- isomers, were optimised. The method used was: DFT, B3LYP, basis set: LANL2MB, additional keywords: opt=loose. A low level basis set and pseudo-potential were used because a rough idea on the geometry was sought after. The files were sent off to SCAN; when they was returned the P-Cl bonds were not present. This is because Gaussview has a list of bond distances mainly for organic compounds. Since inorganic compounds are normally longer than organic ones, the bonds were outside of the range Gaussview recognises so it did not insert them.
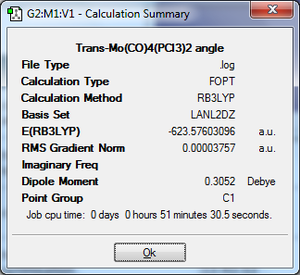
Trans-isomer: The summary file showed that the gradient is 0 and the energy is fairly reasonable, so we can assume that optimisation has been completed. Although this optimisation provides reasonable angles and bond lengths, it is still a low level approximation and is therefore a guideline. Dihedral angles are not optimised as well, so the PCl3 groups had to be re-orientated. Based on a reaction profile[6], both PCl3 groups were eclipsed and one Cl from each P was orientated parallel to the same Mo-C=O bond. Four atoms were selected and the torsion set to achieve this.
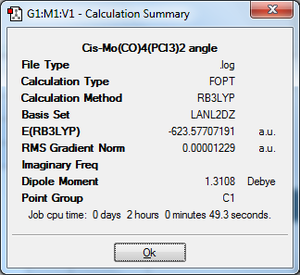
Cis-isomer: The summary file again had a gradient of 0 and the energy is roughly similar to the previous example. We can again assume that the optimisation is complete. The dihedral angles were again modified, this time so that on one P group a Cl pointed upwards parallel to the axial bond, whilst on the other P group a Cl pointed downwards. The whole group was rotated during this process.
Both optimisations were then re-run with the altered geometries - the only things changed were the basis set: LANL2DZ and additional keywords: int=ultrafine scf=conver=9. A medium level basis set was thus used along with an increase in the electronic convergence through the additional keywords to implement a more accurate model.
Trans-isomer: On the left, the summary file shows a gradient of 0 for the final optimisation. The results were analysed by downloading the .out file from scan.[7]. The Mo-P bond distance for the computed structure is 2.44Å. Literature for this exact compound could not be found, however data for a relative for a relatively similar compound, trans-Mo(CO)4(PPhMe2)(PPh3) has been. The Mo-P bond distance is 2.46Å[8]. This is however expected because the groups on the literature compound are sterically bulkier, causing repulsion and thus an increase in bond length in the molecule.
Cis-isomer: On the right, the summary file again shows a gradient of 0 for the final optimisation. The results were analysed in the same way.[9]. For the cis-isomer, the Mo-P bond distance for the computed structure is 2.51Å, whereas the P-Mo-P bond angle is 94.2o. This is slightly shorter than the literature found for another similar compound, cis-Mo(CO)4PMe3. The Mo-P bond distance is 2.52Å, whereas the P-Mo-P bond angle is 97.5o[10]. The angle is slightly larger than 90o because the PCl3 group is sterically larger than the C=O group, therefore repulsive forces push the two P groups away more than they push a PCl3 and C=O group. Again the experimental and computational results are in extremely good agreement. The 'Me' substituent was chosen because other ones described in the literature are sterically bulky. The trans-isomer has a shorter Mo-P bond length than the cis-isomer because the steric clash between the Cl atoms in the cis-isomer pushes the groups, thus increasing the bond length.
Mo(CO)4(PCl3)2 - frequency
The optimised structures were then taken to run frequency calculations; the same method and basis set was used. The .fchk files were downloaded to check that all the frequencies were positive, which they were. The optimisation therefore did not need to be repeated. Trans-isomer[11]; cis-isomer[12]

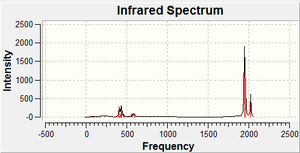
Relative energy: The trans-isomer has an energy of -623.576a.u., whereas the cis-isomer has an energy of -623.577a.u. The energy difference between these two isomers is 2.17kJmol-1, making the cis-isomer marginally more stable than the trans-isomer. Despite the steric clash between the 2 bulky PCl3 groups in the cis-isomer, which would be expected to raise the energy, there is electronic stabilisation in this molecule which actually reduces it. However since these factors are competing, the resultant energy difference is very small. It would be expected that in the ligand L=PR3 making the R groups more bulky, i.e. going from Cl to PPh3 would make the molecule favour the trans-conformation more over the cis- because of the increased steric clash between the bulky PPh3 groups. However according to the literature[13] the cis-isomer is much more stable - the energy difference between the 2 isomers is 72.98kJmol-1. Again electronic stabilisation predominates, suggesting that a smaller R group might make the trans-isomer more stable.
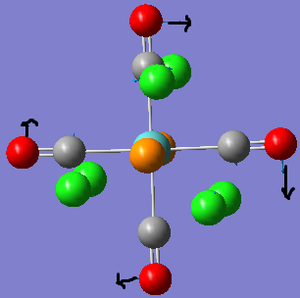
IR spectra - trans: The IR spectrum, shown left was then analysed in more detail. Vibrations with a very low frequency have been animated and tabulated below; there were no vibrations in the spectrum that had a negative frequency. At room temperature, there is a lot of excitation into these vibrational bands because they are low in energy, thus the system has enough energy to allow significant promotion into these bands. The vibrations are in the range expected - the main peak at 2031cm-1 is the mononuclear carbonyl stretch, caused by CO oscillations is expected between 2100 to 1,750 cm−1. According to group theory there should only be 1 carbonyl absorption band for the trans-isomer[14], which is seen in this computed spectrum. The results are therefore in good agreement with group theory in this case, making it a good predictor.
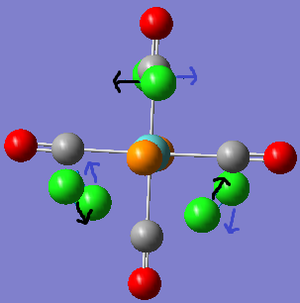
IR spectra - cis: The IR spectrum, shown left was also analysed in more detail by animating and tabulating very low vibrations; again none had a negative frequency. The vibrations are again in the range expected - the main peaks at 2023, 1958, 1949 and 1945cm-1 are the mononuclear carbonyl stretches. According to group theory there should be 4 absorption bands for the cis-isomer. Although in the spectrum only 2 peaks can be seen, there are actually 4 as seen from the vibrations, 3 are simply very close to each other. The results are again in good agreement with group theory. When compared the cis-isomer has 3 extra bands compared to the trans-isomer, and the very lowest frequencies are higher for the cis-isomer than for the trans. Whilst one of these low vibrations is similar, the other is not - in the cis-isomer the C=O, Mo, etc do not move at all, whereas in the trans-isomer there is one vibration where all of these do.
Module 2b: Mini-project
Introduction
The first part of this project investigated the effects of removing a F atom from PF5 to make PF4+. Since more than one resultant structure can be drawn from this, the second part looks at whether these structures are the same, or whether the removal of an axial or equatorial F have the same effect (the isomers have been labelled [A] and [B]). Based on the results obtained in this part, the project was further extended to look at the effects of removing a second F atom to make PF32+.

Optimisation

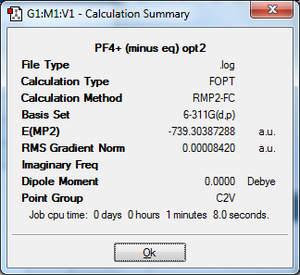
To begin with PF5 and the PF4 isomers were optimised. The method used was: DFT, B3LYP, basis set: 3-21G. A low level basis set was initially used to get an idea rough idea of the geometry. The files were again sent off to scan; this time when they were returned the P-F bonds were present because in all 3 molecules, as they are shorter than the P-Cl bonds analysed in the previous exercise. Gaussivew is therefore able to compute them since the bond distance is not outside the range it recognises. Although this optimisation provides us with reasonable data for the bond angles and lengths, this can be improved on by using a better basis set (there are too few atoms and bonds in this molecule to calculate dihedral angles). The calculations were re-run for using a more accurate method and basis set for purposes - method: MP2, basis set: 6-311G(d,p). In both sets of optimisation, the positive charge had to be accounted for in 2 out of the 3 molecules. This was done by placing the number '1' in the charge box under method.

PF5[15]: The summary for the first optimisation shows that the optimisation process is complete because the gradient is 0 and the energy is fairly reasonable. The second optimisation has a gradient that is marginally closer to 0 compared to the first, therefore that the optimisation is even better. It also suggests that the energy of the structure is lower than what was previously obtained. The summary file for final optimisation is shown left.
The Mo-P bond distance for the computer structure is 1.59Å (axial) and 1.56Å (equatorial). The literature values for this compound are 1.58Å (axial) and 1.53Å (equatorial)[16]. The fact that there are 2 different bond lengths shows that the 3 axial fluorines are in a different environment to the 2 equatorial fluorines - both sources have values which suggest this. The fluorines interchange via the Berry pseudorotation mechanism, which will be explored further when looking at the PF4+ isomers. The literature and computed values are fairly similar, however the value for the axial bond length is slightly more accurate than the equatorial. As the value is lower than what is expected, this is not a problem (i.e. the values are not ambiguous). The F-P-F bond angles are 90o (axial) and 120o (equatorial). Again this matches up to the literature and what would be expected from a trigonal bipyramidal compound.
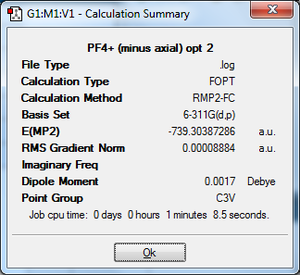
PF4[A][17]: Both summary files again have reasonable gradients and sensible energies, as above. The P-F bond distances for this compound are 1.50Å (both axial and equatorial, whereas the F-P-F bond angles are 109o (both axial and equatorial). The bond distances have not only decreased, but they have all become the same length. This is reflected in the molecule's geometry, as it has now adopted a tetrahedral geometry. The bond angles have also become identical, which backs up the idea that the structure has changed. This is because the positive charge is regarded as being delocalised across the molecule (more specifically on the P), not bound to a specific location on the P as believed in the diagrams drawn above. As there are only 4 bonds left to the P atom they are all in equivalent environments, therefore they have the same lengths and bond angles. Coming back to the first point, the decrease in bond length can be explained in two ways. Firstly, there is a reduction in steric clash between the very electronegative fluorine atoms - they are now further away from each other as the bond angle has increased. Secondly, the P is now more positively charged than before, thus attracting the negative F atoms closer to it; this factor is more influential than the former one.
PF4[B][18]: The same data was found here, therefore we can regard the structure of PF4+ as a hybrid of all the delocalised forms, not a specific one.
PF32+[19]: The summary file on the right shows optimisation is complete. The P-F bond distance has further decreased to 1.46Å (both axial and equatorial), whereas the F-P-F bond angles are 120o (both axial and equatorial). Again the bond angles and lengths have become the same; the molecule has now adopted a triganol planar structure. The positive charge is again delocalised over the molecule and the P atoms are in equivalent atoms. There is a reduction in the bond length for the same reason described above. Thus, going from PF5 to PF32+ we can see a trend in the structures of the molecule.
Before it emerged that the isomers for PF4+ were the same, their relative energies were going to be compared. The energies of the 3 molecules cannot be compared because they do not have the same number of atoms (despite the fact they have the same type of atoms). The computed point group of PF5 is D3h, PF4+ C3v and PF32+ Cs. It was predicted that PF5 would be D3h (confirmed by the literature[20]), therefore the computational calculations are correct here. However, for the tetrahedral PF4+ a Td point group was expected, which is quite different compared to what was computed. The same applies to PF32+, which actually has a point group of D3h. This is the first significant downfall discovered in the programme.
Energy
The electronic structure of the molecules were solved to get computed MOs for each molecule. The method was changed to: energy, additional keywords: pop=full, NBO=full NBO. The .chk file from the optimisation was used during analysis. Whilst attempts were made to draw the MO diagram of PF5 and the subsequent molecules, it was eventually found that it was too complex for me to construct. A general comparison of the computed MOs has therefore been made.
PF5:[21] Looking at the file, information on the electron density in the molecule can be gathered, which is related to the bonding in the molecule. The first one, below, tells us that only 17.34% comes from the P orbital; the remaining 82.63% comes from F orbitals. The hybridisation of the P is 21.34% s-character, 64.49% p and 14.17% d, whereas the hybridisation of the F is 26.43% s, 73.47% p and 0.10% d.
NBO analysis was then carried out using the .log file. The charge distribution in the molecule shows what was expected - the P atom is bright green and has a high positive charge because electrons are being withdrawn from it 5 very electronegative atoms. The F atoms are red and have a high negative charge because they are electron rich. The NBO charge for P: 2.018, F(axial): -0.444 and F(equatorial): -0.377.
      (Occupancy)   Bond orbital/ Coefficients/ Hybrids
---------------------------------------------------------------------------------
    1. (1.96890) BD ( 1) P   1 - F   2
               ( 17.37%)   0.4167* P   1 s( 21.34%)p 3.02( 64.49%)d 0.66( 14.17%)
                                           0.0000  0.0000 -0.4618  0.0114 -0.0041
                                          -0.0003  0.0000  0.0000  0.0000  0.0000
                                           0.0000  0.0000 -0.8021 -0.0367  0.0117
                                          -0.0004  0.0000  0.0000  0.0000  0.0000
                                           0.0000  0.0000  0.0000  0.0000  0.1475
                                           0.3463
               ( 82.63%)   0.9090* F   2 s( 26.43%)p 2.78( 73.47%)d 0.00(  0.10%)
                                           0.0000 -0.5141 -0.0057  0.0000  0.0000
                                           0.0000  0.0000  0.8571 -0.0034 -0.0040
                                           0.0000  0.0000  0.0000  0.0000  0.0000
                                           0.0000  0.0265  0.0163
PF4+:[22] The file shows us that the contribution to the first bond is 19.35% P atom and the remaining 80.65% comes from the F atom. The hybridisation of the P is 25.00% s-character, 71.19% p and 3.81% d, whereas the hybridisation of the F is 25.74% s, 74.13% p and 0.12% d. The NBO charge for P: 1.995, F(axial and equatorial): -0.249.
      (Occupancy)   Bond orbital/ Coefficients/ Hybrids
---------------------------------------------------------------------------------
    1. (1.98815) BD ( 1) P   1 - F   2
               ( 19.35%)   0.4399* P   1 s( 25.00%)p 2.85( 71.19%)d 0.15(  3.81%)
                                           0.0000  0.0000 -0.5000  0.0018  0.0000
                                           0.0000  0.0000 -0.6879 -0.0365  0.0091
                                           0.0000  0.0000  0.0000  0.0000  0.0000
                                           0.0000  0.0000 -0.4864 -0.0258  0.0064
                                           0.0000  0.0000 -0.1594  0.0000 -0.1127
                                           0.0000
               ( 80.65%)   0.8980* F   2 s( 25.74%)p 2.88( 74.13%)d 0.00(  0.12%)
                                           0.0000 -0.5073 -0.0048  0.0000  0.7030
                                          -0.0038 -0.0031  0.0000  0.0000  0.0000
                                           0.4971 -0.0027 -0.0022  0.0000 -0.0288
                                           0.0000 -0.0204  0.0000
PF32+:[23] The file shows us that the contribution to the first bond is 21.26% P atom and the remaining 78.74% comes from the F atom. The hybridisation of the P is 33.07% s-character, 64.43% p and 0.11% d, whereas the hybridisation of the F is 19.72% s, 80.16% p and 0.12% d. The NBO charge for P: 2.179, F(axial and equatorial): -0.060.
      (Occupancy)   Bond orbital/ Coefficients/ Hybrids
---------------------------------------------------------------------------------
    1. (1.98578) BD ( 1) P   1 - F   2
               ( 21.26%)   0.4611* P   1 s( 33.07%)p 1.92( 63.43%)d 0.11(  3.50%)
                                           0.0000  0.0000 -0.5750  0.0028  0.0000
                                           0.0000  0.0000 -0.3968 -0.0331  0.0070
                                           0.0000  0.0000 -0.6873 -0.0573  0.0121
                                          -0.0001  0.0000  0.0001  0.0000  0.0000
                                           0.0000 -0.1557  0.0000 -0.0001  0.0899
                                           0.0517
               ( 78.74%)   0.8874* F   2 s( 19.72%)p 4.06( 80.16%)d 0.01(  0.12%)
                                           0.0000 -0.4435  0.0229  0.0001  0.4477
                                           0.0014  0.0005  0.7754  0.0024  0.0009
                                           0.0009  0.0000  0.0000 -0.0257  0.0000
                                           0.0000  0.0148  0.0165
For the P atom the s-character shows a roughly steady increase, whereas the d-character shows a sharp decrease going to PF4+, with a much lower drop going to PF32+. The reason for the change in d-character is due to the removal of the F atom. When the P atom hybridises, one of the electrons from the s-orbital moves to the d-orbital (because all of the p-orbitals are singly filled with an electron). This allows the molecule to form 5 bonds and also means that the hybridisation has d-character (sp3d). Upon removal of the F atom, an electron is also removed and there is no need for the hybridisation with the d-orbital, hence the significant drop in its character (sp3). It does not completely go to 0 because there is still small amount of hybridisation with this orbital. The s and p-character initially increase to make up for this, but the s-character then increases more later once the second F is removed as there is a reduction in the p-character upon removal of the second electron (as this is the next highest level orbital); and thus a subsequent decrease in p-character (sp2.
For the F atom the insignificant amount of d-character is a constant. The s-character decreases slowly and the p-character increases slowly because the bonding to the P-atom changes slightly as each F atom is lost and the geometry of the molecule changes.
Although attempts were made to run frequency analysis, the error message 'Failure reading vibrational data' was received when the files were opened. Although there is only one type of bond in the molecule, it is expected that there would be a slight change in the IR spectra to reflect the change in the structure, and thus point groups of the molecules.
Conclusion
As shown above by the numerous exercises, computational techniques have their benefits and drawbacks in predicting the structure and other properties of inorganic compounds. The minimum energy structure of a molecule can be gauged quite easily depending on what basis set is used, however factors like the point group yield less accurate results. As useful as the data extracted from the energy and frequency analysis is, this could also be seen to be difficult and time-consuming. Overall though, the benefits of computational chemistry outweigh the negatives. The mini-project is one example of where trends in a set of molecules can be investigated without synthesising the compounds under investigation.
References
- ↑ BH3 optimised, https://wiki.ch.ic.ac.uk/wiki/index.php?title=Image:Bh3_optimised.log
- ↑ TlBr3 optimised, https://wiki.ch.ic.ac.uk/wiki/index.php?title=Image:Tlbr3_optimisation.log
- ↑ J. Blixt, J. Glaser, J. Minx, I. Persson, P. Persson, M. Sandstroem, J. Am. Chem. Soc., 1995, 117, 5089. DOI:10.1021/ja00123a011
- ↑ SPECRa Chemistry Repository: Item 10042/to-5729, DOI:10042/to-5729
- ↑ P. Hunt, L3 tutorial MO diagram http://www.huntresearchgroup.org.uk/teaching/teaching_MOs_year2/L3_Tut_MO_diagram_BH3.pdf
- ↑ ChemWiki, http://www.huntresearchgroup.org.uk/teaching/teaching_comp_lab_year3/10b_MoC4L2_opt.html
- ↑ SPECRa Chemistry Repository: Item 10042/to-5786, DOI:10042/to-5786
- ↑ F. A. Cotton, D. J. Darensbourg, S. Klein, B. W. S. Kolthammer, Inorg. Chem., 1982, 21, 1651. DOI:10.1021/ic00134a075
- ↑ SPECRa Chemistry Repository: Item 10042/to-5787, DOI:10042/to-5787
- ↑ F. A. Cotton, D. J. Darensbourg, S. Klein, B. W. S. Kolthammer, Inorg. Chem., 1982, 21, 2661. DOI:10.1021/ic00137a026
- ↑ SPECRa Chemistry Repository: Item 10042/to-5789, DOI:10042/to-5789
- ↑ SPECRa Chemistry Repository: Item 10042/to-5790, DOI:10042/to-5790
- ↑ D. W. Bennett, T. A. Siddiquee, D. T. Haworth, S. E. Kabir, F. K. Camellia, J. Chem. Crys., 2004, 34, 353. DOI:10.1023/B:JOCC.0000028667.12964.28
- ↑ M. Y. Darensbourg, D. J. Darensbourg,, J. Chem. Ed., 1970, 47, 33. DOI:10.1021/ed047p33
- ↑ SPECRa Chemistry Repository: Item 10042/to-5898, DOI:10042/to-5898
- ↑ L. Pauling,, Nature of the Chemical Bond, Cornell University Press 1944, pp. 225
- ↑ SPECRa Chemistry Repository: Item 10042/to-5940, DOI:10042/to-5940
- ↑ SPECRa Chemistry Repository: Item 10042/to-5941, DOI:10042/to-5941
- ↑ SPECRa Chemistry Repository: Item 10042/to-5939, DOI:10042/to-5939
- ↑ J. K. Wilmshurst, H. J. Bernstein, J. Chem. Phys., 1957, 27, 661. DOI:10.1063/1.1743809
- ↑ SPECRa Chemistry Repository: Item 10042/to-5952, DOI:10042/to-5952
- ↑ SPECRa Chemistry Repository: Item 10042/to-5953, DOI:10042/to-5953
- ↑ SPECRa Chemistry Repository: Item 10042/to-5957, DOI:10042/to-5957


