Rep:Mod:racheltestpage
Week 1
BH3 Optimisation
B3LYP/3-21G
Optimisation log file here.
B3LYP/6-31G(d,p)
Optimisation log file here.
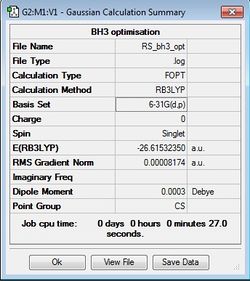
| Summary Data | Convergence | Jmol | |||
|---|---|---|---|---|---|
|
Item Value Threshold Converged? Maximum Force 0.000203 0.000450 YES RMS Force 0.000098 0.000300 YES Maximum Displacement 0.000653 0.001800 YES RMS Displacement 0.000415 0.001200 YES |
|
GaBr3 Optimisation
B3LYP/LANL2DZ
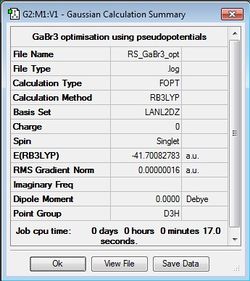
Optimisation file: DOI:10042/31148 .
| Summary Data | Convergence | Jmol | |||
|---|---|---|---|---|---|
|
Item Value Threshold Converged? Maximum Force 0.000000 0.000450 YES RMS Force 0.000000 0.000300 YES Maximum Displacement 0.000003 0.001800 YES RMS Displacement 0.000002 0.001200 YES |
|
BBr3 Optimisation
B3LYP/6-31G(d,p)LANL2DZ
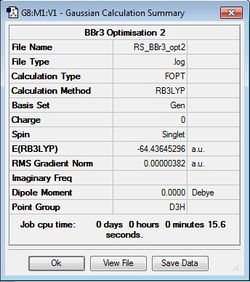
Optimisation file: DOI:10042/31141 .
| Summary Data | Convergence | Jmol | |||
|---|---|---|---|---|---|
|
Item Value Threshold Converged? Maximum Force 0.000008 0.000450 YES RMS Force 0.000005 0.000300 YES Maximum Displacement 0.000036 0.001800 YES RMS Displacement 0.000023 0.001200 YES |
|
Geometry Information
The computed bond lengths and bond angles are shown in the table below.
| BH3 | BBr3 | GaBr3 | |
|---|---|---|---|
| r(E-X) Å | 1.19 | 1.93 | 2.35 |
| θ(X-E-X) degrees(º) | 120.0 | 120.0 | 120.0 |
Analysis
What difference does changing the ligand have? How are H and Br similar, how are they different? What difference does changing the central element make? How are B and Ga similar, how are they different?
H and B are similar in that they both form single bonds with the central atom. However H only has one valence electron while Br has seven valence electrons and its filled p orbitals can overlap with the electron cloud of the central atom, allowing it to donate some of the electron density back to the central atom. Hence some degree of backbonding can occur with the Br ligands but not for H ligands as they are too small and cannot donate electron density back to the central atoms. This makes the B-Br bond stronger than the B-H, hence the bond length does not increase a lot from B-H to B-Br.
Changing the central atom does not affect the geometry of the molecule since the molecule remains trigonal planar with the same symmetry, D3. Hence the bond angles for all three compounds are 120.0º, as expected for a trigonal planar compound. However, changing the central changes the bond length between the central atom and the ligand. The bond length increases as the atoms are changed to larger atoms. Comparing between BH3 and BBr3, as the ligand is changed from H to Br, the E-X bond length increases from 1.19 Å to 1.93 Å.
Also, as Ga is in the same row as Br, there is better overlap between the similarly sized orbitals of Ga and Br, as compared to between the orbitals of B and Br, so the bond length does not increase as much. B and Ga are both Group III elements, hence they both have only three valence electrons and form electron-deficient EX3 compounds. Ga is a larger atom than B hence its orbitals are more diffuse and there is a fair amount of shielding by the inner electron shells from the nuclear charge.
What is a bond? How much energy is there in a strong, medium and weak bond? Give examples of each type of bond (strong, medium and weak) In some structures gaussview does not draw in the bonds where we expect, why does this NOT mean there is no bond?
Bonds are interactions between atoms that hold them together due to the attractive electrostatic forces present between the atoms, lowering the overall energy of the molecule. It is also visualised as the overlap of individual atomic orbitals to form molecular orbitals. There are different kinds of bonds: strong bonds such as covalent and ionic and weaker bonds such as hydrogen bonds. Stronger bonds have a higher force constant and have higher energy. For covalent bonds, the higher the bond order, the stronger is the bond. For example, C ≡ O bond is a strong bond with a bond energy of 1072 kJ/mol. A C-C bond is an example of a medium bond with a bond energy of 347 kJ/mol. On the other hand, F — F is a weak bond with a bond energy of 154 kJ/mol [1] due to the electrostatic repulsion between the lone pairs as a result of the short F-F bond length. A very weak bond such as a hydrogen bond would have a bond energy of about 10 kJ/mol.
For some structures where expected bonds are not drawn in by GaussView, it does not mean that there is no bond present. It means that the distance between the two atoms exceed the average bond length. GaussView draws bonds based on distance calculations and comparisons to the average bond length for those atoms, so it does not draw the bonds that exceed a certain distance value. There can be attractive forces between the atoms even if their distances are further apart than the threshold, hence there can be still molecular interactions between the atoms.
Frequency Analysis
BH3:B3LYP/6-31G(d,p)
Frequency file: here
| Summary Data | Low Modes |
|---|---|

|
Low frequencies --- -10.1940 -10.1821 -3.1776 0.0008 0.0579 0.4920 Low frequencies --- 1162.9850 1213.1461 1213.1463 |
Vibrational spectrum for BH3
| Frequency (cm-1) | Intensity | IR active? | Type | Symmetry |
|---|---|---|---|---|
| 1164 | 93 | Yes | Bend | A2" |
| 1213 | 14 | Very slight | Bend | E' |
| 1213 | 14 | Very slight | Bend | E' |
| 2583 | 0 | No | Stretch | A1' |
| 2716 | 126 | Yes | Stretch | E' |
| 2716 | 126 | Yes | Stretch | E' |
Explain why are there less than six peaks in the spectrum, when there are obviously six vibrations.
There are only three peaks observed in the IR spectrum at 2716, 1213 and 1164 (cm-1) because one of vibrations is IR inactive, while the two of the peaks are due to two degenerate sets of vibrations. Vibrations are only IR active if they result in a change in dipole moment of the molecule. The vibration at 2583cm-1 is an symmetric stretch with the three hydrogen atoms moving away from the central atom at the same time, hence there is no change in dipole moment and no IR peak observed. The peaks at 1213cm-1 and 2716cm-1 due to two sets of degenerate vibrations, which are bending and asymmetric stretching respectively. These vibrations are IR active as they cause a change in the dipole moment of the molecule.
GaBr3:B3LYP/6-31G(d,p)
Frequency file: DOI:10042/31190
| Summary Data | Low Modes |
|---|---|

|
Low frequencies --- -0.5252 -0.5247 -0.0024 -0.0010 0.0235 1.2010 Low frequencies --- 76.3744 76.3753 99.6982 |
Vibrational spectrum for GaBr3
| Frequency (cm-1) | Intensity | IR active? | Type | Symmetry |
|---|---|---|---|---|
| 76 | 3 | Very slight | Bend | E' |
| 76 | 3 | Very slight | Bend | E' |
| 100 | 9 | Very slight | Bend | A2" |
| 197 | 0 | No | Stretch | A1' |
| 316 | 57 | Yes | Stretch | E' |
| 316 | 57 | Yes | Bend | E' |
Analysis
What does the large difference in the value of the frequencies for BH3 compared to GaBr3 indicate? There been a reordering of modes! This can be seen particularly in relation to the A2" umbrella motion. Compare the relative frequency and intensity of the umbrella motion for the two molecules. Looking at the displacement vectors how has the nature of the vibration changed? Why?
The frequency of a vibration is proportional to the square root of the ratio of the force constant to the reduced mass as shown in the equation below.

For Ga-Br the reduced mass is a lot larger than that of B-H, hence the frequencies of the vibrations are at a lower range. The difference in frequencies also indicate that the force constants for the B-H and Ga-Br bonds are different. The stronger the bond, the larger the force constant, the higher the frequency of vibration.
Comparison of A2" umbrella motion
| BH3 | GaBr3 | |
|---|---|---|
| Image | 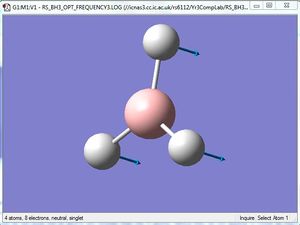
|
|
| Frequency (cm-1) | 1164 | 100 |
| Intensity | 93 | 9 |
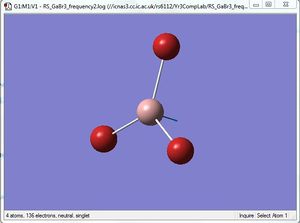
For the A2" umbrella motion, the frequency of the vibration is 1164cm-1 with an intensity of 93 for BH3, while it is 100cm-1 with an intensity of 9 for GaBr3. The nature of the vibration has changed because for BH3, the three hydrogen atoms can be seen to be moving back and forth in a direction opposite to the central B atom, while for GaBr3, the three Br atoms appear to be stationary as the central Ga atom moves back and forth. This could be because the Br atoms are heavier than the H atoms, hence they do not appear to move as much as the H atoms do. The frequency and intensity of the vibration is hence much lower for GaBr3 compared to BH3.
Why must you use the same method and basis set for both the optimisation and frequency analysis calculations? What is the purpose of carrying out a frequency analysis? What do the "Low frequencies" represent?
The same method and basis set must be used for the optimisation and frequency analysis calculations to ensure that the calculations are being carried out with the same approximations and on exactly the same molecule with the optimised geometry. The same method must be used to ensure that the operator for the Schrodinger equation is the same, and the same basis set should be used to ensure that the wavefunctions used for the calculations are the same. A simpler basis set is less accurate; for example, a calculation done using the 3-21G basis set gives less accurate result compared to that being done using the 6-31G set. The same basis set should be used for optimisation and frequency analysis to ensure that the results are useful. The purpose of carrying out a frequency analysis is to find the second derivative of the function to determine if the stationary point found is indeed a minimum point, instead of a maximum point where the first derivative is also zero. The frequencies calculated should be all positive showing that the minimum energy has been found from the optimisation. However if negative frequencies are shown in the output, it could mean that a transition state was found or that optimisation was unsuccessful. The six low frequencies represent the translational and rotational frequencies, and they should be close to zero and within the range (+/- 15 cm-1), if not the optimisation should be repeated with a tighter convergence criteria.
BH3 MO analysis
Are there any significant differences between the real and LCAO MOs? What does this say about the accuracy and usefulness of qualitative MO theory?
There are no significant differences between the real and LCAO MOs. The phase distribution in the real MOs are as shown in the LCAO MOs, and the nodes are present as predicted in the LCAO MOs. However, in the real MOs it is observed that the distinction between the orbitals are not as distinct as in the LCAO MOs. This shows that the electrons are not as localised as predicted in the LCAO MOs. It shows that MO theory is a generally good way of predicting the real MOs and hence useful in bonding analysis, though it is necessary to take note that in real MOs the electrons are more delocalised over the whole molecule.
NH3 Optimisation
B3LYP/6-31G(d,p)
Optimisation log file here.
| Summary Data | Convergence | Jmol | |||
|---|---|---|---|---|---|

|
Item Value Threshold Converged? Maximum Force 0.000024 0.000450 YES RMS Force 0.000012 0.000300 YES Maximum Displacement 0.000079 0.001800 YES RMS Displacement 0.000053 0.001200 YES |
|
Frequency Analysis
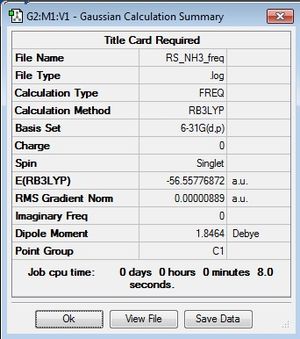
Frequency file: here
| Summary Data | Low Modes |
|---|---|
|
Low frequencies --- -6.5859 -0.0013 0.0016 0.0019 11.4596 16.1959 Low frequencies --- 1089.3549 1693.9214 1693.9587 |
Population Analysis
Population Analysis file: here
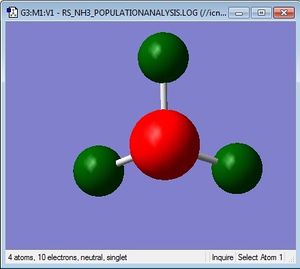
Charge distribution
| Charge Distribution | Specific NBO Charges |
|---|---|
Charge Limits: -1.125 to 1.125 |
N: -1.125 H: 0.375 |
Ammonia-Borane
B3LYP/6-31G(d,p)
Optimisation log file here.
| Summary Data | Convergence | Jmol | |||
|---|---|---|---|---|---|

|
Item Value Threshold Converged? Maximum Force 0.000139 0.000450 YES RMS Force 0.000063 0.000300 YES Maximum Displacement 0.000771 0.001800 YES RMS Displacement 0.000338 0.001200 YES |
|
Frequency Analysis
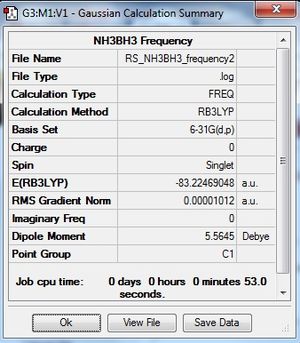
Frequency file: here
| Summary Data | Low Modes |
|---|---|
|
Low frequencies --- -9.4461 -0.0009 -0.0008 0.0010 16.2529 20.7469 Low frequencies --- 263.8367 633.1258 638.9460 |
E(NH3)= -56.5577687 au
E(BH3)= -26.6153235 au
E(NH3BH3)= -83.2246905 au
ΔE=E(NH3BH3)-[E(NH3)+E(BH3)]= -0.0515983 au = - 135.79 kJ/mol
With reference to your earlier discussion on the strength of bonds (weak, medium or strong) is the association of NH3 and BH3 to form a B-N bond within NH3BH3 weak, medium or strong.
NH3 and BH3 are joined by a dative bond, with N donating its lone pair of electron into the empty orbital of the electron deficient B. The bond energy is quite low, so it shows that the B-N bond is weak.
Aromaticity Project
Overview
Introduction
Benzene Optimisation
B3LYP/6-31G(d,p)
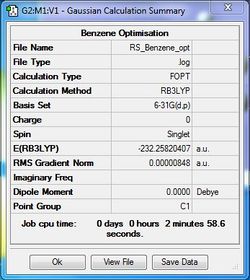
Benzene was optimised using the B3LYP as method and 6-31G as the basis set.
Optimisation file: DOI:10042/31262 .
| Summary Data | Convergence | Jmol | |||
|---|---|---|---|---|---|
|
Item Value Threshold Converged? Maximum Force 0.000013 0.000015 YES RMS Force 0.000004 0.000010 YES Maximum Displacement 0.000054 0.000060 YES RMS Displacement 0.000017 0.000040 YES |
|
Frequency Analysis
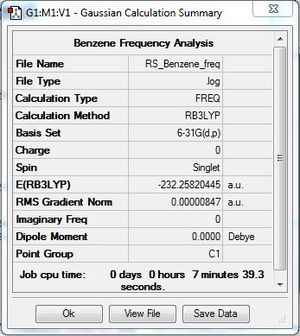
Frequency file: DOI:10042/31270 .
Frequency analysis was carried out to ensure that the optimised benzene molecule was at the minimum energy state. The low frequencies were within acceptable range.
| Summary Data | Low Modes |
|---|---|
|
Low frequencies --- -3.9004 0.0004 0.0004 0.0009 5.4182 7.6326 Low frequencies --- 414.5262 414.5887 621.0907 |
Population Analysis
Population analysis file: DOI:10042/31278 .
MO diagram
This MO diagram shows the real MOs based on calculations on the right side, and the LCAO MOs deconstructed from the real MOs on the left side. Only the valence orbitals are shown (MOs 7 to 27). The MO lowest in energy on the diagram is the totally symmetric sigma bonding MO. The MO highest in energy on the diagram is the pi antibonding unoccupied MO. It is interesting to note that the sigma antibonding orbitals are lower in energy than the pi antibonding orbitals. There are also other MOs which have overall antibonding character but are still relatively low in energy. Those with antibonding interactions through bonds are higher in energy than those with antibonding interactions through space.
MO analysis
How do these MOs relate to the common conception of aromaticity? Hint 2: aromaticity relates to delocalisation. Hint 3: aromaticity relates to the total pi electron density, and MOs contain formally only 2 electrons each.
Aromaticity is the delocalisation of electron density around a ring of atoms. Although the chemical structure of benzene is drawn to be a six carbon ring with three C=C bonds and three C-C bonds, it can be seen from the MOs that the electron density from the pi bonds are spread out evenly around the whole bond. This can be seen most clearly in the pi totally bonding MO, while the pi electron density is spread out evenly around the ring of six carbon atoms. While MOs contain formally only 2 electrons each, the distinction between the MOs are not clear in the real computed MOs, and the electron density is visualised as over the whole space of atoms in the MO diagram as shown above.
NBO Analysis
| Charge Distribution | Specific NBO Charges |
|---|---|
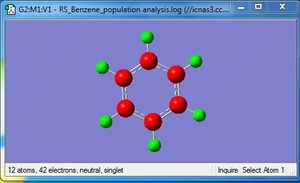
Charge Limits: -0.239 to 0.239 |
C: -0.239 H: 0.239 |
Based on the NBO analysis, it can be seen that each carbon atom formed 3 essentially sp2 hybrid orbitals which each interact with the sAO of one hydrogen atom and the sp2 hybrid orbital of two adjacent carbons. Each carbon also has one unhybridised p orbital (100% p orbital) which forms the delocalised pi system. This p orbital has an occupancy of 1.67.
Principal Delocalizations
          NBO                        Occupancy    Energy
====================================================================================
Molecular unit  1  (C6H6)
    1. BD (   1) C   1 - C   2          1.98098    -0.68187
    2. BD (   1) C   1 - C   6          1.98098    -0.68191
    3. BD (   2) C   1 - C   6          1.66518    -0.23791
    4. BD (   1) C   1 - H   7          1.98306    -0.51227
    5. BD (   1) C   2 - C   3          1.98098    -0.68191
    6. BD (   2) C   2 - C   3          1.66519    -0.23791
    7. BD (   1) C   2 - H   8          1.98306    -0.51227
    8. BD (   1) C   3 - C   4          1.98098    -0.68187
    9. BD (   1) C   3 - H   9          1.98306    -0.51227
   10. BD (   1) C   4 - C   5          1.98098    -0.68191
   11. BD (   2) C   4 - C   5          1.66518    -0.23791
   12. BD (   1) C   4 - H  10          1.98306    -0.51227
   13. BD (   1) C   5 - C   6          1.98098    -0.68187
   14. BD (   1) C   5 - H  11          1.98306    -0.51227
   15. BD (   1) C   6 - H  12          1.98306    -0.51227
   16. CR (   1) C   1                  1.99911   -10.04069
   17. CR (   1) C   2                  1.99911   -10.04069
   18. CR (   1) C   3                  1.99911   -10.04069
   19. CR (   1) C   4                  1.99911   -10.04069
   20. CR (   1) C   5                  1.99911   -10.04069
   21. CR (   1) C   6                  1.99911   -10.04069
Boratabenzne Optimisation
B3LYP/6-31G(d,p)
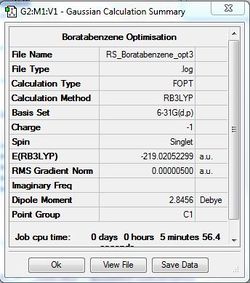
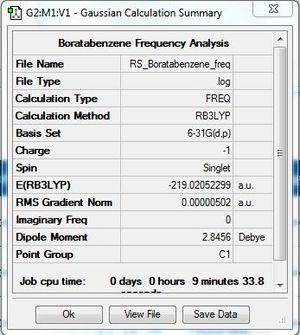
Optimisation file: DOI:10042/31326 .
| Summary Data | Convergence | Jmol | |||
|---|---|---|---|---|---|
|
Item Value Threshold Converged? Maximum Force 0.000013 0.000015 YES RMS Force 0.000004 0.000010 YES Maximum Displacement 0.000054 0.000060 YES RMS Displacement 0.000017 0.000040 YES |
|
Frequency Analysis
Frequency file: DOI:10042/31332 .
| Summary Data | Low Modes |
|---|---|
|
Low frequencies --- -7.2703 -0.0007 -0.0005 0.0007 3.1509 4.5207 Low frequencies --- 371.2965 404.4156 565.0825 |
Population Analysis
Population analysis file: DOI:10042/31333 .
MO
NBO Analysis
| Charge Distribution | Specific NBO Charges |
|---|---|
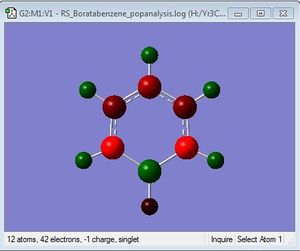
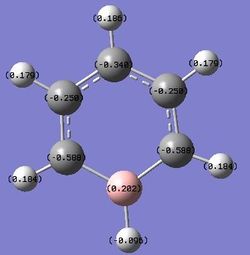
Charge Limits: -0.588 to 0.588 |
B:0.202 C: -0.340, -0.250, -0.588 H: 0.186, 0.179, 0.184, -0.096 |
Pyridinium Optimisation
B3LYP/6-31G(d,p)
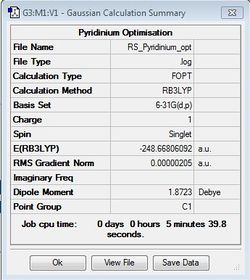
Optimisation file: DOI:10042/31341 .
| Summary Data | Convergence | Jmol | |||
|---|---|---|---|---|---|
|
Item Value Threshold Converged? Maximum Force 0.000004 0.000015 YES RMS Force 0.000001 0.000010 YES Maximum Displacement 0.000010 0.000060 YES RMS Displacement 0.000004 0.000040 YES |
|
Frequency Analysis
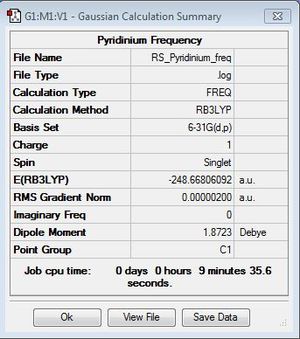
Frequency file: DOI:10042/31270 .
| Summary Data | Low Modes |
|---|---|
|
Low frequencies --- -9.3855 -2.9634 -0.0006 0.0005 0.0006 0.8971 Low frequencies --- 391.9002 404.3426 620.1994 |
Population Analysis
Population analysis file: DOI:10042/31360 .
MO
NBO Analysis
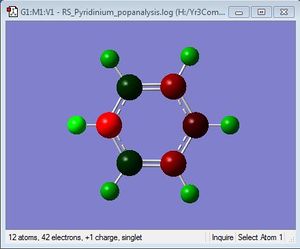
| Charge Distribution | Specific NBO Charges |
|---|---|
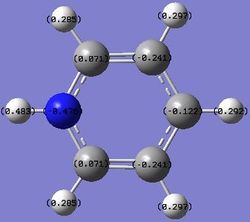
Charge Limits: -0.483 to 0.483 |
N: -0.476 C: 0.071, -0.241, -0.122 H: 0.483, 0.285, 0.297, 0.292 |
Borazine Optimisation
B3LYP/6-31G(d,p)
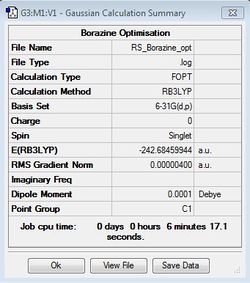
Optimisation file: DOI:10042/31340 .
| Summary Data | Convergence | Jmol | |||
|---|---|---|---|---|---|
|
Item Value Threshold Converged? Maximum Force 0.000009 0.000015 YES RMS Force 0.000003 0.000010 YES Maximum Displacement 0.000027 0.000060 YES RMS Displacement 0.000008 0.000040 YES |
|
Frequency Analysis
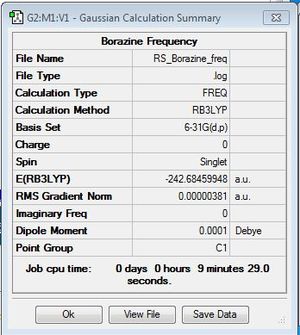
Frequency file: DOI:10042/31346 .
| Summary Data | Low Modes |
|---|---|
|
Low frequencies --- -7.2861 -0.0010 -0.0007 -0.0003 4.1726 7.4070 Low frequencies --- 289.5824 289.7072 404.4525 |
Population Analysis
Population analysis file: DOI:10042/31360 .
MO
NBO Analysis
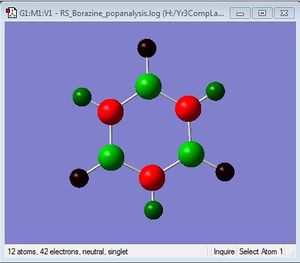
| Charge Distribution | Specific NBO Charges |
|---|---|
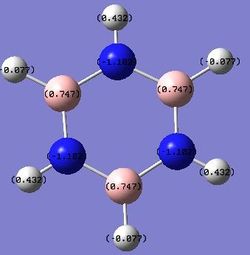
Charge Limits: -1.102 to 1.102 |
B: 0.747 N: -1.102 H: -0.077, 0.432 |
Comparison of Charge Distribution
| Benzene | Boratabenzene | Pyridinium | Borazine | |
|---|---|---|---|---|
| Dipole Moment (Debye) | 0.00 | 2.85 | 1.87 | 0.00 |
| Charge Distribution | 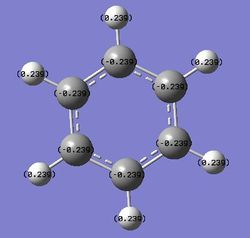
|
|
|
|
Benzene is symmetrical about the C6 axis, hence it has an even charge distribution among the six carbon atoms and no dipole moment.
Substituting one of the CH units for a BH and NH in boratabenzene and pyridinium respectively breaks the symmetry and causes an uneven charge distribution throughout the molecule. Nitrogen is more electronegative compared to carbon, while boron is less electronegative compared to carbon. In the images above, it can be clearly seen that the electron density is shifted to the more electronegative atoms in the molecule.
In boratabenzene, the electron density is shifted more to the five carbon atoms, while the boron atom bears a positive charge of +0.202, and it is shown to be green. The hydrogen atom adjacent to the boron has a negative charge of -0.095, and is the only delta negative hydrogen in the molecule. This is because hydrogen is slightly more electronegative than boron, causing the B-H bond to be polarised. The carbon atoms adjacent to the boron atom each have a positive charge of -0.588, and are more positively charged than the carbons which are further away from the boron atom. This is due to the difference in electronegativity between carbon and boron, causing the C-B bond to be polarised as well, and hence the carbons are highly positively charged. The other hydrogen atoms on the five carbon atoms are all positively charged, though less positively charged as compared to the hydrogen atoms in benzene. The charges on all the molecules add up to -1, as boratabenzene molecule bears an overall negative charge.
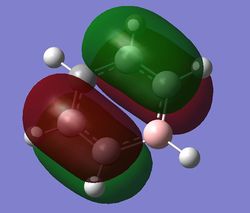
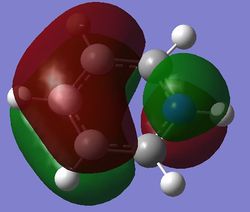
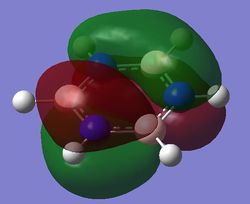
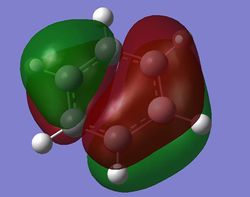
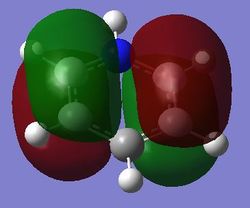
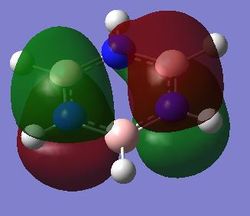
Comparison of MOs
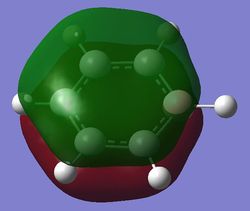
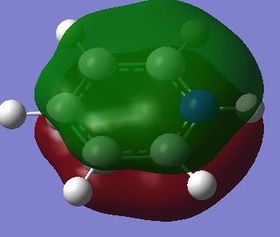
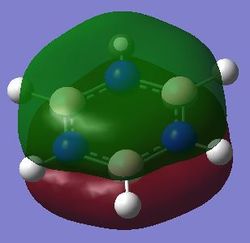
| Benzene | Boratabenzene | Pyridinium | Borazine | |
|---|---|---|---|---|
| Fully bonding pi MOs | 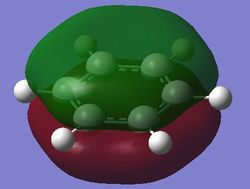
|
|
|
|
| pi MOs | 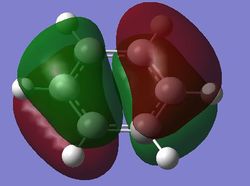
|
|
|
|
| pi MOs | 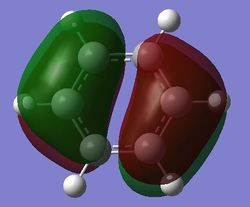
|
|
|
|
Present a comparison across the series for benzene, boratabenzne, pyridinium and borazine for each MO. What effect do these substitutions have on the MOs? Things you could consider are:
the LCAOs contributing to the MOs
the energy of the MOs
the ordering of MOs
the degeneracy of the MOs
what are the similarities, what are the differences between these MOs?
any other aspect of the MO you think may be interesting or important
Benzene is a highly symmetrical molecule and hence there are degenerate energy levels in the MO diagram. Replacing a CH unit with BH and NH in boratabenzene and pyridinium respectively breaks the symmetry hence there are no degenerate energy levels seen in the MO diagram.


