Rep:Mod:qwt11 inorg
Qian Wen Tan
CID: 00700342
Optimisation of BH3 molecule
Optimisation was performed on 2 different BH3 molecules. The B-H bond lengths for the first(A) were not modified while the bond lengths for the second(B) were modified to 1.53Å, 1.54Å and 1.55Å.
Using basis set 3-21G
Log file
A:[| 3-21G .log file for (A)]
B:[| 3-21G .log file for (B)]
Summary of results
BH3 optimisation
| BH3 molecules | (A) | (B) |
|---|---|---|
| File Type | .log | .log |
| Calculation Type | FOPT | FOPT |
| Calculation Method | RB3LYP | RB3LYP |
| Basis Set | 3-21G | 3-21G |
| Charge | 0 | 0 |
| Spin | Singlet | Singlet |
| E(RB3LYP) | -26.46226433 a.u. | -26.46226429 a.u. |
| RMS Gradient Norm | 0.00004507 a.u. | 0.00008851 a.u. |
| Dipole Moment | 0.0000 Debye | 0.0003 Debye |
| Point Group | D3h | CS |
| Job cpu time | 0 days 0 hours 0 minutes 6.0 seconds | 0 days 0 hours 0 minutes 12.0 seconds |
Final sets of forces and displacements for (A)
   Item               Value     Threshold  Converged?
 Maximum Force            0.000090     0.000450     YES
 RMS     Force            0.000059     0.000300     YES
 Maximum Displacement     0.000352     0.001800     YES
 RMS     Displacement     0.000230     0.001200     YES
 Predicted change in Energy=-4.580958D-08
 Optimization completed.
    -- Stationary point found.
Final sets of forces and displacements for (B)
 Item               Value     Threshold  Converged?
 Maximum Force            0.000220     0.000450     YES
 RMS     Force            0.000106     0.000300     YES
 Maximum Displacement     0.000940     0.001800     YES
 RMS     Displacement     0.000447     0.001200     YES
 Predicted change in Energy=-1.672478D-07
 Optimization completed.
    -- Stationary point found.
Optimisation was performed on 2 different starting BH3 molecules using the basis set 3-21G. as they give different results. The RMS gradient norm is <0.001 and close to 0 for both. In addition, both calculations also converged. Since the most basic basis set was used, the point group of (B) is CS instead of the expected D3h. This indicates that the level of calculation is insufficient for the programme to come up with the correct point group. The energy is calculated to be -26.46226433 a.u. for (A) and -26.46226429 a.u. for (B). The difference in energy is negligible.
Using basis set 6-31G(d,p)
Log file
A:[| 6-31G(d,p) .log file for (A)]
B:[| 6-31G(d,p) .log file for (B)]
Summary of results
BH3 optimisation
| BH3 molecules | (A) | (B) |
|---|---|---|
| File Type | .log | .log |
| Calculation Type | FOPT | FOPT |
| Calculation Method | RB3LYP | RB3LYP |
| Basis Set | 6-31G(d,p) | 6-31G(d,p) |
| Charge | 0 | 0 |
| Spin | Singlet | Singlet |
| E(RB3LYP) | -26.61532363 a.u. | -26.61532358 a.u. |
| RMS Gradient Norm | 0.00000475 a.u. | 0.00008206 a.u. |
| Dipole Moment | 0.0000 Debye | 0.0003 Debye |
| Point Group | D3h | CS |
| Job cpu time | 0 days 0 hours 0 minutes 6.0 seconds | 0 days 0 hours 0 minutes 15.0 seconds |
Final sets of forces and displacements for (A)
   Item               Value     Threshold  Converged?
 Maximum Force            0.000009     0.000450     YES
 RMS     Force            0.000006     0.000300     YES
 Maximum Displacement     0.000038     0.001800     YES
 RMS     Displacement     0.000025     0.001200     YES
 Predicted change in Energy=-5.342731D-10
 Optimization completed.
    -- Stationary point found.
Final sets of forces and displacements for (B)
 Item               Value     Threshold  Converged?
 Maximum Force            0.000204     0.000450     YES
 RMS     Force            0.000099     0.000300     YES
 Maximum Displacement     0.000875     0.001800     YES
 RMS     Displacement     0.000418     0.001200     YES
 Predicted change in Energy=-1.452109D-07
 Optimization completed.
    -- Stationary point found.
Optimised length
B-H: 1.19Å
Optimised angle
H-B-H: 120.0o
Optimisation of BH3 was performed using the basis set 6-31G(d,p), which is more accurate than 3-21G. The RMS gradient norm is <0.001 and close to 0 for both. In addition, both calculations also converged. The energy is calculated to be -26.61532363 a.u. for (A) and -26.61532358 a.u. for (B). Once again, the slight difference in energy is negligible. The optimised length of 1.19Å is identical to the one reported in literature[1], indicating accuracy in the calculation. One important observation is that the point group of (B) remained as CS despite using the basis set 6-31G(d,p). This implies that the programme was unable to detect the correct point group of the molecule as this is considered to be a low level calculation. This will later affect the frequency analysis of BH3 as shown below.
Optimisation of GaBr3 molecule
DOI
DOI:10042/26068
Summary of results
GaBr3 optimisation
| File Type | .log |
|---|---|
| Calculation Type | FOPT |
| Calculation Method | RB3LYP |
| Basis Set | LANL2DZ |
| Charge | 0 |
| Spin | Singlet |
| E(RB3LYP) | -41.69989295 a.u. |
| RMS Gradient Norm | 0.00402846 a.u. |
| Dipole Moment | 0.0000 Debye |
| Point Group | D3h |
| Job cpu time | 0 days 0 hours 0 minutes 23.1 seconds |
Final sets of forces and displacements
   Item               Value     Threshold  Converged?
 Maximum Force            0.000000     0.000450     YES
 RMS     Force            0.000000     0.000300     YES
 Maximum Displacement     0.000003     0.001800     YES
 RMS     Displacement     0.000002     0.001200     YES
 Predicted change in Energy=-1.282688D-12
 Optimization completed.
    -- Stationary point found.
Optimised length
Ga-Br: 2.39Å
Optimised angle
Br-Ga-Br: 120.0o
Optimisation of GaBr3 was performed using the basis set LANL2DZ as Ga and Br are heavy atoms that require the use of pseudo-potentials for more accurate calculations. The RMS gradient norm is <0.001 and close to 0 and the calculation converged. The energy is calculated to be -41.69989295 a.u.. The reported Ga-Br bond length for GaBr3 is 2.249Å[1]. This is slightly shorter than the computed length but the difference is not significant. Overall, the computed length of 2.39Å is reasonable.
Optimisation of BBr3 molecule
The BBr3 molecule was created by modifying BH3 (A).
Log file
[|Gen .log file]
Summary of results
BBr3 optimisation
| File Type | .log |
|---|---|
| Calculation Type | FOPT |
| Calculation Method | RB3LYP |
| Basis Set | Gen |
| Charge | 0 |
| Spin | Singlet |
| E(RB3LYP) | -64.43645296 a.u. |
| RMS Gradient Norm | 0.00000382 a.u. |
| Dipole Moment | 0.0000 Debye |
| Point Group | D3h |
| Job cpu time | 0 days 0 hours 0 minutes 40.5 seconds |
Final sets of forces and displacements
Item               Value     Threshold  Converged?
 Maximum Force            0.000008     0.000450     YES
 RMS     Force            0.000005     0.000300     YES
 Maximum Displacement     0.000036     0.001800     YES
 RMS     Displacement     0.000023     0.001200     YES
 Predicted change in Energy=-4.027258D-10
 Optimization completed.
    -- Stationary point found.
Optimised length
B-Br: 1.93Å
Optimised angle
Br-B-Br: 120.0o
Optimisation of BBr3 was performed using the basis set Gen as B is a light atom while Br is a heavy atom. This allows the specification of basis sets for the individual atoms. The RMS gradient norm is <0.001 and close to 0 and the calculation converged. The energy is calculated to be -64.43645296 a.u.. Comparing the optimised B-Br length to the reported length of 1.893Å[1], it is slightly longer but still close enough.
Analysis of results
Comparison of bond lengths of BH3, BBr3, and GaBr3
| Molecules | BH3 | BBr3 | GaBr3 |
|---|---|---|---|
| Optimised Bond lengths (Å) | 1.19 | 1.93 | 2.39 |
The bond lengths increases from BH3 to BBr3 to GaBr3. It reflects the bond strength, for the longer the bond, the weaker it is. In turn, bond strength is affected by a few factors: (1) size of atoms, (2) difference in electronegativity between atoms, (3) extent of orbital overlap between atoms and (4) bond polarity.
By comparing BH3 and BBr3, it can be observed that changing from a small ligand (H) to a large ligand (Br) lead to an increase in the bond length. Both B-H and B-Br are covalent bonds. The increase in bond length is caused by a few factors. Firstly, the Br atom will naturally be displaced further from B than the H atom as it is bigger in size. This is due to greater electron-electron repulsion when the two atoms are side by side as Br atom has more electrons. Hence, the equilibrium length will be longer between B-Br than B-H. In addition, the bond length is also affected by the difference in electronegativity between B and H and B and Br. H and Br are both more electronegative than B but Br is significantly more electronegative than H. Hence, the B-Br bond is more polar than the B-H bond as the more electronegative Br will draw more electrons towards it than H. This is a result of greater polarisability of Br than H. As a result, there is a significant increase in bond length from 1.19Å to 1.93Å.
GaBr3 has a longer bond length than BBr3. In general, Ga is a bigger molecule with more electrons than B hence the bond length will increase as mentioned before. In addition, although both Ga and B belong to group 13 of the Period Table of Elements, Ga is a metal while B is a non-metal. Hence, the Ga-Br bond is ionic while the B-Br bond is covalent. In general, ionic bonds are weaker than covalent bonds as there are electrostatic attraction between the ions while a covalent bond involves the 2 atoms sharing their electrons. In addition, the larger the atom, the more diffused its orbital. Hence, Ga-Br bond is the weakest as it has the least orbital overlap while the B-H bond is the strongest as it has the most orbital overlap.
A bond is an attractive interaction between atoms. According to the nature of interaction and the type of atoms involved, there are a few different types of bonds possible: covalent bond, ionic bond, metallic bond and agostic bond. All these forms of bond result in the formation of chemical molecules constructed from 2 or more atoms. In addition, there is also hydrogen bond, which is technically not a proper bond, but it is also formed due to attractive interactions between atoms. Overall, the formation of a bond will lead to a reduction in the overall energy of the system.
In some structures, Gaussview does not show the expected bonds. However this does not imply the absence of a bond. Rather, Gaussview has been structured to show the presence of a bond, if the distance between the 2 atoms is within a pre-defined value. Hence, as long as the bond distance between atoms is out of this value, Gaussview will not draw in the bond. However, this does not define the presence of the bond, as it is still dependent on the interaction between the atoms; if it is sufficiently strong, a bond will still be formed.
Frequency analysis for BH3
Log file
[| Frequency analysis .log file for (A)]
[| Frequency analysis .log file for (B)]
[| Frequency analysis .log file for (B)(int=ultrafine scf(conver=9))]
Summary of results
BH3 optimisation
| BH3 molecules | (A) | (B) | (B)(int=ultrafine scf(conver=9)) |
|---|---|---|---|
| File Type | .log | .log | .log |
| Calculation Type | FREQ | FREQ | FREQ |
| Calculation Method | RB3LYP | RB3LYP | RB3LYP |
| Basis Set | 6-31G(d,p) | 6-31G(d,p) | 6-31G(d,p) |
| Charge | 0 | 0 | 0 |
| Spin | Singlet | Singlet | Singlet |
| E(RB3LYP) | -26.61532363 a.u. | -26.61532358 a.u. | -26.61532349 a.u. |
| RMS Gradient Norm | 0.00000477 a.u. | 0.00008202 a.u. | 0.00008330 a.u. |
| Dipole Moment | 0.0000 Debye | 0.0003 Debye | 0.0003 Debye |
| Point Group | D3h | CS | CS |
| Job cpu time | 0 days 0 hours 0 minutes 5.0 seconds | 0 days 0 hours 0 minutes 15.0 seconds | 0 days 0 hours 0 minutes 7.0 seconds |
Final sets of forces and displacements for (A)
         Item               Value     Threshold  Converged?
 Maximum Force            0.000010     0.000450     YES
 RMS     Force            0.000005     0.000300     YES
 Maximum Displacement     0.000038     0.001800     YES
 RMS     Displacement     0.000019     0.001200     YES
 Predicted change in Energy=-5.368813D-10
 Optimization completed.
    -- Stationary point found.
Final sets of forces and displacements for (B)
  Item               Value     Threshold  Converged?
 Maximum Force            0.000189     0.000450     YES
 RMS     Force            0.000082     0.000300     YES
 Maximum Displacement     0.000784     0.001800     YES
 RMS     Displacement     0.000317     0.001200     YES
 Predicted change in Energy=-1.380433D-07
 Optimization completed.
    -- Stationary point found.
Final sets of forces and displacements for (B)(int=ultrafine scf(conver=9))
 Item               Value     Threshold  Converged?
 Maximum Force            0.000207     0.000450     YES
 RMS     Force            0.000100     0.000300     YES
 Maximum Displacement     0.000753     0.001800     YES
 RMS     Displacement     0.000403     0.001200     YES
 Predicted change in Energy=-1.411213D-07
 Optimization completed.
    -- Stationary point found.
Frequencies for (A)
Low frequencies --- -3.5991 -1.1355 -0.0054 1.3745 9.7046 9.7707
Low frequencies --- 1162.9825 1213.1733 1213.1760
Frequencies for (B)
Low frequencies --- -0.0008 -0.0004 0.0008 33.8606 41.5990 43.7038
Low frequencies --- 1163.5023 1213.4686 1213.5878
Frequencies for (B)(int=ultrafine scf(conver=9))
Low frequencies --- -0.0008 -0.0004 0.0009 28.8837 40.2093 44.9269
Low frequencies --- 1163.4954 1213.3988 1213.6046
Frequency analysis was performed on (A) and (B). The RMS gradient norm is <0.001 and close to 0 for all and all the calculations converged. Although we were instructed to work with (B), which has it's bond lengths modified, frequency analysis indicated that the low frequencies fall out of the required range of +/- 15cm-1. This is observed even after using the keyword 'int=ultrafine scf(conver=9)' and checking the box for tight convergence criteria. As a result, the remaining analysis data were taken from (A) as advised by the demonstrator. It can be observed that the calculated energy, dipole moment and point group are identical to the one calculated before, indicating that the same molecule was used.
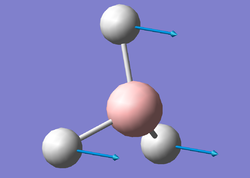
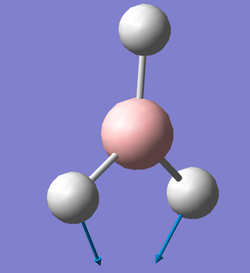
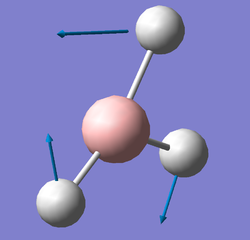
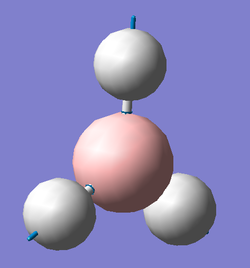
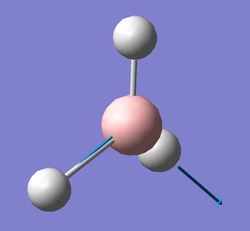
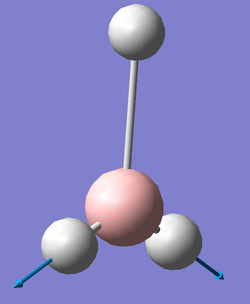
Table of vibrations
IR spectrum
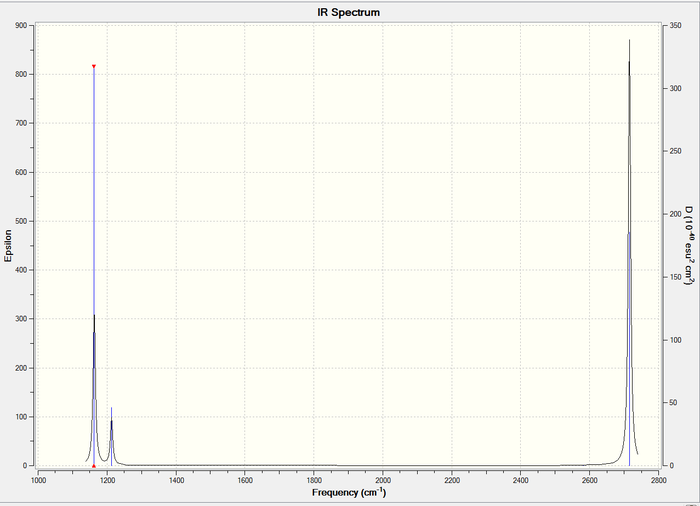
Figure 1: IR spectrum of BH3
For the BH3 molecule, there are a total of 3N-6 = 6, where N = 4, vibration modes observed as seen in the Table above. However, the IR spectrum only shows 3 peaks. This is due to two reasons. Firstly, vibration mode #4 is not observed as it does not result in a change in dipole moment. Hence the intensity as seen in Table 2 is 0.0000. Vibrational modes #2 and #3 have the frequency value of 1213cm-1. As a result, the individual peaks will overlap to give a single peak. This is similarly observed for vibrational modes #5 and #6, in which both have a frequency of 2716cm-1. Hence, only 3 peaks will be observed in the IR spectrum.
Frequency analysis for GaBr3
DOI file
DOI:10042/26117
Summary of results
GaBr3 frequency analysis
| File Type | .log |
|---|---|
| Calculation Type | FREQ |
| Calculation Method | RB3LYP |
| Basis Set | LANL2DZ |
| Charge | 0 |
| Spin | Singlet |
| E(RB3LYP) | -41.70082783 a.u. |
| RMS Gradient Norm | 0.00000011 a.u. |
| Dipole Moment | 0.0000 Debye |
| Point Group | D3h |
| Job cpu time | 0 days 0 hours 0 minutes 16.3 seconds |
Final sets of forces and displacements
 Item               Value     Threshold  Converged?
 Maximum Force            0.000000     0.000450     YES
 RMS     Force            0.000000     0.000300     YES
 Maximum Displacement     0.000002     0.001800     YES
 RMS     Displacement     0.000001     0.001200     YES
 Predicted change in Energy=-6.142862D-13
 Optimization completed.
    -- Stationary point found.
Frequencies
Low frequencies --- -0.5252 -0.5247 -0.0024 -0.0010 0.0235 1.2010
Low frequencies --- 76.3744 76.3753 99.6982
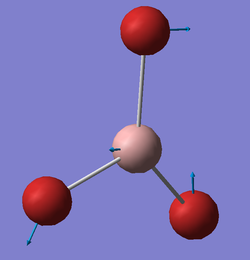
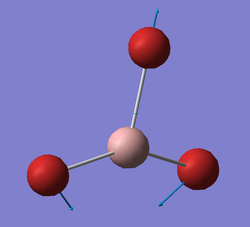
Table of vibrations
IR spectrum
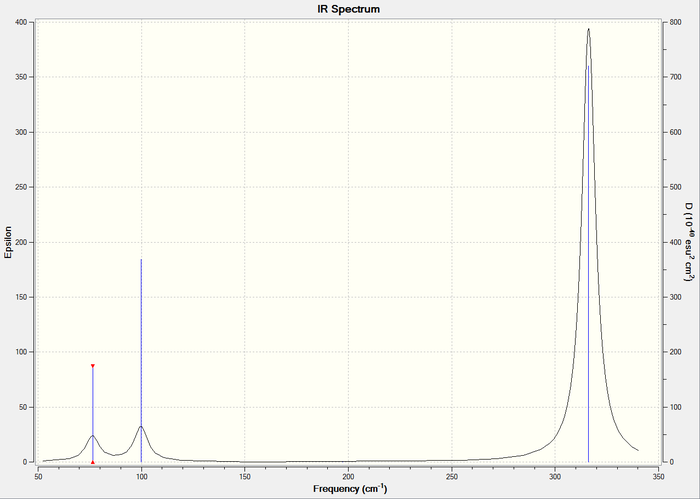
Figure 2: IR spectrum of GaBr3
Frequency analysis was performed on GaBr3 using the pseudo-potential LANL2DZ. The RMS gradient norm is <0.001 and close to 0 for both. In addition, the calculation converged. Looking at the energy, dipole moment and point group, they are identical to the ones calculated above, indicating that the same molecule was used. The 6 low frequencies (first line) are also within the required range of +/-15cm-1, hence there is accuracy in the calculation. The lowest 'real' vibrational mode is 76cm-1 and it is when the molecule is in bending modes as shown in the table above.
Frequency analysis comparison between BH3 and GaBr3
Table of vibrational modes of BH3 and GaBr3
| Molecules | Vibrations(cm-1) /Symmetry | Vibrations(cm-1) /Symmetry | Vibrations(cm-1) /Symmetry | Vibrations(cm-1) /Symmetry | Vibrations(cm-1) /Symmetry | Vibrations(cm-1) /Symmetry |
|---|---|---|---|---|---|---|
| BH3 | 1163/ A2" | 1213/ E' | 1213/ E' | 2582/ A1' | 2716/ E' | 2716/ E' |
| GaBr3 | 76/ E' | 76/ E' | 100/ A2" | 197/ A1' | 316/ E' | 316/ E' |
The vibrational frequencies are inversely proportional to the reduced mass and proportional to the force constant of the bond. The large difference in the value of frequencies for BH3 compared to GaBr3 indicate two things: GaBr3 has a larger reduced mass than BH3 and the Ga-Br bond is weaker than B-H bond. This is expected as Ga and Br are much heavier atoms than B and H. In addition, the Ga-Br bond has been calculated and explained to be significantly longer than the B-H bond as mentioned above. Hence, the vibrational frequencies of GaBr3 are expected to be much smaller than those of BH3.
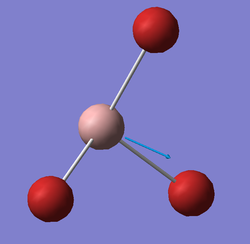
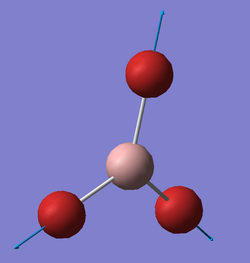
Both molecules have a total of 3N-6=6, where N=4, vibrational modes. However, there has been a reordering of the modes as the lowest real mode for BH3 is at 1163cm-1 with a A2" symmetry while the same symmetry for GaBr3 comes after 2 E' symmetry vibrational modes. For BH3, it involves the movement of 3 light H atoms in and out of the plane as the B atom moves in opposite direction while for GaBr3 it involves movement of the Ga atom in and out of the plane, in opposite direction to the movement of the Br atoms. Since the Ga and Br are heavier atoms, more energy will be required. Hence the frequency is shifted higher.
Both IR spectra are similar in that they only show 3 peaks despite each molecule having 6 vibrational modes. This is because both molecules have a single vibrational mode that does not result in a change in dipole moment, and hence will not be shown on the IR spectrum. In addition, there are 2 pairs of degenerate vibrational modes for each molecule, causing an overlap of the peaks and resulting in only 3 peaks shown in the spectra. It should also be noted that the peaks for BH3 are of a greater intensity than those of GaBr3. This is a result of greater change in dipole moment during the stretching and bending of BH3 than GaBr3.
In both spectra, it has been observed that two modes lie fairly closely together, the A2" and E' modes. This is also seen for the A1' and E' modes, but higher in energy. This is because the A1' and E' modes are classified as stretching modes while the A2" and E' are classified as bending modes. The A1' and E; modes require a change in bond length during the stretching, which will result in more energy required. This is because when the bond is stretched, there is deviation from the equilibrium length. When the atoms are too close there will be a repulsion force which needs more energy to overcome during stretching. However, for the A2" and E' modes, bending does not require a change in bond length. The repulsion when the atoms are close in proximity is also lower. Hence, less energy is required.
The same method and basis set for both the optimisation and frequency analysis calculations are used as as a change in the method and basis set will produce different results. The basis sets indicate the level of calculations used for the molecules, and there can be no basis of comparison if different method and basis sets were used for the 2 molecules. This is because their calculations will have different degree of accuracies. This is observed when comparing the energies obtained from optimising BH3 using 3-21G and 6-31G(d,p)basis sets. The one obtained using 6-31G(d,p) is more accurate.
A frequency analysis produces frequencies which are second derivatives of the potential energy surface. Hence, a positive frequency indicates a minimum while a negative frequency indicates a maximum. As a result, in order to ensure that the energies obtained are minimum, we require a frequency analysis and ensure that the values of the frequencies are all positive when calculated. This will indicate that the structure used for calculation is at its ground state. Similarly, it gives us an indication if the optimisation has failed. This will be observed when a negative frequency is obtained.
Each non-linear molecule has 3N-6 vibrational modes. The 'low frequencies' represent the 6 vibrational modes that are subtracted in the equation. They are small and not counted as part of the vibrational modes as they are simply motions caused by the the centre of mass of the molecule.
Molecular Orbitals of BH3
DOI file
DOI:10042/26123
Summary of results
BH3 MO analysis
| File Type | .log |
|---|---|
| Calculation Type | SP |
| Calculation Method | RB3LYP |
| Basis Set | 6-31G(d,p) |
| Charge | 0 |
| Spin | Singlet |
| E(RB3LYP) | -26.61532363 a.u. |
| Dipole Moment | 0.0000 Debye |
| Point Group | D3h |
| Job cpu time | 0 days 0 hours 1 minutes 33.8 seconds |
MO diagram of BH3
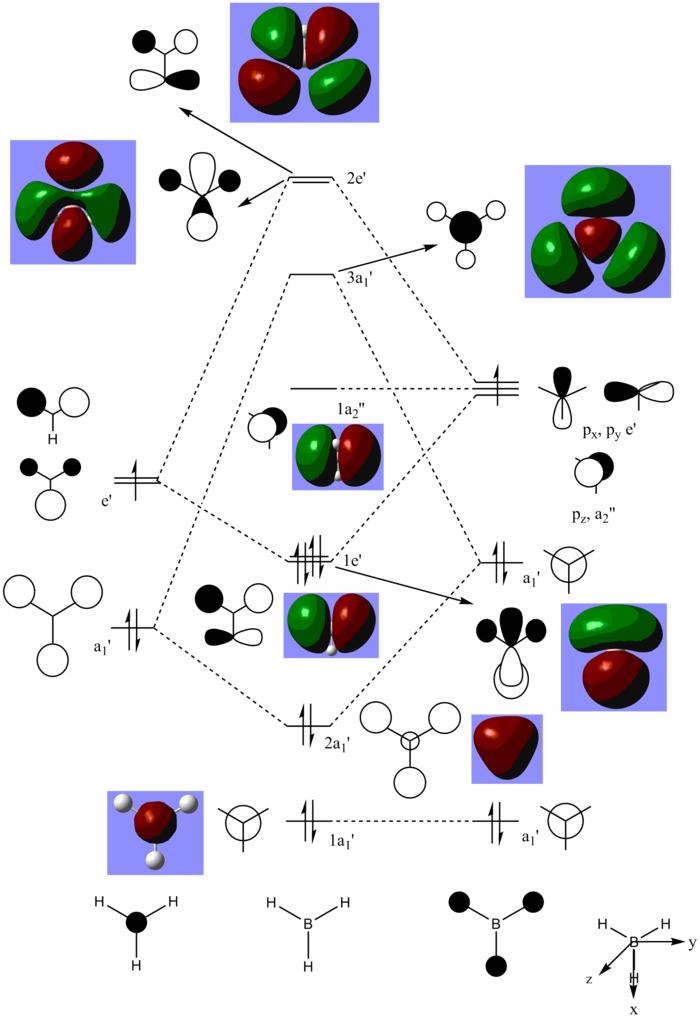
Figure 3: MO diagram of BH3
Referring to the MO diagram above, there are no significant differences between the real and LCAO MOs. The drawn LCAO MOs are similar to the real MOs produced as BH3 is a simple molecule with with a straightforward MO diagram. This indicates that qualitative MO theory are sufficiently accurate and useful to show the molecular orbitals of molecules and the distribution of their electron density. However, one has to put caution to such a statement as when the complexity of the molecule increases and mixing occurs between MOs, the qualitative MO theory may fail to provide an accurate view of the MOs.
NBO Analysis of NH3
Log files
[| 6-31G(d,p) .log file for NH3]
[| Frequency analysis file for NH3]
[| Population analysis file for NH3]
Summary of results
| Calculation | Optimisation using 6-31G(d,p) | Frequency Analysis | Population Analysis |
|---|---|---|---|
| File Type | .log | .log | .log |
| Calculation Type | FOPT | FREQ | SP |
| Calculation Method | RB3LYP | RB3LYP | RB3LYP |
| Basis Set | 6-31G(d,p) | 6-31G(d,p) | 6-31G(d,p) |
| Charge | 0 | 0 | 0 |
| Spin | Singlet | Singlet | Singlet |
| E(RB3LYP) | -56.55776872 a.u. | -56.55776872 a.u. | -56.55776872 a.u. |
| RMS Gradient Norm | 0.00000137 a.u. | 0.00000150 a.u. | - |
| Dipole Moment | 1.8465 Debye | 1.8465 Debye | 1.8465 Debye |
| Point Group | C1 | C1 | C1 |
| Job cpu time | 0 days 0 hours 0 minutes 12.0 seconds | 0 days 0 hours 0 minutes 9.0 seconds | 0 days 0 hours 0 minutes 34.3 seconds |
Final sets of forces and displacements for optimisation of NH3 using 6-31G(d,p)
Item               Value     Threshold  Converged?
 Maximum Force            0.000004     0.000015     YES
 RMS     Force            0.000002     0.000010     YES
 Maximum Displacement     0.000008     0.000060     YES
 RMS     Displacement     0.000004     0.000040     YES
 Predicted change in Energy=-1.785252D-11
 Optimization completed.
    -- Stationary point found.
Final sets of forces and displacements for frequency analysis of NH3
 Item               Value     Threshold  Converged?
 Maximum Force            0.000003     0.000450     YES
 RMS     Force            0.000001     0.000300     YES
 Maximum Displacement     0.000008     0.001800     YES
 RMS     Displacement     0.000003     0.001200     YES
 Predicted change in Energy=-2.196442D-11
 Optimization completed.
    -- Stationary point found.
Frequencies
Low frequencies --- -9.3870 -8.2244 -6.1051 -0.0017 -0.0015 -0.0006
Low frequencies --- 1089.3360 1693.9207 1693.9250
Although the basis set 6-31G(d,p) was used, the point group calculated was C1 instead of the expected C3V. This implies that better basis set is still required to ensure greater accuracy in the calculation. In addition, the keyword 'int=9 scf(conver=9)' was used and tight convergence criteria was chosen in order to ensure that the calculations will converge. The RMS gradient norm is <0.001 and close to 0 for both. The energy is calculated to be -56.55776872 a.u. and the dipole moment is calculated to be 1.8465D for the optimisation and the frequency analysis, indicating that the same molecule was used. The low frequencies calculated are also within the required range of +/-15cm-1. The calculated bond length of 1.02Å is similar to the reported value of 1.012Å[1].
Charge Distribution

Figure 4: Charge distribution in NH3 by colour

Figure 5: Labelled charge distribution in NH3
The charge range for NH3 is -1.125 to 1.125. Referring to Figure 4, it can be seen that the N atom is negatively charged while the H atoms are positively charged. This is expected as N is more electronegative than H. Figure 5 shows the actual charge values for each atom, -1.125 for N and 0.375 for H. By summing up the charges, we will get a value of 0, which is expected as NH3 is a neutral molecule. Hence, this indicates accuracy in the calculations.
Association energies: Ammonia-Borane
[| 3-21G file for NH3BH3]
[| 6-31G(d,p) .log file for NH3BH3]
[| Frequency analysis file for NH3BH3]
Summary of results
| Calculation | 3-21G | 6-31G(d,p) | Frequency Analysis using 6-31G(d,p) |
|---|---|---|---|
| File Type | .log | .log | .log |
| Calculation Type | FOPT | FOPT | FREQ |
| Calculation Method | RB3LYP | RB3LYP | RB3LYP |
| Basis Set | 3-21G | 6-31G(d,p) | 6-31G(d,p) |
| Charge | 0 | 0 | 0 |
| Spin | Singlet | Singlet | Singlet |
| E(RB3LYP) | -82.76661835 a.u. | -83.22468905 a.u. | -83.22468909 a.u. |
| RMS Gradient Norm | 0.00003005 a.u. | 0.00000289 a.u. | 0.00000475 a.u. |
| Dipole Moment | 5.8431 Debye | 5.5645 Debye | 5.5645 Debye |
| Point Group | C1 | C1 | C1 |
| Job cpu time | 0 days 0 hours 0 minutes 21.0 seconds | 0 days 0 hours 0 minutes 33.0 seconds | 0 days 0 hours 0 minutes 33.0 seconds |
Final sets of forces and displacements for optimisation of NH3BH3 using 3-21G
 Item               Value     Threshold  Converged?
 Maximum Force            0.000094     0.000450     YES
 RMS     Force            0.000030     0.000300     YES
 Maximum Displacement     0.000419     0.001800     YES
 RMS     Displacement     0.000179     0.001200     YES
 Predicted change in Energy=-5.743898D-08
 Optimization completed.
    -- Stationary point found.
Final sets of forces and displacements for optimisation of NH3BH3 using 6-31G(d,p)
         Item               Value     Threshold  Converged?
 Maximum Force            0.000003     0.000015     YES
 RMS     Force            0.000001     0.000010     YES
 Maximum Displacement     0.000036     0.000060     YES
 RMS     Displacement     0.000012     0.000040     YES
 Predicted change in Energy=-3.124960D-10
 Optimization completed.
    -- Stationary point found.
Final sets of forces and displacements for frequency analysis of NH3BH3
Item               Value     Threshold  Converged?
 Maximum Force            0.000012     0.000450     YES
 RMS     Force            0.000003     0.000300     YES
 Maximum Displacement     0.000041     0.001800     YES
 RMS     Displacement     0.000021     0.001200     YES
 Predicted change in Energy=-3.152412D-10
 Optimization completed.
    -- Stationary point found.
Frequencies
Low frequencies --- -4.9288 -0.0014 -0.0011 -0.0008 2.1989 3.1957
Low frequencies --- 263.3470 632.9566 638.4182
Optimisation was first performed using the basis set 3-21G before using the 6-31G(d,p) basis set on the optimised file as NH3BH3 is not a small molecule. The optimised calculation using the 6-31G(d,p) set was done using the keyword 'int=9 scf(conver=9)' and tight convergence criteria was chosen. This was required in order to obtain low frequencies values that are within the +/-15cm-1 range when frequency analysis was performed. The difference in energies obtained for the 6-31G(d,p) calculation and frequency analysis is negligible.
Bond lengths and angles
| Method/Basis set | DFT RB3LYP/6-31G(d,p) (Computed) | HF/ 6-31G (Literature[2]) |
|---|---|---|
| B-N bond length/Å | 1.67 | 1.69 |
| B-H bond length/Å | 1.21 | 1.21 |
| N-H bond length/Å | 1.02 | 1.00 |
| N-B-H angle/o | 104.6 | 104.3 |
| B-N-H angle/o | 111.0 | 110.9 |
By comparing the calculated values with the reported values, it can be seen that although the method is different but the basis set is the same, the bond lengths and angles are still close. Hence, the calculations can be predicted to be accurate.
Association & Dissociation Energies
E(NH3)= -56.55776872 a.u.
E(BH3)= -26.61532363 a.u.
E(NH3BH3)= -83.22468905 a.u.
ΔE=E(NH3BH3)-[E(NH3)+E(BH3)] = -83.22468905 a.u. -(-56.55776872 a.u.-26.61532363 a.u.) = -0.0515967 a.u. = -135.4671462kJ/mol
Hence, the dissociation energy is 135kJ/mol.
Comparision of energies
| Compounds | DFT RB3LYP/6-31G(d,p) (Computed)/a.u. | HF/ 6-31G (Literature[2])/a.u. |
|---|---|---|
| BH3 | -26.61532363 | -26.39001 |
| NH3 | -56.55776872 | -56.18436 |
| NH3BH3 | -83.22468905 | -82.61182 |
Using literature values,
ΔE=E(NH3BH3)-[E(NH3)+E(BH3)] = -82.61182 a.u. -(-56.18436 a.u.-26.39001 a.u.) = -0.03745 a.u. = -98.3249825kJ/mol
Hence the literature dissociation energy is 98.3kJ/mol.
It can be observed that there is a deviation of the bond dissociation energy from the literature values. This is because the method used is Hartree-Fock instead of DFT so there is no proper basis for comparison. The use of different methods and basis sets will lead to different computational methods and accuracies, and all these small differences can sum up to a big difference in the final values. The calculations can be repeated to check for accuracy.
Conclusion
In conclusion, the calculations above indicated that using the better basis set, such as 6-31G(d,p) instead of 3-21G will give more accurate results. When frequency analysis was performed, steps were taken to ensure that all the low frequencies values were within the required range of +/-15cm-1. Comparisons between calculated results were made based on those produced from the same method and basis set in order to ensure accuracy. The energies were checked to ensure that further calculations made were based on the optimised structure found using the 6-31G(d,p) basis set.

