Rep:Mod:qws123zdr
Modelling MgO 3rd Year Computational Lab


Calculating the phonon modes of MgO
A k point in k space refers to a particular vibrational phase pattern between cells.
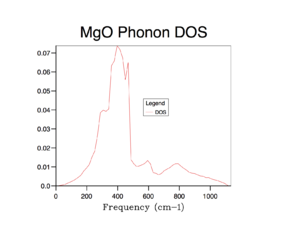
The DOS curves and phonon dispersion curves computed are inherently related because the DOS curves computed (with varying grid sizes) take into account k points from
Using the 1x1x1 grid, we compute the density of states for one k point (as seen in LogFile). On the DOS curve for the 1x1x1 grid, we can see that there are peaks at frequencies: 288 cm-1, 288 cm-1, 352 cm-1, 352 cm-1, 676 cm-1 and 819 cm-1(as seen from Log File). By comparing this data to the phonon dispersion curve, we can see that these are the same frequencies associated with point L. We can also look at the log file to check.
We see that the peaks at 290 cm-1 and 350 cm-1 are double the height of the peaks at 680 cm-1 and 810 cm-1. This is because there are twice as many states associated with each of the first two vibrational energy levels (at 290 cm-1 and 350 cm-1) than there are at the latter two energy levels (at 680 cm-1 and 810 cm-1). We can also understand this by analysing the phonon dispersion curve. We can see that over the entire graph, there are 6 branches (this is because we are considered a motif of two atoms- Mg and O - each of which can move in 3 dimensions in real space). At point L, two branches overlap at 290 cm-1 and two branches overlap at 350 cm-1 - i.e. at these two frequencies, we have two degenerate states. Thus there are twice as many vibrational states at these frequencies and this is why the peaks in the DOS curve for these frequencies are twice the size.
As the grid size increases, we take more and more k points into consideration in our DOS curve. For a 2x2x2 grid, we would consider 8 points - however due to symmetry, we have two sets of 3 degenerate points and thus overall for the 2x2x2 grid, we consider 4 distinct k points (which is what we see from the Log File). The DOS curves for all 4 single k points are determined and overlapped to give the DOS curve for the 2x2x2 grid.
Thus, in general, more and more k points are taken into account in the DOS curve as the grid size increases. This has two main effects on the DOS curve:
1) Shape: As more and more k points are considered, the DOS curve becomes more and more curved and starts to resemble what we might consider the shape of an ideal DOS curve (if we took an infinite k points into account). We see that as we increase the grid size, more vibrations are sampled and more features appear. It is difficult to say exactly which grid size gives a reasonable approximation for the density of states as this will be subjective (when you think the curve resembles density of states closely enough) and what sort of approximation is required. However, in this author's opinion, the DOS curve with a minimum grid size of the 16x16x16 grid gives a reasonable approximation of the DOS curve. DOS curves with lower grid sizes (e.g. 8x8x8) still has a very jagged curve and does not truly full resemble the shape of the density of states. DOS curves with larger grid sizes (e.g. 32x32x32) of course are smoother and represent the shape of the density of states even better - but the improvement compared to the DOS curve with grid size 16x16x16 is not very great. Thus, overall, the grid size of 16x16x16 can be taken as a reasonable approximation of the density of states.
2) Area underneath the graph: The integral of the entire DOS curve should give us the total number of vibrational states associated with all the k points considered for that DOS curve. As mentioned before, we expect 6 vibrational states to be associated with every k point considered. Thus we would expect 6 vibrational states to be considered for the DOS curve with grid size 1x1x1 and 24 (6 branches x 4 distinct k points) vibrational states to be considered for the DOS curve with grid size 2x2x2 and so forth.
Computing the Free Energy - The harmonic approximation
Temperature: 300K.
| Integer Shrinking Factor (Grid Size) | Helmholtz Free-Energy (F) / eV | Helmholtz Free-Energy (F) / kJ/mol | Total CPU time / s |
|---|---|---|---|
| 1 | -40.930301 | -3949.148006 | 0.0025 |
| 2 | -40.926609 | -3948.791810 | 0.0034 |
| 3 | -40.926432 | -3948.776713 | 0.0076 |
| 4 | -40.926450 | -3948.776419 | 0.0107 |
| 8 | -40.926478 | -3948.779123 | 0.0818 |
| 16 | -40.926482 | -3948.779580 | 0.7564 |
| 32 | -40.926483 | -3948.779641 | 11.5999 |
| 64 | -40.926483 | -3948.779648 | 449.8641 |
For calculations accurate to:
1meV (0.001eV): A grid size of 2x2x2 is appropriate. 0.5meV (0.0005eV): A grid size of 2x2x2 is appropriate. ????? 0.1meV (0.0001eV): A grid size of 3x3x3 is appropriate.
| Integer Shrinking Factor (Grid Size) | Helmholtz Free-Energy (F) / eV | ΔF / eV |
|---|---|---|
| 2 | -40.926609 | |
| 4 | -40.926450 | -1.59 x 10⁻⁴ |
| 8 | -40.926478 | -0.28 x 10⁻⁴ |
| 16 | -40.926482 | -0.04 x 10⁻⁴ |
| 32 | -40.926483 | -0.01 x 10⁻⁴ |
| 64 | -40.926483 | -0.00 x 10⁻⁴ |
| Integer Shrinking Factor (Grid Size) | Helmholtz Free-Energy (F) / eV | ΔF / eV |
|---|---|---|
| 2 | -40.926609 | |
| 4 | -40.926450 | -1.59 x 10⁻⁴ / -2 x 10⁻⁴ |
| 8 | -40.926478 | -2.8 x 10⁻⁵ / |
| 16 | -40.926482 | |
| 32 | -40.926483 | |
| 64 | -40.926483 |
