Rep:Mod:qwertyuiop2
Bonding (Ab initio and density functional molecular orbital)
Inorganic CompChem Experiments
Understanding Optimisations
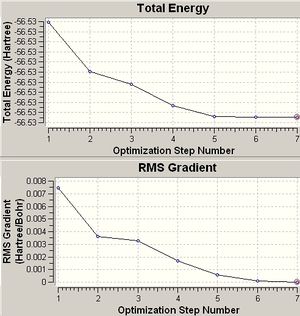
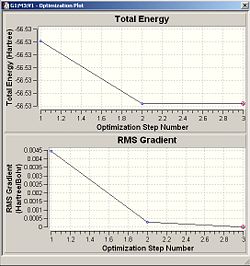
When an optimisation is performed to find the optimum positions for the molecule. Inside Results--->Optimisation, two graphs are displayed showing the total energy of the molecule and the RMS Gradient curve. The RMS Gradient curve shows the first derivative of the total energy with respect to the distance between atoms. The optimisation is designed to find the minimum energy , i.e. it finds the structure/distances that make the RMS gradient equal 0, where the gradient is the rate of change of energy/HF with respect to distance/Bohr.
Definition of a "Bond"
Gaussview draws a bond between atoms based on the limits from actual molecule data, which is programmed into the application. A bond is a localisation of electrons that interact with the protons and neutrons which they are between. E.g. when the two atoms are forced apart from equilibrium, the electrons become more delocalised and the interactions between the electrons and protons/neutron become weaker.
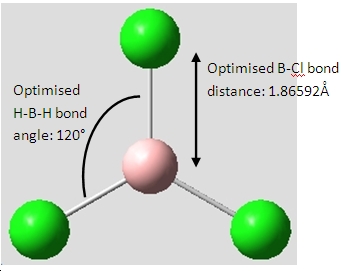
Boron Trichloride, BCl3
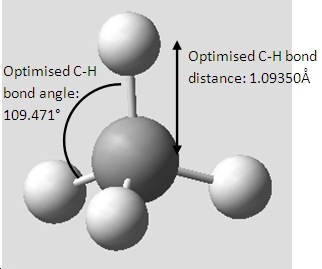
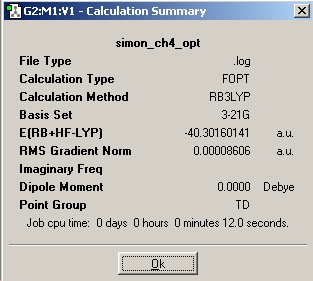
Methane, CH4
Xyz coordinates:-----------------------------------------------------
Center     Atomic     Atomic              Coordinates (Angstroms)
Number     Number      Type              X           Y           Z
---------------------------------------------------------------------
   1          6             0        0.000000    0.000000    0.000000
   2          1             0        0.631331    0.631331    0.631331
   3          1             0       -0.631331   -0.631331    0.631331
   4          1             0       -0.631331    0.631331   -0.631331
   5          1             0        0.631331   -0.631331   -0.631331
---------------------------------------------------------------------
Published CH4 optimisation: DOI:10042/to-1022
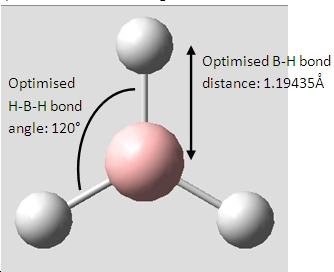
Borane, BH3
Vibrational Analysis of BH3
BH3 Vibrational Spectrum
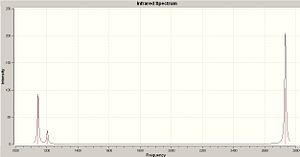
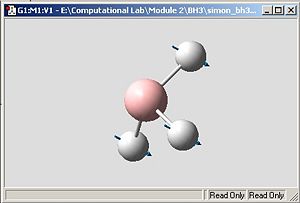
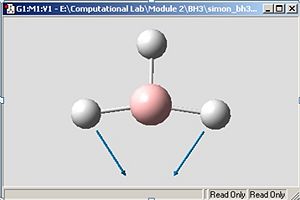
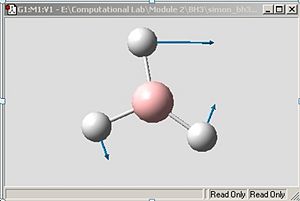
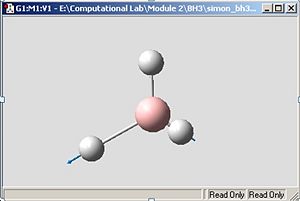
Whilst there are six vibrations in a BH3 molecule, only 3 peaks are visible on the IR spectrum. The peak that is not visible is frequency 2592.79cm-1 because the intensity of it is zero. Frequencies 1204.66cm-1 and 2731.31cm-1 have two associated degenerate vibrations therefore the intensity value stacks, i.e. the intensity of the peak on the spectrum at 2731.31cm-1 is two times 103.83cm-1, which is the intensity of one peak.
BH3 Molecular Orbital Diagram
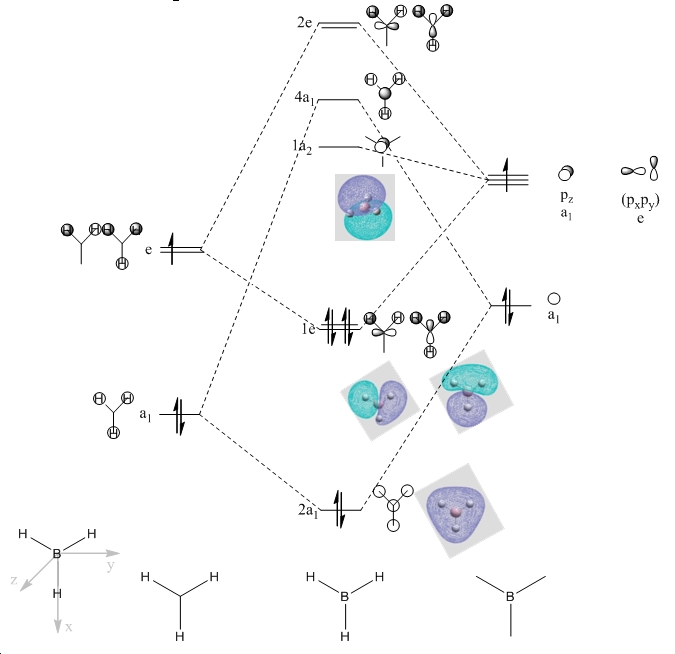
The phases in the qualitative and quantitative molecular orbitals match each other suggesting that the qualitative MO theory is useful for predicting the energies of the MOs relative to one another for simple molecules. The expected weakness with qualitative MO theory is the inability to accurately determine how unstabilised and stabilised the antibonding and bonding orbitals are. This problem is helpfully worked around by computational programs which can determine the relative energies of the orbitals.
Ammonia, NH3
B3LYP Method with 6-31G Basis Set
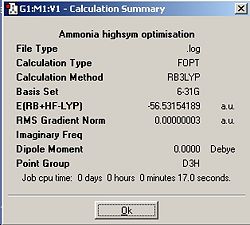
During an optimisation , when the atoms in the molecule are moved, the program will try to always maintain the symmetry of the molecule. The most symmetrical molecule, D3h, took the shortest time to optimise because the program does not have as many different choices for moving the atoms because any movement would need to conserve D3h symmetry. The most asymmetric molecule, C1, took the longest time to optimise because the “ignore symmetry” box was ticked therefore allowing any form of movement for the atoms (even if it breaks the symmetry) therefore there are more calculations that can be run. As there were more possible calculations, there are more intermediate geometries. Overall, the general trend is, the more symmetrical the molecule is, the faster the optimisation will be.
The general trend in total energy is the more symmetrical the molecule is, the higher its energy. The lowest energy geometry was the C1 ammonia structure. The energy difference between the C1 point group and the C3v and D3h point groups are 4.52x10⁻³kJmol-1 and 0.908kJmol-1 respectively. The energy difference between the D3h and C3v point groups come from their difference in symmetry. Second order Jahn-Teller effects stabilise the most symmetric point group, D3h, by breaking its symmetry via an umbrella motion of the hydrogens converting into a C3v, which essentially allows ground state and excited state molecular orbitals to mix thus altering the optimised geometry (see bond lengths and bond angles) and lowering the total energy. This can be visulised on a potential energy surface with the D3h point group as a saddle point and the C3v point group as the minimum at a lower energy. The energy difference between C1 and C3v is very small because the only difference made at the start was altering one bond length by a small amount therefore the geometries are still quite similar (see similiar bond lengths and bond angles). This lowering in energy, when going from higher to lower symmetry, can also be explained by the second order Jahn-Teller effect. To conclude, the second order Jahn-Teller effect lowers the energy of a higher symmetry molecule by distorting its geometry to a lower symmetry [1].
MP2 Method with 6-311+G(d,p) Basis Set
| C3v | D3h | |
|---|---|---|
| Calculation Summary | 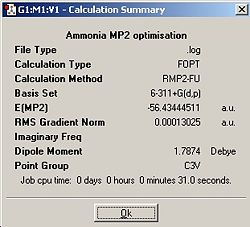
|

|
| Optimisation Curves | 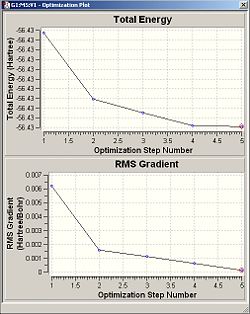
|

|
| Optimised Bond Lengths/Å | 1.01287 | 0.99862 |
| Optimised Bond Angles/° | 107.453 | 120 |
| Optimised Energy/kJmol-1 | -148,165.133 | -148,144.665 |
The calculations for both point groups using the MP2 method and 6-311+G(d,p) basis set took longer than previously when using the B3LYP method because the program refines the optimisation more, producing a more accurate representation of an ammonia molecule.
The barrier height of the inversion, i.e. the energy required to reach the D3h inversion transition state, is 20.468kJmol-1 compared to 0.908kJmol-1, which was calculated using the B3LYP method. ΔE has changed significantly after using the higher level MP2 method. The value calculated using the MP2 method is much closer to the experimentally determined energy difference of 24.3kJmol-1. This proves that the whilst the MP2 method used more processing power and took longer to run, the result is much closer to the experimental value therefore running the calculation was worthwhile.
The thermal energy at room temperature is 2.479kJmol-1 which was calculated from E=RT where T=298.15K. The energy required to invert an ammonia molecule is much larger than the amount of thermal energy at room temperature but ammonia is known to rapidly invert at room temperature. Classically, an ammonia atom is not expected to invert at room temperature but with quantum mechanics the inverting can occur without the required energy via quantum tunnelling of the hydrogens.
Vibrational Analysis of NH3 C3v
Vibrational Analysis of NH3 D3h
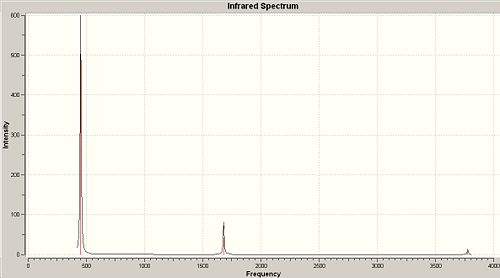
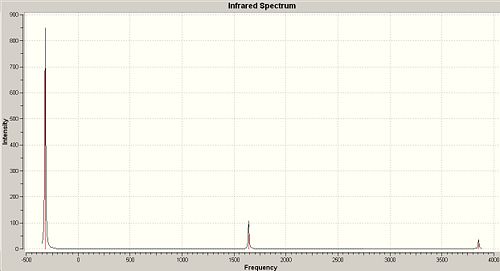
NH3 Vibrational Spectra
NH3 C3v Vibrational Spectrum on left
NH3 D3h Vibrational Spectrum on right
None of the C3v frequencies are negative. Out of the six vibrations in the D3h frequencies, the vibration at -318.051cm-1 is negative. Vibrations numbers 4, 5 and 6 are present in both point groups.
| Frequency/cm-1 | Literature Frequency/cm-1[2] |
|---|---|
| 452.301 | 932 |
| 1680.47 | 1626 |
| 1680.47 | 1626 |
| 3575.43 | 3337 |
| 3775.76 | 3444 |
| 3775.76 | 3444 |
Considering that the computed frequencies were based on a model of ammonia, they match the literature quite well apart from the lowest frequency value. The computation gives a frequency which is at a lower energy than the literature value frequency, which is concordant with the smaller value in the energy required to invert an ammonia atom calculated. Therefore the same reason can be used to explain why the computed frequency was unexpectly low with respect to literature, which was quantum tunnelling affects the umbrella inversion path(which is the motion for this frequency.
Vibration 1 in both point groups follow the inversion reaction path, as this is the only vibration which causes the molecules to appear the same as they should from the Scan Inversion Mechanism.
Cis and Trans Isomers of Mo(CO)4(PMe3)2
| Molecule | Cis-Mo(CO)4(PMe3)2 | Trans-Mo(CO)4(PMe3)2 | ||||||
|---|---|---|---|---|---|---|---|---|
| Jmol | Optimised cis-isomer: DOI:10042/to-1045
|
Optimised trans-isomer: DOI:10042/to-1038
| ||||||
| Labelled Atoms | 
|

| ||||||
| IR Spectrum | DOI:10042/to-1047 | DOI:10042/to-1048 | ||||||
| Total Energy/kJmol-1 | -2030614.9040 | -2030618.0147 |
Geometry Parameters and Analysis
Cis-Mo(CO)4(PMe3)2
| Computed values | Literature values[3] | |
|---|---|---|
| Mo-P(5) bond length | 2.58897 Å | 2.522 Å |
| Mo-P(10) bond length | 2.58881 Å | 2.522 Å |
| Mo-C(14) bond length | 1.99375 Å | 1.966 Å |
| Mo-C(13) bond length | 2.03200 Å | 2.022 Å |
| Mo-C(15) bond length | 1.99374 Å | 1.975 Å |
| Mo-C(8) bond length | 2.03199 Å | 2.042 Å |
| P(5)-Mo-P(10) bond angle | 93.985° | 97.54° |
The computed values are similar to the literature values therefore a B3LYP method with a LANL2MB basis set first then a LANL2DZ basis set reproduces the cis molybdenum isomer well. The computed Mo-C(14) and Mo-C(15) bond lengths (the bonds trans to the phosphines) are shorter than the other Mo-C bonds, matching the pattern observed in the literature values.
The tabulated calculations above are from the complex where the dAOs have been considered. dAOs need to be considered because phosphorus has low-lying d-orbitals which are capable of interacting with Mo atomic orbitals producing back-bonding which will lower the bond length. As the bond length lowers, the P-Mo-P bond angle is also expected to become larger to avoid steric clashes, as the bond length becomes smaller. The Mo-C bonds are not expected to change much because carbon does not have any low-lying d-orbitals.
| With dAOs | Without dAOs | |
|---|---|---|
| Mo-P(5) bond length | 2.58897 Å | 2.64792Å |
| Mo-P(10) bond length | 2.58881 Å | 2.64790Å |
| P(5)-Mo-P(10) bond angle | 93.985° | 92.922° |
Optimised cis-isomer with no dAOs: DOI:10042/to-1046
As expected, the Mo-P bonds are shorter and the bond angle is wider with the dAOs being considered.
Trans-Mo(CO)4(PMe3)2
| Computed values | Literature values[4] | |
|---|---|---|
| Mo-P(5) bond length | 2.52421 Å | 2.500 Å |
| Mo-P(10) bond length | 2.52423 Å | 2.500 Å |
| Mo-C(14) bond length | 2.02924Å | 2.016 Å |
| Mo-C(13) bond length | 2.02837 Å | 2.0005 Å |
| Mo-C(15) bond length | 2.03046 Å | 2.016 Å |
| Mo-C(8) bond length | 2.03174 Å | 2.005 Å |
| P(5)-Mo-P(10) bond angle | 177.006° | 180.0° |
The literature data in the table above is actully from the crystal stucture of Trans-Mo(CO)4(PPh3)2 because the crystallography data for Trans-Mo(CO)4(PMe3)2 could not be found. Therefore, as a triphenylphosphine ligand is more sterically bulky than a trimethylphosphine ligand, the equatorial Mo-C bonds are expected to be shorter in Trans-Mo(CO)4(PPh3)2 in order for the carbonyl bonds to avoid steric clashing with the phenyl rings of the triphenylphosphine ligand.
The Mo-P bonds in the trans isomer are shorter than those in the cis isomer. In the cis isomer, the phosphine groups are close to each other therefore the complex would experience large, unfavourable steric interactions. In an attempt to reduce these unfavourble interactions, the Mo-P bonds are extended in order to move the phosphines further apart. In contrast to the cis isomer, where there were two distinct pairs of Mo-C bond lengths, the trans isomer's Mo-C bond lengths are all similar. This shorter cis Mo-C bond lengths are the bonds trans to the phosphines. This is likely due to the trans effect of a carbonyl ligand being greater than a phosphine ligand's trans effect, resulting in the carbonyl drawing more electron denstiy from the phosphine, shortening the Mo-C bond and elongating the Mo-P bond.
| With dAOs | Without dAOs | |
|---|---|---|
| Mo-P(5) bond length | 2.52421 Å | 2.57124Å |
| Mo-P(10) bond length | 2.52423 Å | 2.57096Å |
| P(5)-Mo-P(10) bond angle | 177.006° | 177.896° |
Optimised cis-isomer with no dAOs: DOI:10042/to-1051
With the addition of dAOs in the optimisation, the Mo-P bond lengths shortened, as expected. Minimal change in the bond angle is expected as the shortening of the bond length will not affect the steric interactions between the trans phosphine ligands.
Vibrational Analysis
With the vibrational analysis, observation of the carbonyl stretches will allow differentiation between cis and trans complexes. This is achieved by considering the pseudo-symmetry of the cis and trans complexes which are C2v and D4h respectively. There should be four different symmetries of vibrations in the cis complex but three in the trans complex.
| Cis-Mo(CO)4(PMe3)2 | Trans-Mo(CO)4(PMe3)2 | ||||||||||
|---|---|---|---|---|---|---|---|---|---|---|---|
| Number | Form of the Vibration | Frequency/cm-1 | Intensity | Literature Frequency/cm-1[5] | Symmetry, C2v Point Group | Form of the Vibration | Frequency/cm-1 | Intensity | Literature Frequency/cm-1[5] | Symmetry, D4h Point Group | |
| 78 |  |
1851.09 | 1953.69 | 1886.8 | B2 |  |
1843.42 | 1973.61 | 1885.4 | Eu | |
| 79 |  |
1856.56 | 1047.73 | 1898.5 | B1 |  |
1843.77 | 1978.38 | 1885.4 | Eu | |
| 80 |  |
1873.87 | 665.766 | 1913.7 | A1 |  |
1884.69 | 11.15 | 1933.9 | B1g | |
| 81 | 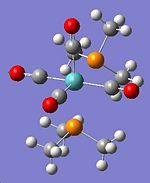 |
1959.97 | 369.602 | 2012.4 | A1 |  |
1956.17 | 4.3056 | 2050.4 | A1g | |
The Eu symmetry vibrations in the trans molybdenum complex have the same motion of atoms and a frequency difference of 0.35cm-1. The fact that gaussview sees the complex with a C1 symmetry point group, i.e. it takes the methyl group's atoms into consideration, results in the Eu symmetry vibrations not appearing degenerate. However, as the frequency difference is so low, it will be seen as degenerate. The difference between the all of the computed frequencies and the literature frequencies is generally about 30-50cm-1. However for vibration 81 in the trans isomer, the difference was almost 100cm-1.
Energy Comparisons
| Cis-Mo(CO)4(PMe3)2 | Trans-Mo(CO)4(PMe3)2 | |||
|---|---|---|---|---|
| Total Energy/au | Total Energy/kJmol-1 | Total Energy/au | Total Energy/kJmol-1 | |
| -773.43854665 | -2030614.9040 | -773.43973150 | -2030618.0147 | |
The trans isomer is lower in energy by 3.11kJmol-1 because it experiences less steric strain as the two large phosphine groups are apart from each other whereas in the cis complex they are not. According to literature[5], the trans isomer is the more thermodynamically stable, which matches the trend observed from the computations.
Mini-Project: Zirconocene Complexes
Introduction
The aim of this mini-project was to study zirconocene and the subsequent effects on the geometry and the charge distribution of the complex with the alteration of the ligands that attach to a equatorial binding plane.
Zirconocene
Optimisation Method
The optimisation of zirconocene was planned to involve a low optimisation using a B3LYP method and LANL2MB basis set and then with the LANL2DZ basis set.
- Initially, the optimisation was run on a pre-bent zirconocene to give an error about a failure to read the atomic coordinates which was fixed by going into the output file and deleting several lines of the output from the bottom of the text.
- When the low optimisation finished, the compound was resubmitted with a LANL2DZ basis set. The optimisation gave a zirconocene molecule with the rings eclipsed and with the forces not converged so this was clearly not the completely final structure.
- In an attempt to optimise the molecule, a dihedral angle between the Cp rings was fixed to 41.0° using the ModRedundant function in an optimisation, with the line of code used being: D 3 2 14 18 -41.000000 F. The reason for fixing the dihedral angle was to optimise the rest of the structure to hopefully take it away in the correct direction from a saddle point.
- After the optimisation containing the fixed dihedral angle finished, a staggered ring structure was produced. The dihedral angle from the staggered structure needed to be relieved so the line of code before was changed to D 3 2 14 18 -41.000000 A and then another optimisation was run. The final structure contained dihedral angles of 4.872° and the output file said that all forces and displacements had converged allowing the conclusion that the final optimised structure and the lowest energy structure of a zirconocene contains eclipsed Cp rings.
Optimised zirconocene: DOI:10042/to-1056
Jmol of optimised structure:
Pentahelicene |
Vibrational Analysis of Stagger Structure

The initial, staggered structure in the total energy and RMS curve looked as though it was a maximum and therefore it could be a transition state. A transition state gives one negative vibrational frequency in infrared specroscopy therefore to investigate this, a frequency calculation was performed.
The results of the frequency computation confirmed that the structure was in fact a transition state as there was one negative vibration at -41.1611cm-1.
Frequency calculation of transition state: DOI:10042/to-1057
When observing the optimisation "movie", the Cp looks as though it is rotating about the zirconium ion in the centre suggesting that the transition state is for the rotation of a Cp ring from an eclipsed to staggered to eclipsed structure (similar to the ammonia inversion).
Jmol of transition state structure:
Pentahelicene |
Energy Comparison between zirconocene and transition state
| Transition state | Optimised structure | |||
|---|---|---|---|---|
| Total Energy/au | Total Energy/kJmol-1 | Total Energy/au | Total Energy/kJmol-1 | |
| -433.57142510 | -1138314.87 | -433.56984729 | -1138310.73 | |
The optimised structure is more stable by 4.14kJmol-1 which not a very large amount considering that the thermal energy at room temperature is 2.478kJmol-1 (calculated from E=RT where T is 298.15K). As the boltzmann distribution specifies that there is always a range of energies across particles in a system, the probability that a molecule will have enough energy at room temperature is very low and not zero therefore the rotation of a Cp ring occurs very slowly at room temperature.
Molecular Orbitals of zirconocene
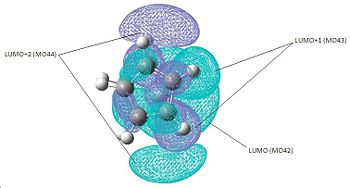
| HOMO (MO41) | LUMO (MO42) | LUMO+1 (MO43) | LUMO+2 (MO44) |
|---|---|---|---|

|

|

|

|
According to literature[6], there are three molecular orbitals in the equatorial ligand binding plane in bent metallocenes; for example in Cp2ZrCl2, there is still an empty orbital in the centre of the equatorial plane[7]. From the molecular orbitals, the first three unoccupied orbitals have orbitals present in the equatorial plane therefore confirming my structure to be the optimised zirconocene.
Zirconocene Complexes
The optimisation method used for the calculations on the zirconocene complexes was initially to optimise using a B3LYP method and LANL2MB basis set and then with a LANL2DZ basis set. All optimisations, other than the LANL2MB optimisation with the t-butyl ligands, ran smoothly without any errors. The LANL2MB optimisation structure of the di-t-butyl complex was just taken and run with the higher LANL2DZ, which gave a successfully converged structure.
Zirconocene Dichloride, Cp2ZrCl2 Geometry Parameter Comparisons with Literature
Optimised zirconocene: DOI:10042/to-1058
Jmol of optimised structure:
Pentahelicene |
| Computed Values | Literature Values[8] | %Difference | |
|---|---|---|---|
| Cp-Zr-Cp Bond Angle/° | 128.4531 | 129.1 | 0.5 |
| Ligand-Zr-Ligand Bond Angle/° | 100.2236 | 97.1 | 3.2 |
| Zr-Cp Bond Length/Å | 2.2576 | 2.208 | 2.2 |
| 2.2754 | 2.202 | 3.3 | |
| Zr-Ligand Bond Length/Å | 2.4907 | 2.448 | 1.7 |
| 2.4907 | 2.446 | 1.8 |
The difference between the computed value and the literature values is small therefore proving that the geometry was well optimised. An interesting piece of data to take from the table is that the bond angles are not exactly 109.5° indicating that the complex is an irregular tetrahedral.
Lowest Occupied Molecular Orbital
 |
 |
 |
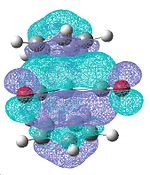 |
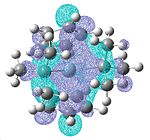
As zirconocene dichloride is a 16 electron complex, it has an easily occupiable empty orbital (the lowest unoccupied molecular orbital[7]) in the centre of the equatorial plane, therefore this could be a test to prove whether my optimised structure was correct.
The light blue part of the lowest unoccupied molecular orbital located between the two chloride ligands clearly shows that there is an accessible molecular orbital in the centre of the equatorial, ligand binding plane.
The LUMO of dimethyl zirconocene and di-t-butyl zirconocene show the same thing because they are also 16 electron complexes but the LUMO of dicarbonyl zirconocene will not show the same thing because it is an 18 electron complex.
Geometry Parameter Comparisons Between Different Complexes
Cp2Zr
|
Cp2ZrCl2
|
Cp2ZrMe2
|
Cp2ZrtBu2
|
Cp2Zr(CO)2
| ||||||||||||||||
|---|---|---|---|---|---|---|---|---|---|---|---|---|---|---|---|---|---|---|---|---|
| Cp-Zr-Cp Bond Angle/° | 156.0807 | 128.4531 | 131.9478 | 125.3832 | 141.3148 | |||||||||||||||
| Ligand-Zr-Ligand Bond Angle/° | - | 100.2236 | 97.9990 | 106.2106 | 88.1293 | |||||||||||||||
| Zr-Cp Bond Length/Å | 2.2075 | 2.2576 | 2.3194 | 2.3609 | 2.1900 | |||||||||||||||
| 2.1838 | 2.2754 | 2.3207 | 2.3677 | 2.2126 | ||||||||||||||||
| Zr-Ligand Bond Length/Å | - | 2.4907 | 2.2746 | 2.3865 | 2.1765 | |||||||||||||||
| - | 2.4907 | 2.2746 | 2.3901 | 2.1765 |
The Zr-Cp bond length for every tetrahedral complex is shorter than the zirconocene Zr-Cp bond length. A trend is observable in these bond lengths with the order from shortest to longest going from the dicarbonyl to the di-t-butyl. When sizes of the ligands also increases with the increasing Zr-Cp bond length suggesting that the increase in Zr-Cp bond length is due to an attempt to relieve unfavourable steric interactions between the cyclopentadienyl rings and the other ligands.
The Zr-C bond of the carbonyl ligand complex is much shorter than the other Zr-ligand bonds because of π-acceptor interactions from the metal d-orbitals into the empty π* orbital of the carbonyl ligand. The Zr-Cl bond in the dichloride complex is much longer than the other bonds because the π-donor interactions from the π orbital of the chloride ligand to the already occupied d-orbital of the metal causes an antibonding effect[9]. The di-t-butyl complex has longer Ligand-Zr bonds than the dimethyl complex because it is a larger ligand therefore to reduce the unfavourable steric interactions, the bond extends.
A general trend of Cp-Zr-Cp and Ligand-Zr-Ligand bond angles increasing with increasing ligand size is also seen, with the dimethyl as the only anomoly. The Cl-Zr-Cl bond angle of 100.2236° is close to literature value of 94-97°[9].
NBO Charge Analysis of Zirconocene Complexes
NBO of Cp2Zr(CO)2: DOI:10042/to-1102
 |
NBO of Cp2ZrCl2: DOI:10042/to-1101
 |
NBO of Cp2Zr: DOI:10042/to-1097
 |
NBO of Cp2ZrMe2: DOI:10042/to-1100
 |
NBO of Cp2ZrtBu2: DOI:10042/to-1099
 | |
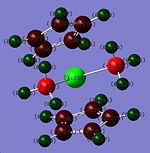
| Zr Centre NBO | 0.038 | 0.599 | 1.013 | 1.166 | 1.253 |
|---|---|---|---|---|---|
| Cp Carbons Average NBO | -0.2704 | -0.272 | -0.338 | -0.2876 | -0.2813 |
| Ligand Average NBO | 0.536(C)/-0.466(O) | -0.235 | - | -1.072 | -0.6358 |
The Cp carbons average NBO does not change much between the ligated complexes therefore it can be assumed that the ligands do not have a substantial effect on charge distribution of the cyclopentadienyl rings.
The Zr centre NBO in the dicarbonyl complex is the lowest because it is the only 18 electron complex and therefore the NBO on the atom is the lowest. Whilst at first predictions the Zr NBO would be more positive than the Zr centre in zirconocene, due to π-backbonding into the carbonyl ligand, the fact that it is an 18 electron complex outweighs the π-backbonding effect. The Zr centre NBO in the dichloro complex has the next most electron density because the out of the 16 electron complexes, it is the only complex with π-donor ligands. The π-electron donation into the Zr centre d-orbitals causes the NBO charge to be more negative.
In the dimethyl and di-t-butyl complexes, the Zr centres are more positive than the Zr centre in zirconocene. This is probobly due to the methyl groups withdrawing electron density from the centre and as there are more carbons in the t-butyl groups, it withdraws more electrons.
The alkyl ligands have the largest amount of negative NBO charge because they only interact with the Zr centre via σ-donation. The t-butyl ligands have less negative charge on each carbon atom because the charge is distributed among more atoms.
The dicarbonyl ligand has a NBO charge of -0.466 on the oxygens which is more negative than the chloride ligand NBO charge because there is π-backbonding into the π* orbital of the carbonyl ligand whereas in the chloride complex, there is a π-donation interaction into the metal complex therefore the NBO charges would change in their respective ways.
Conclusion to Mini-Project
Analysis of the changes in geometry and charge distribution were successfully modelled using computational chemistry, with noticable and predictable trends being observed. In addition to this, a frequency analysis of a problematic intermediate structure, during the optimisation of zirconocene, led to a discovery of a transition state that is possibly from the rotation of a Cp ring. The expected molecular orbitals of the complexes also matched literature values further proving that the computation methods (B3LYP/LANL2DZ) used were sufficient in the optimisation of the complexes. Overall, computational methods are a useful tool to use to confirm molecular structures geometries, molecular orbitals and energies.
References
- ↑ M. J. Bearpark, L. Blancafort and M. A. Robb, Molecular Physics, 2002, 100, 1735 - 1739, DOI:10.1080/00268970110105442
- ↑ D. A. Dixon and M. Gutowski, J. Phys. Chem. A, 2005, 109, 5129-5135,DOI:S1089-5639(04)04562-1 10.1021/jp0445627 S1089-5639(04)04562-1
- ↑ F. A. Cotton, D. J. Darensbourg, S. Klein and B. W. S. Kolthammer, Inorg. Chem., 1982, 21, 2661-2666,DOI:10.1021/ic00137a026
- ↑ G. Hogarth and T. Norman, Inorganica Chimica Acta, 1997, 254, 167-171,DOI:10.1016/S0020-1693(96)05133-X
- ↑ 5.0 5.1 5.2 D. J. Darensbourg, Inorg. Chem., 1979, 18, 14-17,DOI:10.1021/ic50191a003
- ↑ Jennifer C. Green, Chem. Soc. Rev., 1998, 27, 263 - 272,DOI:10.1039/a827263z
- ↑ 7.0 7.1 Astrid Sigel, Helmut Sigel, Metal Ions in Biological Systems, CRC Press, 1996, p56
- ↑ J. Y. Corey, X.-H. Zhu, L. Brammer and N. P. Rath, Acta Crystallographica Section C, 1995, 51, 565-567,DOI:10.1107/S0108270194011509
- ↑ 9.0 9.1 J. W. Lauher and R. Hoffmann, J. Am. Chem. Soc., 1976, 98, 1729-1742,DOI:10.1021/ja00423a017

