Rep:Mod:quantumblock
Welcome to the wiki page for James Cronshaw's Third Year Computational Chemistry Lab. This page is for Module 2. Module 3 is here
Section 1
Day 1
The Software Gaussview was run and a BH3 molecule was created, before bond lengths altered and the GUI explored. Following this the molecule was set such that each B-H bond was 1.5Å. After this an optimization was performed, this gives the minimum energy of the molecule, that is its most stable form. The table below details the calculation settings and key output results.
BH3 Optimization Calculation
| Calculation type | OPT (optimization) |
| Method | B3LYP |
| Basis Set | 3-21G |
| Bond length / Å | 1.19 |
| Angle subtended | 120.0° |
| Final Energy / Hartree | -26.462 |
| Gradient | 0.00020672 |
| Dipole / Deby | 0.00 |
| Point group | D3H |
| Calculation time | 18.0s |
| Calculation File and type | .log file here |
A Jmol model resulting from the optimization calculation can be found
Converging Forces
The calculation was determined as to whether it was successful in finding the minimum energy by looking as to whether the sets converged, or in other words whether each iteration of calculation has a smaller difference between it and the last than the previous iteration had. If this is the case then the system is working towards a minimum, global or local. The use of visualization of the final product confirms that the system has found a global minimum for the selected method and basis set
 Item               Value     Threshold  Converged?
 Maximum Force            0.000413     0.000450     YES
 RMS     Force            0.000271     0.000300     YES
 Maximum Displacement     0.001610     0.001800     YES
 RMS     Displacement     0.001054     0.001200     YES
 Predicted change in Energy=-1.071764D-06
 Optimization completed.
    -- Stationary point found.
                           ----------------------------
                           !   Optimized Parameters   !
                           ! (Angstroms and Degrees)  !
 --------------------------                            --------------------------
 ! Name  Definition              Value          Derivative Info.                !
 --------------------------------------------------------------------------------
 ! R1    R(1,2)                  1.1935         -DE/DX =    0.0004              !
 ! R2    R(1,3)                  1.1935         -DE/DX =    0.0004              !
 ! R3    R(1,4)                  1.1935         -DE/DX =    0.0004              !
 ! A1    A(2,1,3)              120.0            -DE/DX =    0.0                 !
 ! A2    A(2,1,4)              120.0            -DE/DX =    0.0                 !
 ! A3    A(3,1,4)              120.0            -DE/DX =    0.0                 !
 ! D1    D(2,1,4,3)            180.0            -DE/DX =    0.0                 !
 --------------------------------------------------------------------------------
 GradGradGradGradGradGradGradGradGradGradGradGradGradGradGradGradGradGrad
Understanding Optimization
The .log file was opened in gaussview and the animation of four steps observed. The arbitrary nature of bonds being drawn by the system is based on when atoms reach a certain distance as chosen by the computer. A definition of the existence of a bond in this way is assuming that systems are in a Boolean operator environment where electrons either bond or don't. This is in reality a bad description of a bond. Perhaps a better one is considering its nature of a cloud of charge that moves in space to be a probability. A (covalent) bond is a region of relatively high electron density between nuclei which arises at least partly from sharing of electrons and gives rise to an attractive force and characteristic internuclear distance[1]. In other words bonds are not defined by internuclear distance but by the level of electron sharing between nuclei, and orders of less than or greater than one (including non integer values) are possible.
An alternative view of a bond is to consider the electrons' probability of being in a region of space, and using Heisenberg's Uncertainty Principle a bond becomes purely a manifestation of the overlap of probabilities given to a finite degree of accuracy.
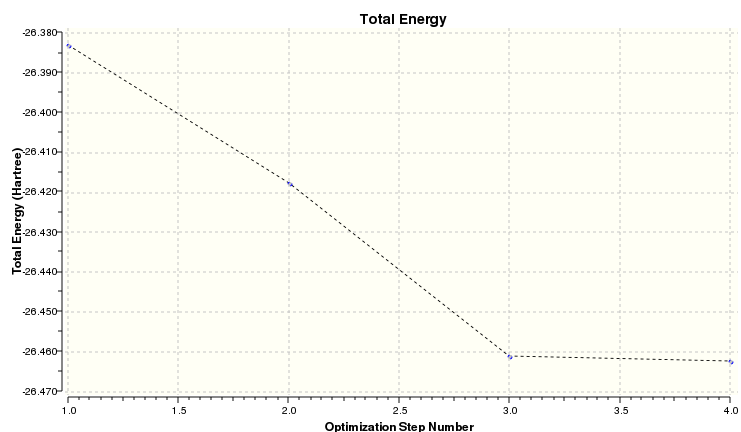
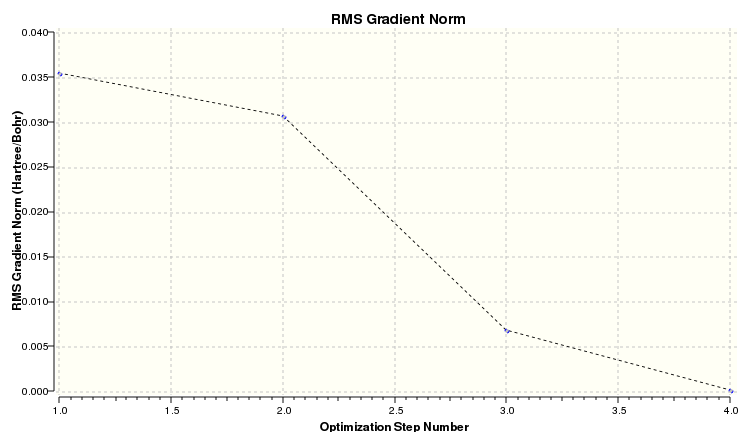
The plots of energy and the root mean square gradient are shown below. The RMS tends to zero showing a good optimization.
The energy plot of BH3 is shown below. The value tends to a minimum with decreasing gradient
The RMS gradient plotted with calculation number show a rapidly shrinking gradient that finishes at zero
Using a better basis set on BH3
Having performed a first optimization the task of finding an accurate structure and energy becomes considerably easier. The initial fast but rough optimization gives a good value. By using a more accurate basis set a better value can be achieved in accuracy. The first simulation performed gave a .log file, this was then used for the second optimization calculation. Because the basis set was different, quantitative comparison of the calculations has not been included because it has no meaning, other than that the energy has fallen being a sign of a change to a higher basis set.
| Calculation type | OPT (optimization) |
| Method | B3LYP |
| Basis Set | 6-31G |
| Bond length / Å | 1.19 |
| Angle subtended | 120.0° |
| Final Energy / Hartree | -26.615 |
| Gradient / Deby | 0.00021672 |
| Dipole | 0.00 |
| Point group | D3H |
| Calculation time | 25.0s |
| Calculation File and type | .log file here |
A Jmol model resulting from the optimization calculation can be found
Convergence was seen to have occured
Item               Value     Threshold  Converged?
 Maximum Force            0.000433     0.000450     YES
 RMS     Force            0.000284     0.000300     YES
 Maximum Displacement     0.001702     0.001800     YES
 RMS     Displacement     0.001114     0.001200     YES
 Predicted change in Energy=-1.189019D-06
 Optimization completed.
    -- Stationary point found.
                           ----------------------------
                           !   Optimized Parameters   !
                           ! (Angstroms and Degrees)  !
 --------------------------                            --------------------------
 ! Name  Definition              Value          Derivative Info.                !
 --------------------------------------------------------------------------------
 ! R1    R(1,2)                  1.1914         -DE/DX =    0.0004              !
 ! R2    R(1,3)                  1.1914         -DE/DX =    0.0004              !
 ! R3    R(1,4)                  1.1914         -DE/DX =    0.0004              !
 ! A1    A(2,1,3)              120.0            -DE/DX =    0.0                 !
 ! A2    A(2,1,4)              120.0            -DE/DX =    0.0                 !
 ! A3    A(3,1,4)              120.0            -DE/DX =    0.0                 !
 ! D1    D(2,1,4,3)            180.0            -DE/DX =    0.0                 !
 --------------------------------------------------------------------------------
 GradGradGradGradGradGradGradGradGradGradGradGradGradGradGradGradGradGrad
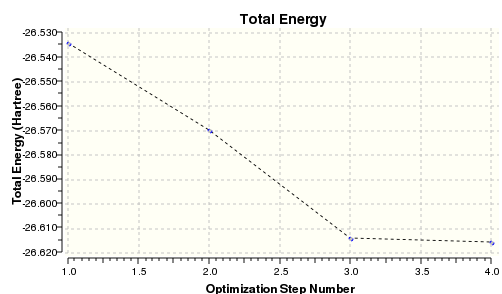
The graph below show the energy for the BH3 second optimisation
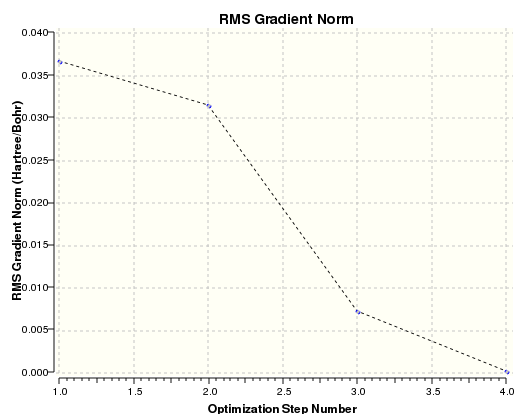
The graph below shows the gradient of BH3 second optimization. Note the downward trend to zero showing convergence
The calculated bond length of 1.19143 Å compared favorably with literature's value of 1.23217 Å.[2]
Day 2
Thallium Tribromide
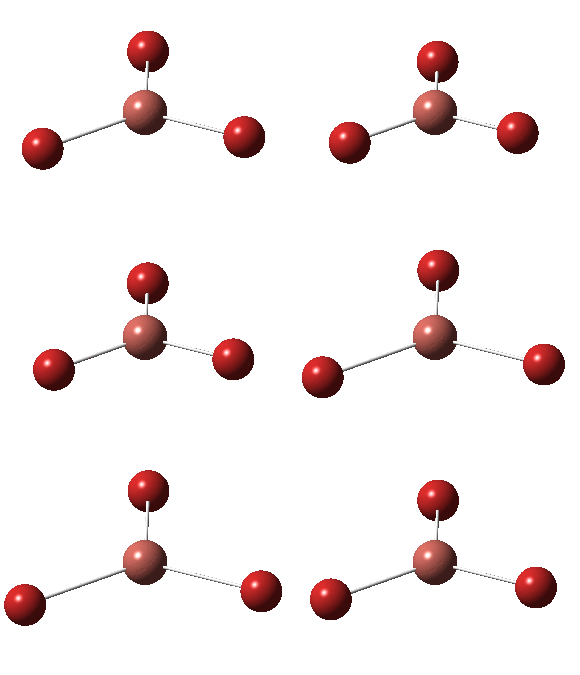
After building the TlBr3 on gaussview, the calculation was setup and the file submitted to the computer main frame. The table below details key calculation inputs and results.
| Calculation type | OPT (optimization) |
| Method | RB3LYP |
| Basis Set | LANL2DZ |
| Bond length / Å | 2.65 |
| Angle subtended | 120.0° |
| Final Energy / Hartree | -91.218 |
| Gradient | 0.00000090 |
| Dipole / Deby | 0.00 |
| Point group | D3H |
| Calculation time | 34.4s |
| Calculation File and type | .log file DOI:10042/22462 |
A Jmol model resulting from the optimization calculation can be found
The table below shows the evidence of convergance
 Item               Value     Threshold  Converged?
 Maximum Force            0.000002     0.000450     YES
 RMS     Force            0.000001     0.000300     YES
 Maximum Displacement     0.000022     0.001800     YES
 RMS     Displacement     0.000014     0.001200     YES
 Predicted change in Energy=-6.084093D-11
 Optimization completed.
    -- Stationary point found.
                           ----------------------------
                           !   Optimized Parameters   !
                           ! (Angstroms and Degrees)  !
 --------------------------                            --------------------------
 ! Name  Definition              Value          Derivative Info.                !
 --------------------------------------------------------------------------------
 ! R1    R(1,2)                  2.651          -DE/DX =    0.0                 !
 ! R2    R(1,3)                  2.651          -DE/DX =    0.0                 !
 ! R3    R(1,4)                  2.651          -DE/DX =    0.0                 !
 ! A1    A(2,1,3)              120.0            -DE/DX =    0.0                 !
 ! A2    A(2,1,4)              120.0            -DE/DX =    0.0                 !
 ! A3    A(3,1,4)              120.0            -DE/DX =    0.0                 !
 ! D1    D(2,1,4,3)            180.0            -DE/DX =    0.0                 !
 --------------------------------------------------------------------------------
 GradGradGradGradGradGradGradGradGradGradGradGradGradGradGradGradGradGrad
A comparison of Thallium - Bromine bond length with literature was undertaken yielding an interesting result. The CRC handbook of chemistry and physics 93rd edition quotes the bond length as 1.61817Å for a diatomic. This is a substantial difference to the calculated value of 2.65095Å. A further investigation found that the book had a typographical error in it and the editor-in-chief was contacted. The correct value is 2.61817Å and as a result of action taken the following edition of the book will be corrected. The corrected value agrees much more closely with the calculated value. The difference due to the imperfect nature of calculations using a basis set, and the vinrationg bond can be considered to have numerous lengths; min length, time averaged length. Reference lengths used here are all from infrared spectroscopic methods on diatomics.
Boron Tribromide
The table below shows the results for the Boron tribromide. Note the Long bond length compared to the BH3
| Calculation type | OPT (optimization) |
| Method | RB3LYP |
| Basis Set | Gen |
| Bond length / Å | 1.93 |
| Angle subtended | 120.0° |
| Final Energy / Hartree | -64.436 |
| Gradient / Deby | 0.00000382 |
| Dipole | 0.00 |
| Point group | D3H |
| Calculation time | 33.2s |
| Calculation File and type | .log file DOI:10042/22449 |
A Jmol model resulting from the optimization calculation can be found
Below is a table showing the optimization was convergent
 Item               Value     Threshold  Converged?
 Maximum Force            0.000008     0.000450     YES
 RMS     Force            0.000005     0.000300     YES
 Maximum Displacement     0.000036     0.001800     YES
 RMS     Displacement     0.000023     0.001200     YES
 Predicted change in Energy=-4.027672D-10
 Optimization completed.
    -- Stationary point found.
                           ----------------------------
                           !   Optimized Parameters   !
                           ! (Angstroms and Degrees)  !
 --------------------------                            --------------------------
 ! Name  Definition              Value          Derivative Info.                !
 --------------------------------------------------------------------------------
 ! R1    R(1,2)                  1.934          -DE/DX =    0.0                 !
 ! R2    R(1,3)                  1.934          -DE/DX =    0.0                 !
 ! R3    R(1,4)                  1.934          -DE/DX =    0.0                 !
 ! A1    A(2,1,3)              120.0            -DE/DX =    0.0                 !
 ! A2    A(2,1,4)              120.0            -DE/DX =    0.0                 !
 ! A3    A(3,1,4)              120.0            -DE/DX =    0.0                 !
 ! D1    D(2,1,4,3)            180.0            -DE/DX =    0.0                 !
 --------------------------------------------------------------------------------
 GradGradGradGradGradGradGradGradGradGradGradGradGradGradGradGradGradGrad
The bond length of 1.93396 Å compared well with literature's value of 1.888 Å.[2]
Analysis of results
In this section the three optimised molecules, BH3, TlBr3 and BBr3 are compared in their results, specifically bond length.
| Molecule | Bond length / Å |
| BH3 | 1.19 |
| TlBr3 | 2.65 |
| BBr3 | 1.93 |
The most obvious observation is that the largest bond length is for the combined largest molecule; TlBr3, and the smallest bond length for the smallest molecule, BH3.
A direct comparison of BH3 and BBr3 gives comparison of changing the ligand, or outer, atoms. To understand the significance of this first the difference In atoms must Be considered; Hydrogen and Bromine. Hydrogen and Bromine both have an odd number of electrons and prefer to form (close to) single bonds with other compounds. They do, however, differ enormously. First while Hydrogen has just one electron, Bromine has seven In its valence shell, giving rise to three lone pairs In the XBr3 arrangement. Further more due to the electronic structure of Bromine it is strongly electronegative in comparison to Hydrogen. Finally Bromine is in the fourth period and thus substantially larger than Hydrogen, the first element. Bromine's covalent atomic radius is 1.17Å[2] while Hydrogen is just 0.32Å[2]. The larger radius of Bromine results in more diffuse atomic orbitals. This results in weaker bonding, and hence a longer bond compared to Hydrogen. Additionally Boron is, in this system, somewhat electron deficient and hence the bonding to Bromine is even less favorable. (Donation of lone pairs is not easily achieved due to orbital size mis-match) The weaker bond and larger steric size of Bromine explain the longer bond observed.
Comparison of TlBr3 and BBr3 allows differentiation of central atom's effect in the bond length. To consider this the difference in central atom must first be considered. While both elements are in group three, Boron is a non metal that has an atomic radius of 0.84Å[2], while Thallium is a metal with an atomic radius of 1.44Å[2]. So Thallium is a larger molecule with more steric bulk and larger, more diffuse electron orbitals. Additionally it is more electropositive than Boron (Tl 1.8, B 2.04[2]). Overall the key difference is size and electropositivity. While there is a difference in electropositivity, it is only small and would have a small effect to shorten the bond to Bromine, a reasonably electronegative element. The key factor is the size of atom. The larger size of Thallium, combined with more diffuse orbitals as a result give a steric and electronic reason to a Tl-Br being longer than a B-Br. Although Boron and Bromine are mismatched in size, there is a size mismatch between Thallium and Bromine too.
Ultimately steric size and outer electron orbital radius determine bond length for these examples.
What is a bond?
GaussView defines a bond based on whether two atoms are within an arbitrary distance of one another. This understanding gives explanation to the apparent lack of bond in some situations when using GaussView. But in reality the model is not implying that there is no bond, just that it is being interpreted as so. The model calculates electron orbital overlap, and it is this that determines if a bond is present. The IUPAC gold book defines a covalent bond as 'a region of relatively high electron density between nuclei which arises at least partly from sharing of electrons and gives rise to an attractive force and characteristic internuclear distance.[1]. Thus by this definition we must consider solely the electrons in asking whether a bond is present. This information is determined by solving the problem quantum mechanically. An additional issue is GaussView's Boolean view of a bond being either present or not. In reality bonds exist in infinite intermediate levels of order.
In summary the flaw with GaussView is that it uses bond length as a guide to whether there is a bond or not. This is wrong as it uses data that is consequential on the equation being solved. While bond length and order are related they are not tied. A bond does not suddenly come into being as two atoms approach, but increases in strength from zero as they approach one another.
Day 3
Frequency Analysis of BH3
Calcuation data
A frequency calculation was undertaken for BH3. This was done using the 6-31G basis set optimized molecule. The calculation data is as follows
| Calculation type | FREQ (Frequency) |
| Method | RB3LYP |
| Basis Set | 6-31G(d,p) |
| Bond length / Å | 1.19 |
| Angle subtended | 120.0° |
| Final Energy / Hartree | -26.615 |
| Gradient | 0.00000162 |
| Dipole / Deby | 0.00 |
| Point group | D3H |
| Calculation time | 11.0s |
| Calculation File and type | .log file here |
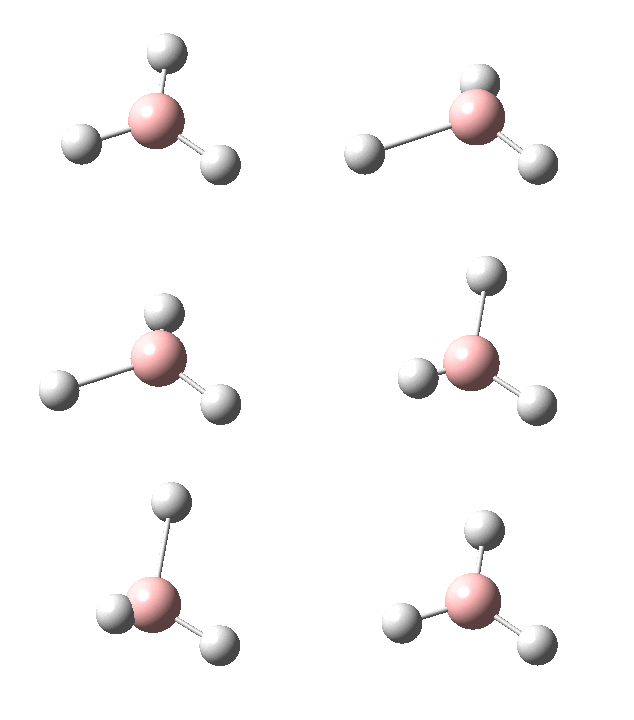
Below shows a sectoion of the .log file. Note the low values of low frequencies relative to those assigned to symmetry groups.
Low frequencies ---   -7.0794   -7.0439   -0.0279   -0.0006    0.7084    6.6303
 Low frequencies --- 1163.0023 1213.1577 1213.1579
 Harmonic frequencies (cm**-1), IR intensities (KM/Mole), Raman scattering
 activities (A**4/AMU), depolarization ratios for plane and unpolarized
 incident light, reduced masses (AMU), force constants (mDyne/A),
 and normal coordinates:
                     1                      2                      3
                    A2"                    E'                     E'
 Frequencies --  1163.0023              1213.1577              1213.1579
 Red. masses --     1.2531                 1.1072                 1.1072
 Frc consts  --     0.9986                 0.9600                 0.9600
 IR Inten    --    92.5654                14.0563                14.0557
  Atom  AN      X      Y      Z        X      Y      Z        X      Y      Z
     1   5     0.00   0.00   0.16    -0.10   0.00   0.00     0.00   0.10   0.00
     2   1     0.00   0.00  -0.57     0.81   0.00   0.00     0.00   0.08   0.00
     3   1     0.00   0.00  -0.57     0.14   0.39   0.00    -0.39  -0.59   0.00
     4   1     0.00   0.00  -0.57     0.14  -0.39   0.00     0.39  -0.59   0.00
                     4                      5                      6
                    A1'                    E'                     E'
 Frequencies --  2582.4844              2715.6117              2715.6126
 Red. masses --     1.0078                 1.1273                 1.1273
 Frc consts  --     3.9601                 4.8983                 4.8983
 IR Inten    --     0.0000               126.3354               126.3294
  Atom  AN      X      Y      Z        X      Y      Z        X      Y      Z
     1   5     0.00   0.00   0.00     0.11   0.00   0.00     0.00   0.11   0.00
     2   1     0.00   0.58   0.00     0.02   0.00   0.00     0.00  -0.81   0.00
     3   1     0.50  -0.29   0.00    -0.60   0.36   0.00     0.36  -0.19   0.00
     4   1    -0.50  -0.29   0.00    -0.60  -0.36   0.00    -0.36  -0.19   0.00
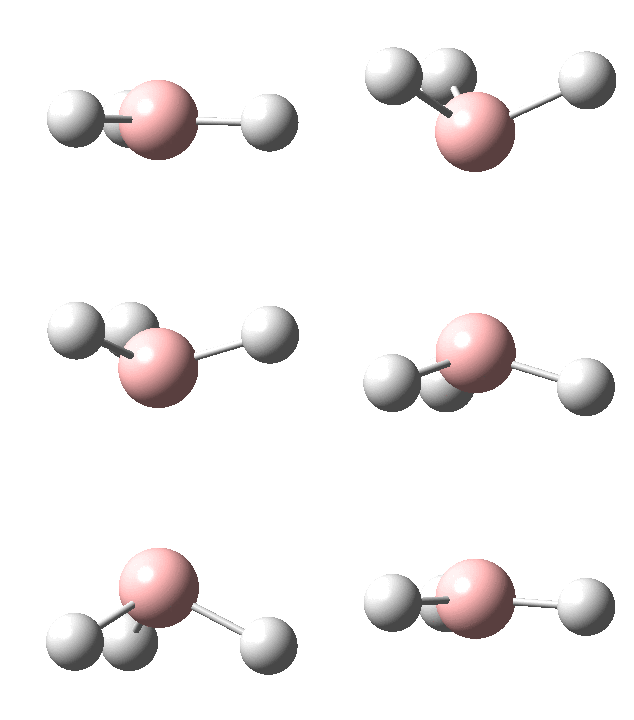
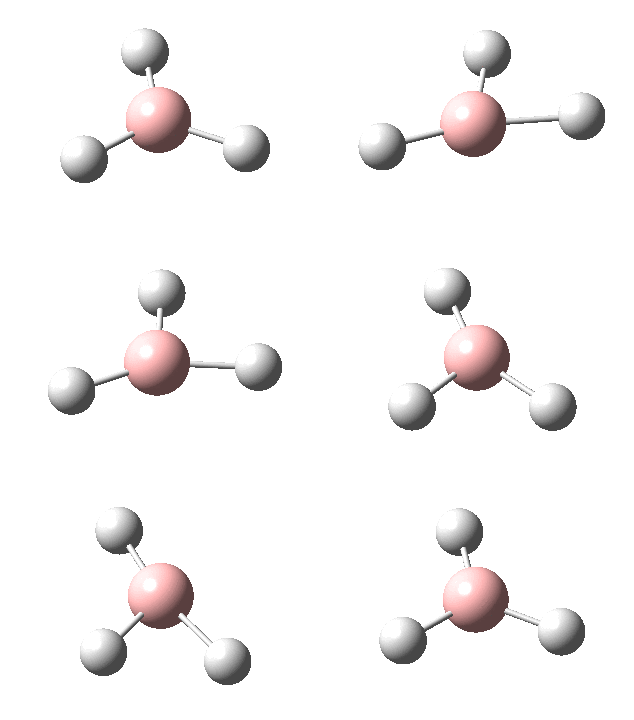
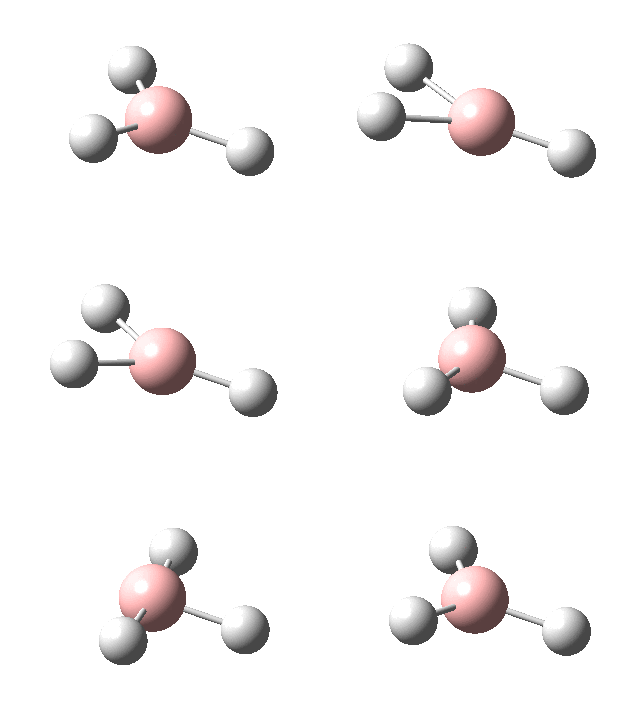
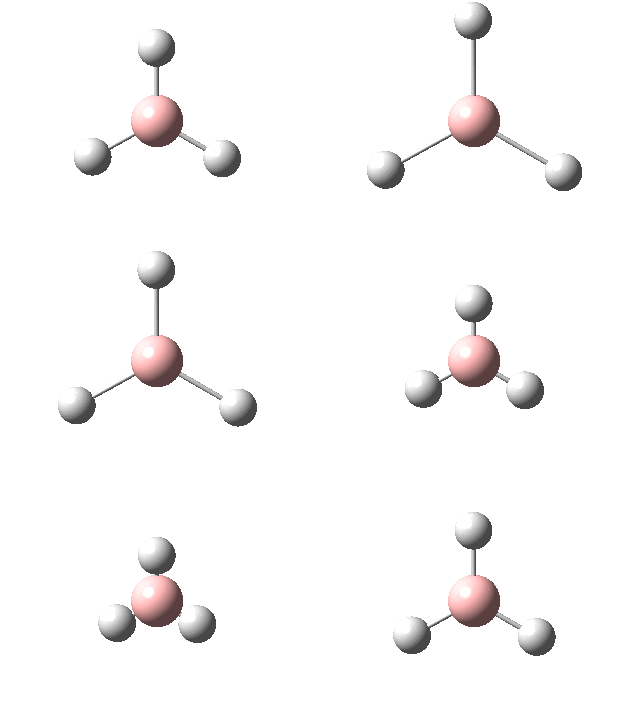
Summary Table of Frequency Animations and Description
Infrared Spectrum calculated
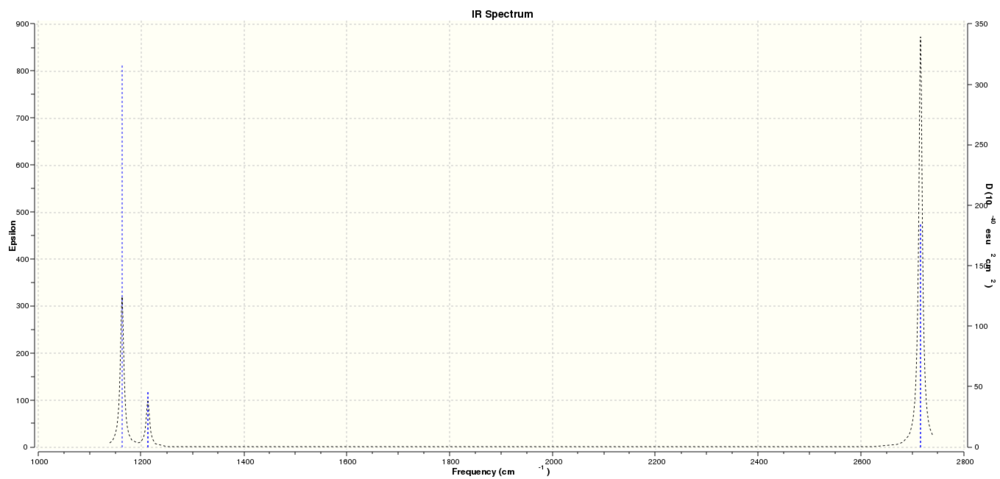
Below is the infrared spectrum for BH3 as calculated using gaussian from the 6-31G basis set optimized structure. Click on the image to be taken to a link to the full size graph.
There are several interesting features of this graph. The first is that there are only three peaks, while six vibrations were calculated. This is because of two reasons. First there are two pairs of overlapping vibrations; one at 1213.16cm-1 and another at 2715.61cm-1. Now only four vibrations would be expected. The second factor that explains the spectrum is that the vibration at 2582.48cm-1 has an intensity of zero so therefore would not be seen on the spectrum. So the three peaks are at 1163.00cm-1, 1213.16cm-1 and 2715.61cm-1. The other point of interest is that overlapping stretches have the same symmetry group and number of vibrational modes (i.e. one or two) has no baring on the strength of vibration per se as the vibration at 1213.16cm-1 is much weaker than the analogue at 1163.00cm-1.
Frequency Analysis of TlBr3
Calculation data
A frequency calculation was undertaken for TlBr3. This was done using psuedopotential optimized molecule. The calculation data is as follows
| Calculation type | FREQ (Frequency) |
| Method | RB3LYP |
| Basis Set | LANL2DZ |
| Bond length / Å | 2.65 |
| Angle subtended | 120.0° |
| Final Energy / Hartree | -91.218 |
| Gradient | 0.00000088 |
| Dipole / Deby | 0.00 |
| Point group | D3H |
| Calculation time | 33.4s |
| Calculation File and type | .log file DOI:10042/22479 |
Below shows a sectoion of the .log file. Note the low values of low frequencies relative to those assigned to symmetry groups. The lowest real vibrational mode is at 46.4289cm-1
 Low frequencies ---   -3.4213   -0.0026   -0.0004    0.0015    3.9367    3.9367
 Low frequencies ---   46.4289   46.4292   52.1449
 Harmonic frequencies (cm**-1), IR intensities (KM/Mole), Raman scattering
 activities (A**4/AMU), depolarization ratios for plane and unpolarized
 incident light, reduced masses (AMU), force constants (mDyne/A),
 and normal coordinates:
                     1                      2                      3
                    E'                     E'                     A2"
 Frequencies --    46.4289                46.4292                52.1449
 Red. masses --    88.4613                88.4613               117.7209
 Frc consts  --     0.1124                 0.1124                 0.1886
 IR Inten    --     3.6867                 3.6867                 5.8466
  Atom  AN      X      Y      Z        X      Y      Z        X      Y      Z
     1  81     0.00   0.28   0.00    -0.28   0.00   0.00     0.00   0.00   0.55
     2  35     0.00   0.26   0.00     0.74   0.00   0.00     0.00   0.00  -0.48
     3  35     0.43  -0.49   0.00    -0.01  -0.43   0.00     0.00   0.00  -0.48
     4  35    -0.43  -0.49   0.00    -0.01   0.43   0.00     0.00   0.00  -0.48
                     4                      5                      6
                    A1'                    E'                     E'
 Frequencies --   165.2685               210.6948               210.6948
 Red. masses --    78.9183               101.4032               101.4032
 Frc consts  --     1.2700                 2.6522                 2.6522
 IR Inten    --     0.0000                25.4830                25.4797
  Atom  AN      X      Y      Z        X      Y      Z        X      Y      Z
     1  81     0.00   0.00   0.00     0.42   0.00   0.00     0.00   0.42   0.00
     2  35     0.00  -0.58   0.00     0.01   0.00   0.00     0.00  -0.74   0.00
     3  35     0.50   0.29   0.00    -0.55  -0.32   0.00    -0.32  -0.18   0.00
     4  35    -0.50   0.29   0.00    -0.55   0.32   0.00     0.32  -0.18   0.00
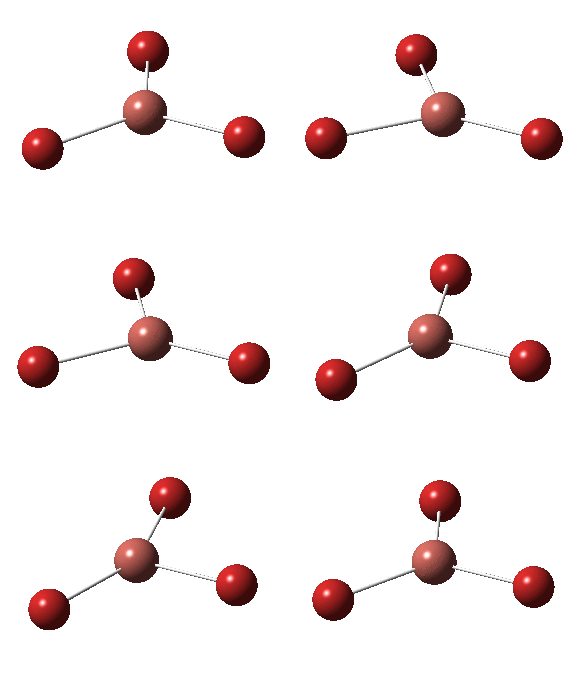
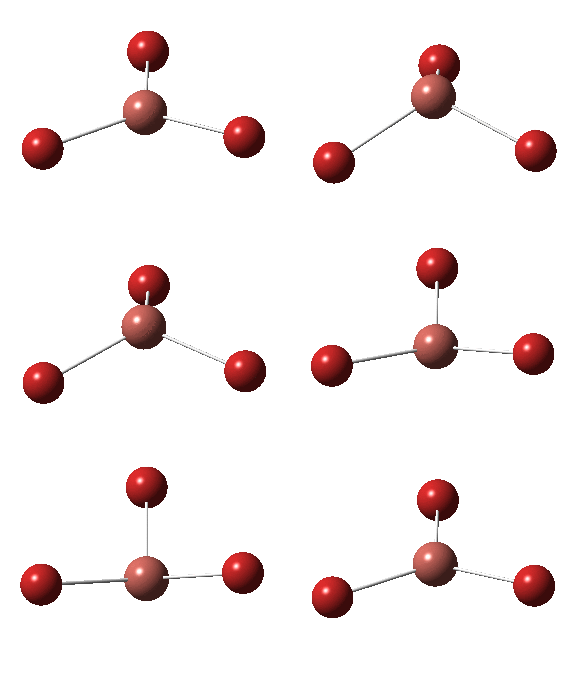
Summary Table of Frequency Animations and Description
Infrared spectrum calculated
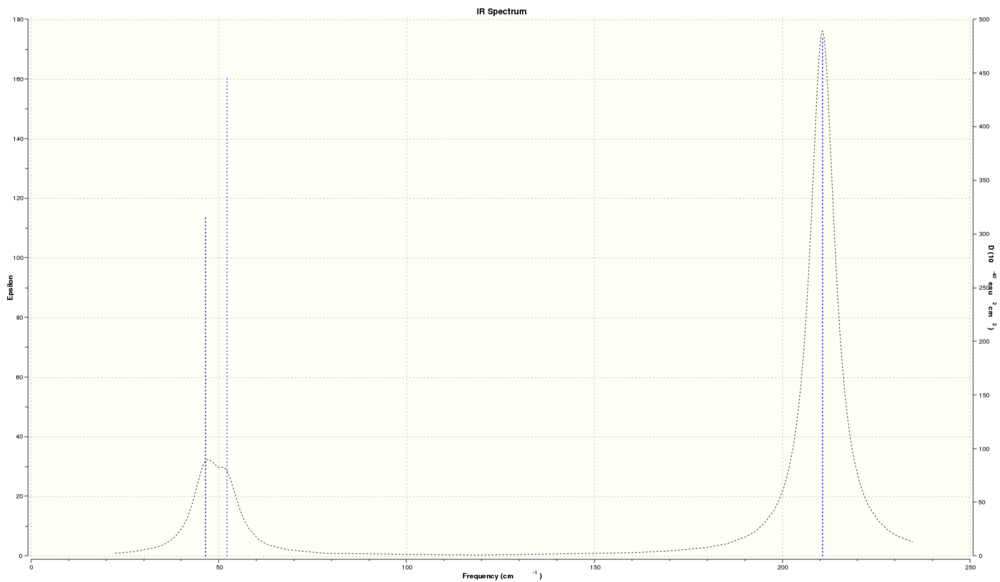
Below is the infrared spectrum calculated for TlBr3
The spectrum shows three peaks, two very close at 50cm-1 and a third around 210cm-1. There are, however, six predicted vibrational modes. So why are there not six peaks?
The first issue is overlapping peaks. There are two pairs of vibrations with the same frequency at 46.43cm-1 and 210.69cm-1. This would reduce the number of peaks by two, predicting a four peak spectrum. The last missing peak is due to the calculated peak at 165.27cm-1 having an intensity of zero. Hence the three peaks seen are what is expected.
Comparison of BH3 and TlBr3
Below is a table that compares the two spectral simulations run. In order to make a comparison the symmetry has been included and like symmetry are on the same row. The order of symmetry is based on the frequencies of the BH3 calculation.
| Symmetry | BH3 /cm-1 | TlBr3 /cm-1 |
| A2" | 1163 | 52 |
| E' | 1213 | 46 |
| E' | 1213 | 46 |
| A1' | 2582 | 165 |
| E' | 2716 | 211 |
| E' | 2716 | 211 |
The first point of consideration on analyzing the vibrational calculation results is the substantial difference in values between BH3 and TlBr3. This is due to the difference in mass of the systems. The relationship between the frequency and mass of a system is given by:
Where k is a constant of force, and m is the mass. This relationship is only an approximate guide to the system, but does give insight into the substantial difference of between 13 and 22 fold differences in size. The relationship also points to the possibility of difference of force constant as well as mass. As Boron and Hydrogen are smaller and have a shorter bond length, their force constant is higher than that of a Thallium Bromine system with longer bonds that have larger orbital mis-matches in size. This will serve to increase the BH3 frequency relative to that of the TlBr3 molecule.
The molecules have seen a reordering of the modes, with the lowest in energy BH3 being the A2", followed by two E' and one A1' and finally two further E'. In TlBr3 the variation occurs at the lower end of the energy range with the A2" symmetry being higher in energy than the two first E' groups.
The spectrums show strong similarities in both having three peaks, one much higher than the other two. Both spectrum showed an intensity of zero for the A1' peak.
The grouping of modes of vibration into the lower energy A2" and E' and higher A1' and E' is as the lower energy A2" and E' are bends, whereas A1' and E' are stretches. Stretching modes have higher energies that bending.
The same basis set has to be used for the optimization and frequency analysis so that the molecule is both at a minimum, and being analyzed with the same assumptions. As basis sets make assumptions about the calculation it is essential that calculations for extracting data are using the same assumptions. In other words if an optimized bond length and angle is found using one basis set, using a different basis set for frequency analysis would result in a different minimum bond length and hence frequency of vibrations.
Frequency analysis allows the comparison of theoretical molecules with real ones, to test the accuracy of models and to analyze molecules who's spectra would otherwise not be able to be found. Finally vibrations that don't appear on spectra due to having an intensity of zero can be found.
Low frequencies are not true vibrations that the molecule would undergo, rather a theoretical result of the calculations that result from extrapolation and the ability to consider all possibilities.
Molecular Orbital Analysis of BH3
| Calculation type | Energy (Frequency) |
| Method | RB3LYP |
| Basis Set | LANL2DZ |
| Bond length / Å | 2.65 |
| Angle subtended | 120.0° |
| Final Energy / Hartree | -91.218 |
| Gradient | 0.00000088 |
| Dipole / Deby | 0.00 |
| Point group | D3H |
| Calculation time | 33.4s |
| Calculation File and type | .log file DOI:10042/22486 |
MO diagram of BH3 using LCAO in chemdraw.
The Molecular Orbital diagram shows strong agreement between the linear combination of atomic orbitals and the calculated molecular orbitals.
The agreement is good enough that the benefits of qualitative Molecular Orbital theory are evident. The accuracy of surface plots is very good. In terms of usefulness there are clear benefits in being able to confirm the basis of LCAO as a method to give a quick, qualtitative approximation of the bonding system. Second the simulation demonstrates the potential that on more complex molecules with higher order orbitals (d and f) challenging molecular orbitals could be found.
Day 4
NH3 Analysis
This section looks at NH3, with optimization and frequency analysis, followed by NBO analysis
Optimization Calculation
| Calculation type | OPT (optimization) |
| Method | RB3LYP |
| Basis Set | 6-31G (d,p) |
| Bond length / Å | 1.02 |
| Angle subtended | 105.7° |
| Final Energy / Hartree | -56.558 |
| Gradient | 0.00000885 |
| Dipole / Deby | 0.00 |
| Point group | D3H |
| Calculation time | 65.0s |
| Calculation File and type | .log file here |
A Jmol model resulting from the optimization calculation can be found
Below is the code showing convergance from the .log file
Item               Value     Threshold  Converged?
 Maximum Force            0.000024     0.000450     YES
 RMS     Force            0.000012     0.000300     YES
 Maximum Displacement     0.000079     0.001800     YES
 RMS     Displacement     0.000053     0.001200     YES
 Predicted change in Energy=-1.629727D-09
 Optimization completed.
    -- Stationary point found.
                           ----------------------------
                           !   Optimized Parameters   !
                           ! (Angstroms and Degrees)  !
 --------------------------                            --------------------------
 ! Name  Definition              Value          Derivative Info.                !
 --------------------------------------------------------------------------------
 ! R1    R(1,2)                  1.018          -DE/DX =    0.0                 !
 ! R2    R(1,3)                  1.018          -DE/DX =    0.0                 !
 ! R3    R(1,4)                  1.018          -DE/DX =    0.0                 !
 ! A1    A(2,1,3)              105.7413         -DE/DX =    0.0                 !
 ! A2    A(2,1,4)              105.7486         -DE/DX =    0.0                 !
 ! A3    A(3,1,4)              105.7479         -DE/DX =    0.0                 !
 ! D1    D(2,1,4,3)           -111.8631         -DE/DX =    0.0                 !
 --------------------------------------------------------------------------------
 GradGradGradGradGradGradGradGradGradGradGradGradGradGradGradGradGradGrad
Frequency Analysis
| Calculation type | FREQ (frequency) |
| Method | RB3LYP |
| Basis Set | 6-31G (d,p) |
| Bond length / Å | 1.02 |
| Angle subtended | 105.7° |
| Final Energy / Hartree | -56.558 |
| Gradient | 0.00003317 |
| Dipole / Deby | 1.85 |
| Point group | C1 |
| Calculation time | 18.0s |
| Calculation File and type | .log file here |
Below is the raw code showing both that the low frequencies are low and the values of the six real modes of vibration
Low frequencies ---  -33.6219   -0.0018   -0.0014    0.0007   15.4749   27.8391
 Low frequencies --- 1089.4393 1694.0906 1694.1791
 Harmonic frequencies (cm**-1), IR intensities (KM/Mole), Raman scattering
 activities (A**4/AMU), depolarization ratios for plane and unpolarized
 incident light, reduced masses (AMU), force constants (mDyne/A),
 and normal coordinates:
                     1                      2                      3
                     A                      A                      A
 Frequencies --  1089.4392              1694.0906              1694.1791
 Red. masses --     1.1800                 1.0645                 1.0644
 Frc consts  --     0.8252                 1.7999                 1.8001
 IR Inten    --   145.4670                13.5543                13.5621
  Atom  AN      X      Y      Z        X      Y      Z        X      Y      Z
     1   7     0.12   0.00   0.00     0.00   0.05  -0.05     0.00  -0.05  -0.05
     2   1    -0.53  -0.21   0.00     0.19   0.11   0.52    -0.18  -0.10   0.55
     3   1    -0.53   0.11   0.18     0.06  -0.66   0.34     0.25   0.08  -0.21
     4   1    -0.53   0.11  -0.18    -0.25  -0.12  -0.23    -0.07   0.65   0.33
                     4                      5                      6
                     A                      A                      A
 Frequencies --  3461.1144              3589.1845              3590.0374
 Red. masses --     1.0272                 1.0883                 1.0883
 Frc consts  --     7.2502                 8.2605                 8.2645
 IR Inten    --     1.0583                 0.2703                 0.2690
  Atom  AN      X      Y      Z        X      Y      Z        X      Y      Z
     1   7     0.04   0.00   0.00     0.00   0.06  -0.05     0.00   0.05   0.06
     2   1    -0.18   0.55   0.00     0.24  -0.59  -0.01     0.19  -0.47   0.02
     3   1    -0.18  -0.27  -0.47     0.05   0.08   0.09    -0.31  -0.37  -0.65
     4   1    -0.18  -0.28   0.48    -0.29  -0.34   0.61     0.11   0.15  -0.22
| Mode number | Wavenumber /cm-1 | Intensity |
| 1 | 1089 | 145 |
| 2 | 1694 | 14 |
| 3 | 1694 | 14 |
| 4 | 3461 | 1 |
| 5 | 3589 | 0 |
| 6 | 3590 | 0 |
Molecular Orbital Calculations
| Calculation type | SP (Energy) |
| Method | RB3LYP |
| Basis Set | 6-31G (d,p) |
| Bond length / Å | 1.02 |
| Angle subtended | 105.7° |
| Final Energy / Hartree | -56.558 |
| Gradient | 0.00003317 |
| Dipole / Deby | 1.85 |
| Point group | C1 |
| Calculation time | 18.0s |
| Calculation File and type | .log file DOI:10042/22497 |
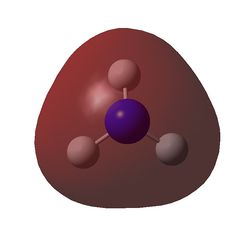
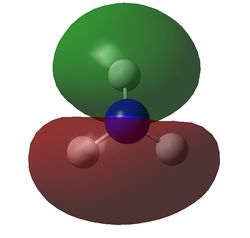
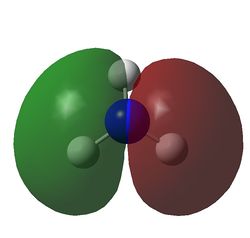
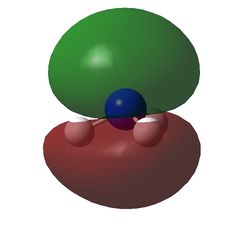
Below are the images of the Mo's calculated. Names are to the right of each picture
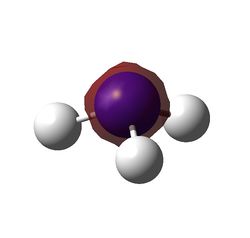 MO1
MO1
 MO2
MO2
 MO3
MO3
 MO4
MO4
 MO5
MO5
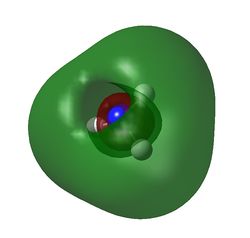 MO6
MO6
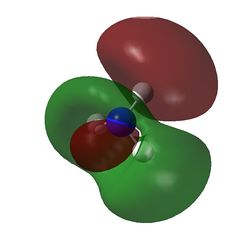 MO7
MO7
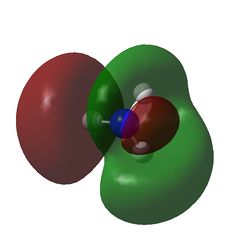 MO8
MO8
NBO Analysis
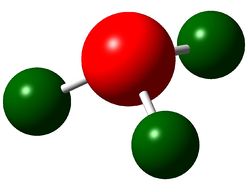
The charge distribution of NH3 was determined from the .log file of the energy calculation. Below is the molecule with Charge distribution shown.
Charge distribution diagram. Charge Range: +1.125 to -1.125. Colour scheme: Red is negative, green is positive. The specific charges are -1.125 for Nitrogen and +0.375 for each Hydrogen. The molecule is thus neutral.
The .log file showed that there were evidently three equal bonds from Nitrogen to Hydrogen, one core pair (1s) and a lone pair.
Ammonium Borane and Association energies
This section will look at Ammonium Borane (NH3BH3) in investigating how association energies can be calculated.
Optimization calculation
| Calculation type | FOPT (optimization) |
| Method | RB3LYP |
| Basis Set | 6-31G (d,p) |
| Bond length (N-B) / Å | 1.67 |
| Final Energy / Hartree | -83.225 |
| Gradient | 0.00005777 |
| Dipole / Deby | 5.56 |
| Point group | C3 |
| Calculation time | 96.0s |
| Calculation File and type | .log file here |
A Jmol model resulting from the optimization calculation can be found
Below is the code showing convergance from the .log file. The full atomic break down is not included due to the size, but can of course be found in the .log file below this section.
  Item               Value     Threshold  Converged?
 Maximum Force            0.000166     0.000450     YES
 RMS     Force            0.000035     0.000300     YES
 Maximum Displacement     0.000908     0.001800     YES
 RMS     Displacement     0.000312     0.001200     YES
 Predicted change in Energy=-1.130465D-07
 Optimization completed.
Frequency calculation
| Calculation type | FREQ (frequency) |
| Method | RB3LYP |
| Basis Set | 6-31G (d,p) |
| Bond length (N-B) / Å | 1.67 |
| Final Energy / Hartree | -83.225 |
| Gradient | 0.00005786 |
| Dipole / Deby | 5.56 |
| Point group | C3 |
| Calculation time | 35.0s |
| Calculation File and type | .log file here |
Below is the raw code showing that the low frequencies are low relative to those that are real. The complete set of eighteen vibrational modes are summarized after. This extract shows the key evidence for a minimum.
Low frequencies ---  -31.1375   -0.2974   -0.0606    0.0694   10.7195   10.8466
 Low frequencies ---  260.9068  631.3021  637.4558
| Mode number | Wavenumber /cm-1 | Intensity |
| 1 | 261 | 0 |
| 2 | 631 | 14 |
| 3 | 637 | 4 |
| 4 | 637 | 4 |
| 5 | 1069 | 41 |
| 6 | 1069 | 41 |
| 7 | 1196 | 109 |
| 8 | 1203 | 4 |
| 9 | 1203 | 4 |
| 10 | 1328 | 114 |
| 11 | 1676 | 28 |
| 12 | 1676 | 28 |
| 13 | 2473 | 67 |
| 14 | 2533 | 231 |
| 15 | 2533 | 231 |
| 16 | 3464 | 3 |
| 17 | 3581 | 28 |
| 18 | 3581 | 28 |
Energy calculations
The Ammonia Borane compound can be formed from NH3 and BH3. The reaction energy can thus be found by finding the difference in optimized energy from reactants to products.
| Molecule | Energy of minimum / Hartrees |
| NH3 | -56.558 |
| BH3 | -26.615 |
| NH3BH3 | -83.225 |
Using this information the energy of the reaction can be found to be:
ΔE=E(NH3BH3)-[E(NH3)+E(BH3)]
ΔE=-83.225-(-56.558-26.615)
ΔE=-0.052 Hartree
ΔE=-4.586x10⁻¹⁸J
This can be expressed as a bond enthalpy for comparison with literature:
ΔE=-137kJmol-1 The value is negative which makes sense as bond forming lowers molecular energy, which is conserved by emission of heat.
Literature gives a value of 130.1 ±4.2kJmol-1.[2] This is close to the calculated value (within 6%). The model is therefore reasonably good at finding bond enthalpies. The enthapoy from literature was the energy to break the bond, hence why it is positive.
Section 2
The Mini Project selected is Investigating Aromaticity. The structure of the project is to first gain an understanding of Benzene from a Molecular Orbital perspective. Then investigating substituted analogues; what happens when one C-H group is replaced with another main group element? That research will aid in a study of borazine, an inorganic analogue of benzene. In all of the work the aim will be to discover information about the molecules. Comparatives will also be drawn between the molecules where suitable. In order for the data calculated to be valid only one basis set will be used for all calculations herein; 6-31G(d,p).
Benzene
Optimization
| Calculation type | FOPT (optimization) |
| Method | RB3LYP |
| Basis Set | 6-31G (d,p) |
| Bond length (C-C) / Å | 1.40 |
| Internal Angle | 120.0° |
| Final Energy / Hartree | -232.258 |
| Gradient | 0.00009545 |
| Dipole / Deby | 0.00 |
| Point group | C1 |
| Calculation time | 95.0s |
| Calculation File and type | .log file DOI:10042/22520 |
Click to see the optimized Benzene molecule
The table below shows that the optimization has converged.
 Item               Value     Threshold  Converged?
 Maximum Force            0.000212     0.000450     YES
 RMS     Force            0.000085     0.000300     YES
 Maximum Displacement     0.000991     0.001800     YES
 RMS     Displacement     0.000315     0.001200     YES
 Predicted change in Energy=-5.157454D-07
 Optimization completed.
    -- Stationary point found.
The calculated information about benzene, when compared to literature is close; a value of 1.387Å[3] is found from literature, compared with a calculated value of 1.40Å.
Frequency analysis
| Calculation type | FREQ (frequency) |
| Method | RB3LYP |
| Basis Set | 6-31G (d,p) |
| Bond length (C-C) / Å | 1.40 |
| InternalAngle | 120.0° |
| Final Energy / Hartree | -232.258 |
| Gradient | 0.00009549 |
| Dipole / Deby | 0.00 |
| Point group | C1 |
| Calculation time | 5min 31.6s |
| Calculation File and type | .log file DOI:10042/22559 |
Below is the section from the .log file showing the low frequencies. Note that the line below showing the first of the real ones are all positive, showing that the molecule is at a minimum, not maximum.
Low frequencies ---  -17.2788  -14.5868   -9.6527   -0.0007   -0.0001    0.0005
Low frequencies ---  413.7971  414.4697  620.8545
| Mode number | Wavenumber /cm-1 | Intensity | Mode number | Wavenumber /cm-1 | Intensity |
| 1 | 414 | 0 | 16 | 1179 | 0 |
| 2 | 414 | 0 | 17 | 1202 | 0 |
| 3 | 621 | 0 | 18 | 1202 | 0 |
| 4 | 621 | 0 | 19 | 1356 | 0 |
| 5 | 693 | 74 | 20 | 1380 | 0 |
| 6 | 718 | 0 | 21 | 1524 | 7 |
| 7 | 864 | 0 | 22 | 1525 | 7 |
| 8 | 865 | 0 | 23 | 1653 | 0 |
| 9 | 974 | 0 | 24 | 1653 | 0 |
| 10 | 974 | 0 | 25 | 3175 | 0 |
| 11 | 1013 | 0 | 26 | 3185 | 0 |
| 12 | 1018 | 0 | 27 | 3185 | 0 |
| 13 | 1020 | 0 | 28 | 3200 | 46 |
| 14 | 1066 | 3 | 29 | 3201 | 47 |
| 15 | 1066 | 3 | 30 | 3211 | 0 |
Molecular Orbitals
| Calculation type | SP (Energy) |
| Method | RB3LYP |
| Basis Set | 6-31G (d,p) |
| Bond length / Å | 1.40 |
| Angle subtended | 120.0° |
| Final Energy / Hartree | -232.258 |
| Gradient | 0.00000000 |
| Dipole / Deby | 1.85 |
| Point group | C1 |
| Calculation time | 65.7s |
| Calculation File and type | .log file DOI:10042/22569 |
Below is the MO diagram for Benzene for Molecular Orbitals 7 - 30. LCAO approximations have been drawn from the calculated Molecular Orbitals.
A key observation from the molecular orbital diagram are the orbitals that are delocalized. These are MO's 17, 20, 21, 22, 23 and 27. All of these are orbitals that can be made using linear combination of pz orbitals to make pi orbitals. The orbitals are at the boundary of bonding and anti-bonding, of filled and unfilled. This is important as it is in these orbitals that the highest energy electrons will sit. These electrons determine the behavior and characteristics of the molecule. Given that there are 6 orbitals that have pi symmetry, three of which are below the zero point in energy line. Two electrons in each orbital results in a total of six electrons in the pi symmetry MO's. The aromaticity stems from these six electrons. So Benzene is aromatic because the total pi electron density of the system is equal to the number of atoms in the ring; six. This means that each atom contributes one electron filling all of the aromatic pi orbitals. This also explains why the addition of removal of an electron from the system will reduce the aromaticity substantially.
NBO analysis
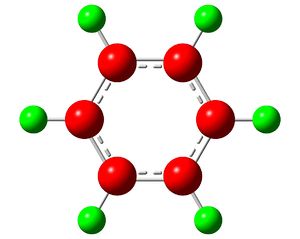
Using the .log file of the energy calculation the charge distribution was determined.
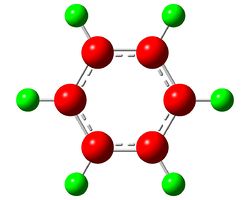
Below: The charge distribution diagram of Benzene. Red is negative and green is positive. The charge range is from +0.239 to -0.239.
Each Carbon has a charge of -0.239, and each Hydrogen +0.239. Overall the molecule is not charged. The preference for Carbons to be electron rich is not only due to the difference in electronegative but also the pi electron density that is associated with aromatics being tighty held in the ring.
The .log file showed a system where all electrons are either bonding or in the core. There are no lone pairs as expected. There was an interesting discovery on analyzing the file's section Second Order Perturbation Theory Analysis of Fock Matrix in NBO Basis.
What was found was that not all of the donor acceptor interactions were below 20kJmol-1. There were three neighboring pairs of interactions that had values of 20.42kJmol-1. These were the interactions between:
The bond C1-C6 and antibond C2-C3
The bond C1-C6 and antibond C4-C5
The bond C2-C3 and antibond C1-C6
The bond C2-C3 and antibond C4-C5
The bond C4-C5 and antibond C1-C6
The bond C4-C5 and antibond C2-C3
The importance of this is because these are all interactions that occur two atoms apart, every other bond, they are energetically significant and are due to the aromaticity of the system. This is best understood considering the Kekule structure of Benzene. It is therefore reasoned that repetition on another iteration could result in the 1-2, 3-4 and 5-6 interactions being involved.
Boratabenzene
To create this molecule one Carbon atom in Benzene was replaced with Boron with a negative charge
Optimisation
| Calculation type | FOPT (optimization) |
| Method | RB3LYP |
| Basis Set | 6-31G (d,p) |
| Bond length (B-C) / Å | 1.51 |
| Internal Angle (C-B-C) | 115.1° |
| Final Energy / Hartree | -219.021 |
| Gradient | 0.00015840 |
| Dipole / Deby | 2.85 |
| Point group | C1 |
| Calculation time | 3min 58.8s |
| Calculation File and type | .log file DOI:10042/22696 |
Click to see the optimized Boratabenzene molecule
The table below shows that the optimization has converged.
Item               Value     Threshold  Converged?
 Maximum Force            0.000159     0.000450     YES
 RMS     Force            0.000069     0.000300     YES
 Maximum Displacement     0.000878     0.001800     YES
 RMS     Displacement     0.000326     0.001200     YES
 Predicted change in Energy=-6.589451D-07
 Optimization completed.
    -- Stationary point found.
The calculated data, when compared to that of Benzene show some similarity, with a less negitive minimum energy. The bond is longer as the bond order is lower (single not conjugated). Finally the bond angle is distorted from an perfect hexagon's 120 degrees to a smaller value as the molecule is distorted by the Boron squeezing the shape as it is smaller.
Frequency calculations
| Calculation type | FREQ (frequency) |
| Method | RB3LYP |
| Basis Set | 6-31G (d,p) |
| Bond length (C-C) / Å | 1.51 |
| InternalAngle | 115.1° |
| Final Energy / Hartree | -219.021 |
| Gradient | 0.00015838 |
| Dipole / Deby | 2.85 |
| Point group | C1 |
| Calculation time | 5min 33.7s |
| Calculation File and type | .log file DOI:10042/22701 |
Below is the section from the .log file showing the low frequencies. Note that the line below showing the first of the real ones are all positive, showing that the molecule is at a minimum, not maximum.
Low frequencies ---  -13.1275    0.0003    0.0004    0.0010   15.0447   18.1653
 Low frequencies ---  371.3454  404.2334  565.2534
| Mode number | Wavenumber /cm-1 | Intensity | Mode number | Wavenumber /cm-1 | Intensity |
| 1 | 371 | 2 | 16 | 1085 | 3 |
| 2 | 404 | 0 | 17 | 1175 | 1 |
| 3 | 565 | 0 | 18 | 1180 | 1 |
| 4 | 568 | 0 | 19 | 1228 | 1 |
| 5 | 607 | 11 | 20 | 1333 | 31 |
| 6 | 711 | 3 | 21 | 1449 | 9 |
| 7 | 757 | 7 | 22 | 1463 | 14 |
| 8 | 815 | 0 | 23 | 1564 | 7 |
| 9 | 873 | 28 | 24 | 1592 | 40 |
| 10 | 906 | 0 | 25 | 2447 | 368 |
| 11 | 917 | 1 | 26 | 3028 | 109 |
| 12 | 951 | 0 | 27 | 3030 | 2 |
| 13 | 951 | 0 | 28 | 3060 | 378 |
| 14 | 960 | 2 | 29 | 3062 | 8 |
| 15 | 1012 | 4 | 30 | 3116 | 113 |
Molecular Orbital
| Calculation type | SP (Energy) |
| Method | RB3LYP |
| Basis Set | 6-31G (d,p) |
| Bond length / Å | 1.51 |
| Angle subtended | 115.1° |
| Final Energy / Hartree | -219.021 |
| Gradient | 0.00000000 |
| Dipole / Deby | 2.85 |
| Point group | C1 |
| Calculation time | 68.8s |
| Calculation File and type | .log file DOI:10042/22702 |
Interpretation of MO's follows later, as it is compared with other aromatic systems.
NBO analysis
Using the .log file of the energy calculation the charge distribution was determined.
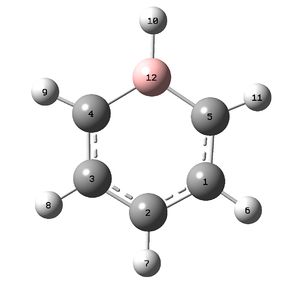
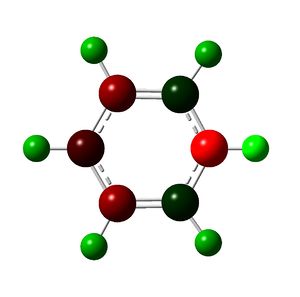
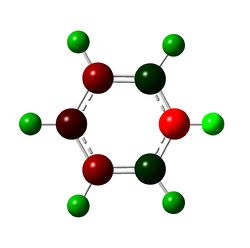
Below: The charge distribution diagram of Boratabenzene. Red is negative and green is positive and the charge range is from +0.588 to -0.588. Note that in all diagrams Boron is at the top of the ring. The left diagram shows the charges as a coloured heat map. The middle diagram shows the charges numerically and the diagram on the right is the numbering system of the molecule to aid reading of the analysis below the diagrams.
The NBO charge analysis shows that Boron is strongly positive in charge, with the negative charge spread over the carbon atoms, particularly those bonded to Boron. The six fold symmetry of Benzene has been broken. Note the negitive charge on the carbon opposite Boron. It has, as is discussed below, a lone pair on it. The negative charge is explained by this.
The NBO analysis revealed some interesting information when the Second Order Perturbation Theory Analysis of Fock Matrix in NBO Basis section is looked at. The points of interest are the presence of lone pairs; a lone pair on one Carbon and lone pair* on Boron.
The lone pair on Boron has a strong interaction with the C1-C5 bond (174.86kJmol-1) and C3-C4 bond (174.95kJmol-1).
These are additional strong, but less energetic interactions on the lone pair on Carbon 2 to the C1-C5 bond (71.49kJmol-1) and C3-C4 bond (71.51kJmol-1)).
Additionally there were strong interactions from the C3-C4 bond to lone pair* on Boron and C2 lone pair. These are 24.28 and 37.21kJmol-1 each respectivel. This interaction was replicated precisely with C1-C5 interacting with the same Boron LP* and Carbon LP. The energies are the same.
The significance of these energies is that there are, like with Benzene, three pairs of them, six overall. This is again indicative of a conjugated, and aromatic system. The larger energies compared to Benzene is due to the stronger orbital interactions.
Pyridinium
To create this molecule one Carbon atom in Benzene was replaced with Nitrogen with a positive charge
Optimization calculation and analysis
| Calculation type | FOPT (optimization) |
| Method | RB3LYP |
| Basis Set | 6-31G (d,p) |
| Bond length (N-C) / Å | 1.35 |
| Internal Angle (C-N-C) | 123.3° |
| Final Energy / Hartree | -248.668 |
| Gradient | 0.00003894 |
| Dipole / Deby | 1.87 |
| Point group | C1 |
| Calculation time | 3min 59.3s |
| Calculation File and type | .log file DOI:10042/22728 |
Click to see the optimized Pyridinium molecule
The table below shows that the optimization has converged.
 Item               Value     Threshold  Converged?
 Maximum Force            0.000065     0.000450     YES
 RMS     Force            0.000023     0.000300     YES
 Maximum Displacement     0.000826     0.001800     YES
 RMS     Displacement     0.000176     0.001200     YES
 Predicted change in Energy=-6.972574D-08
 Optimization completed.
    -- Stationary point found.
The calculated data, when compared to that of Benzene show some similarity, with a more negative optimized energy. The bond length is shorter by a small margin, evidence that the C-N bond is higher order that the benzene analogue. Finally the bond angle is distorted from an perfect hexagon's 120 degrees to a larger value as the molecule is distorted by the Nitrogen's size squeezing the shape.
Frequency Calculations
| Calculation type | FREQ (frequency) |
| Method | RB3LYP |
| Basis Set | 6-31G (d,p) |
| Bond length (N-C) / Å | 1.35 |
| Internal Angle (C-N-C) | 123.3° |
| Final Energy / Hartree | -248.668 |
| Gradient | 0.00003897 |
| Dipole / Deby | 1.87 |
| Point group | C1 |
| Calculation time | 5min 38.8s |
| Calculation File and type | .log file DOI:10042/22731 |
Below is the section from the .log file showing the low frequencies. Note that the line below showing the first of the real ones are all positive, showing that the molecule is at a minimum, not maximum.
Low frequencies ---   -7.2115   -0.0008   -0.0002    0.0008   17.3444   18.5499
 Low frequencies ---  392.4572  404.0614  620.4717
| Mode number | Wavenumber /cm-1 | Intensity | Mode number | Wavenumber /cm-1 | Intensity |
| 1 | 392 | 1 | 16 | 1200 | 3 |
| 2 | 404 | 0 | 17 | 1229 | 2 |
| 3 | 620 | 0 | 18 | 1300 | 3 |
| 4 | 645 | 0 | 19 | 1374 | 11 |
| 5 | 677 | 89 | 20 | 1416 | 3 |
| 6 | 748 | 82 | 21 | 1524 | 21 |
| 7 | 855 | 11 | 22 | 1580 | 48 |
| 8 | 882 | 0 | 23 | 1657 | 32 |
| 9 | 991 | 2 | 24 | 1677 | 34 |
| 10 | 1005 | 0 | 25 | 3225 | 0 |
| 11 | 1023 | 4 | 26 | 3241 | 0 |
| 12 | 1048 | 0 | 27 | 3243 | 11 |
| 13 | 1052 | 0 | 28 | 3253 | 21 |
| 14 | 1082 | 3 | 29 | 3254 | 0 |
| 15 | 1087 | 4 | 30 | 3569 | 158 |
Molecular Orbital Analysis
| Calculation type | SP (Energy) |
| Method | RB3LYP |
| Basis Set | 6-31G (d,p) |
| Bond length (N-C) / Å | 1.435 |
| Angle subtended (C-N-C) | 123.3° |
| Final Energy / Hartree | -248.668 |
| Gradient | 0.00000000 |
| Dipole / Deby | 1.87 |
| Point group | C1 |
| Calculation time | 72.4s |
| Calculation File and type | .log file DOI:10042/22762 |
Interpretation of MO's follows later, as it is compared with other aromatic systems.
NBO Analysis and Interpretation
Using the .log file of the energy calculation the charge distribution was determined.
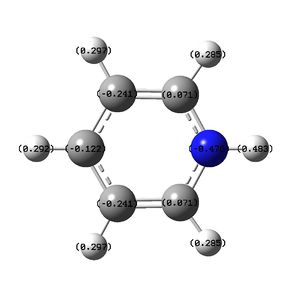
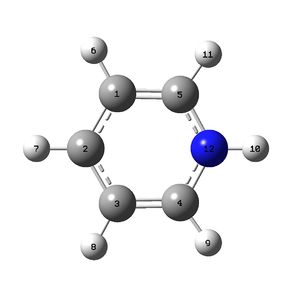
Below: The charge distribution diagram of Pyridinium. Red is negative and green is positive and the charge range is from +0.483 to -0.483. Note that in all diagrams Nitrogen is on the right of the ring. The left diagram shows the charges as a coloured heat map. The middle diagram shows the charges numerically and the diagram on the right is the numbering system of the molecule to aid reading of the analysis below the diagram.
The diagram shows a Nitrogen with negative charge on it, and surrounding atoms with positive charge. The electronegitivity of Nitrogen relative to Carbon and Hydrogen explains this phenomenon. The Carbon atoms further are near neutral, but slightly negative, due to the ability of Hydrogens to soak up the positive charge
The NBO analysis revealed some interesting information when the Second Order Perturbation Theory Analysis of Fock Matrix in NBO Basis section is looked at. The points of interest are five strong (defined by being above 20kJmol-1) interactions between bonds; three of them bonding to antibonding and one antibonding to antibonding. The interactions were:
The bond C1-C5 and antibond C2-C3 20.70kJmol-1
The bond C2-C3 and antibond C4-N12 47.07kJmol-1
The bond C4-N12 and antibond C1-C5 20.53kJmol-1
The antibond C4-N12 and antibond C1-C5 31.24kJmol-1
The antibond C4-N12 and antibond C2-C3 50.25kJmol-1
There were additional less strong interactions between bonds and antibonds. Overall these interactions are due to the aromatic nature of the molecule.
Borazine
To create this molecule alternate Boron and Nitrogen atoms were used to replace the Carbons in Benzene.
Optimization results
| Calculation type | FOPT (optimization) |
| Method | RB3LYP |
| Basis Set | 6-31G (d,p) |
| Bond length (N-C) / Å | 1.43 |
| Internal Angle (B-N-B) | 122.3° |
| Internal Angle (N-B-N) | 117.2° |
| Final Energy / Hartree | -242.685 |
| Gradient | 0.00017560 |
| Dipole / Deby | 0.00 |
| Point group | C1 |
| Calculation time | 4min 12.1s |
| Calculation File and type | .log file DOI:10042/22768 |
Click to see the optimized Borazine molecule
The table below shows that the optimization has converged.
Item               Value     Threshold  Converged?
 Maximum Force            0.000180     0.000450     YES
 RMS     Force            0.000079     0.000300     YES
 Maximum Displacement     0.000761     0.001800     YES
 RMS     Displacement     0.000300     0.001200     YES
 Predicted change in Energy=-8.685626D-07
 Optimization completed.
    -- Stationary point found.
The calculated data, when compared to that of Benzene show some similarity, with a more negative optimized energy. The bond length is very similar, evidence that even though chem draw has shown a single bond the system may have similarities to Benzene. Finally the bond angle is distorted from an perfect hexagon's 120 degrees. This is different to Benzene where angles are all the same.
Frequency Calculation
| Calculation type | FREQ (frequency) |
| Method | RB3LYP |
| Basis Set | 6-31G (d,p) |
| Bond length (N-C) / Å | 1.35 |
| Internal Angle (C-N-C) | 123.3° |
| Final Energy / Hartree | -242.685 |
| Gradient | 0.00017559 |
| Dipole / Deby | 0.00 |
| Point group | C1 |
| Calculation time | 5min 30.3s |
| Calculation File and type | .log file DOI:10042/22769 |
Below is the section from the .log file showing the low frequencies. Note that the line below showing the first of the real ones are all positive, showing that the molecule is at a minimum, not maximum.
 Low frequencies ---   -7.2243   -0.0004    0.0008    0.0011    9.7696   12.3201
 Low frequencies ---  288.7628  290.6437  404.2370
| Mode number | Wavenumber /cm-1 | Intensity | Mode number | Wavenumber /cm-1 | Intensity |
| 1 | 289 | 0 | 16 | 1053 | 0 |
| 2 | 291 | 0 | 17 | 1081 | 0 |
| 3 | 404 | 24 | 18 | 1081 | 0 |
| 4 | 525 | 1 | 19 | 1246 | 0 |
| 5 | 525 | 1 | 20 | 1314 | 0 |
| 6 | 708 | 0 | 21 | 1400 | 10 |
| 7 | 710 | 0 | 22 | 1401 | 10 |
| 8 | 732 | 61 | 23 | 1492 | 495 |
| 9 | 864 | 0 | 24 | 1492 | 495 |
| 10 | 929 | 0 | 25 | 2637 | 284 |
| 11 | 929 | 0 | 26 | 2637 | 284 |
| 12 | 938 | 235 | 27 | 2647 | 0 |
| 13 | 945 | 0 | 28 | 3643 | 0 |
| 14 | 945 | 0 | 29 | 3645 | 40 |
| 15 | 945 | 0 | 30 | 3645 | 40 |
Molecular Orbital Analysis
| Calculation type | SP (Energy) |
| Method | RB3LYP |
| Basis Set | 6-31G (d,p) |
| Bond length (N-B) / Å | 1.435 |
| Angle subtended (N-B-N) | 117.2° |
| Angle subtended (C-N-C) | 122.8° |
| Final Energy / Hartree | -242.685 |
| Gradient | 0.00000000 |
| Dipole / Deby | 0.00 |
| Point group | C1 |
| Calculation time | 66.7s |
| Calculation File and type | .log file DOI:10042/22794 |
Interpretation of MO's follows later, as it is compared with other aromatic systems.
NBO Interpretation
Using the .log file of the energy calculation the charge distribution was determined.
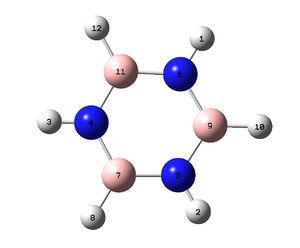
Below: The charge distribution diagram of Borazine. Red is negative and green is positive and the charge range is from +1.103 to -1.103. The left diagram shows the charges as a coloured heat map. The middle diagram shows the charges numerically and the diagram on the right is the numbering system of the molecule to aid reading of the analysis below the diagram.
The diagram shows Nitrogen with negative charges and Boron with positive. This follows the greater electronegitivity of Nitrogen relative to Boron. Nitrogen bound Hydrogens are positive while those bonded to Boron are only slightly negative.
The NBO analysis revealed some interesting information when the Second Order Perturbation Theory Analysis of Fock Matrix in NBO Basis section is looked at. The points of interest are three strong (defined by being above 20kJmol-1) interactions between bonds; all at 37.59kJmol-1 ±0.01kJmol-1 The interactions were:
The bond N4-B7 and antibond N6-B11
The bond N5-B9 and antibond N4-B7
The bond N6-B11 and antibond N5-B9
These interactions are all one bond separated and so can be attributed to the aromaticity that the system develops.
Comparison of Aromatics
In this section the four aromatics studied will be compared and contrasted on the data acquired.
NBO
The explanation for the variation is simply the differernt properties of the heteroatoms compared to Carbon. The addition of a formal charge only varies the net charge, not how large individual atoms have on them. The least electrophilic atom, Boron, is less able, energetically, stabilize electrons, it is more stable with a positive charge than negative. So relative to Carbon it is electron donating, and is positive in all structures it is found in. On the other side is Nitrogen. It is more electrophilic than Carbon or Boron. As a result it prefers Negative charge. In Pyridinium the negative charge held on the ring is surround by two positive Carbons to help stabilize it. Given this behavior the opposite might be predicted for Boron, and indeed the Boratabenzene has, surronding the positive Boron, two strongly positive Carbons.
Finally in consideration of Borazine the stability of the system is explained from the principle of wanting to surround positive boron with negative charge and negative Nitrogen with positive charge. In Borazine the alternating atoms of Boron and Nitrogen serve to stabilise each other, and of course have the same electronic structure of Benzene.
Molecular Orbital Comparison
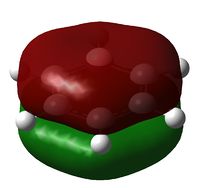
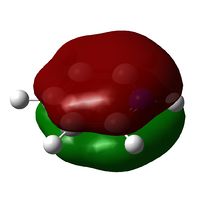
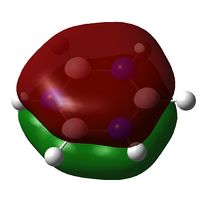
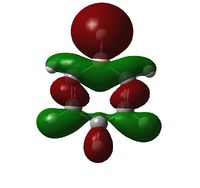
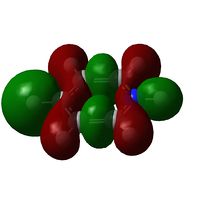
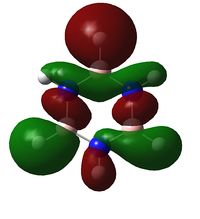
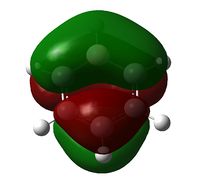
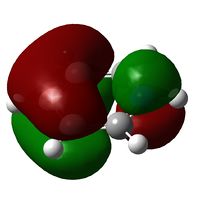
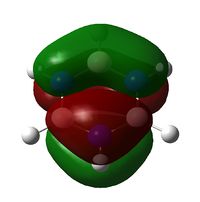
The discussion of MO's of the four aromatics will centre around three Molecular Orbitals; the all pi bonding orbital (MO17), the sigma orbital one above the all pi bonding system (MO19) and finally the pi orbital with three orbitals in one phase, and three orbitals in another (MO20). These are examined in the table below.
| Molecule | Benzene | Boratabenzene | Pyridinium | Borazine |
| Molecular Orbital | 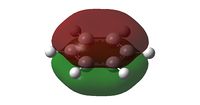 |
 |
 |
|
| LCAO | File:CRON MO17.pdf | File:CRON MO17.pdf | File:CRON MO17.pdf | File:CRON MO17.pdf |
| Energy / Hartree | -0.3600 | -0.1321 | -0.6406 | -0.3614 |
| Comparison | Even distribution of pi electrons above and below molecule | Electron distribution even | Electron distribution very slightly weighted onto Nitrogen (more electronegative element) | Uneven electron distribution; larger on Nitrogen than Boron (More electronegative element can stabilize more charge) This gives a lower order of symmetry shape (principle axis C3 not C6) |
| Molecule | Benzene | Boratabenzene | Pyridinium | Borazine |
| Molecular Orbital | 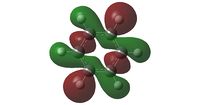 |
 |
 |
|
| LCAO | File:CRON Benzene MO19.pdf | File:CRON Boratabenzene MO19.pdf | File:CRON Pyridinium MO19.pdf | File:CRON Borazine MO19.pdf |
| Energy / Hartree | -0.3396 | -0.09171 | -0.5743 | -0.3198 |
| Comparison | Top and bottom lobes equal in size. Electron distribution is even across the four green Hydrogens. | Boron has larger lobe (top) than Carbon opposite (bottom) due to larger electron cloud. Also note the reduced electron density on Hydrogens adjacent to Boron | Large lobe on Carbon opposite Nitrogen (right) that has a smaller lobe than seen with Benzene analogue. There is greater electron density, (lots of charge in not much space) and all Hydrogens are fully covered by MO's at their current probability distribution. | As expected from the previous two we see Boron with large lobes and Nitrogen with small. Nitrogen has larger orbitals on Hydrogens adjacent and Boron smaller on adjacent Hydrogen atoms |
| Molecule | Benzene | Boratabenzene | Pyridinium | Borazine |
| Molecular Orbital | 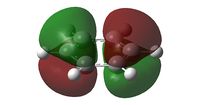 |
 |
 |
|
| LCAO | File:CRON Benzene MO20.pdf | File:CRON Boratabenzene MO20.pdf | File:CRON Borazine MO20.pdf | File:CRON Boratabenzene MO20.pdf |
| Energy / Hartree | -0.2469 | -0.03493 | -0.5085 | -0.2760 |
| Comparison | Two phases of pi electrons, that are perfectly even in distribution. Both sides are the same size. | Uneven distribution with larger orbitals on Boron than the more electronegative Carbon atoms | The Nitrogen (right) has a much smaller orbital size than the analogous benzene, with the other side without a heteroatom being nearly equal in size | The system shows two similarly sized orbital halves with one slightly smaller than the other. The smaller side is the side with Nitrogen in the centre, and two outer Boron, while the larger of the two has Boron central and Nitrogen outer. |
The analysis of these three orbitals can now be more fully explained; a key observation in all three was Nitrogen having smaller orbitals than Carbon and Boron larger. This makes sense as going across a period in the periodic table (as one would from Boron to Nitrogen) nuclear charge increased while the valence orbitals remain the same. Larger nuclear charge draws the orbitals in tighter and a greater electron density is achieved with less diffuse orbitals.
A second trend is in the energy of the orbitals. All of the compared orbitals saw the same trend; more negative energies as the heteroatom transitioned from Boron to Carbon to Nitrogen. This is exactly what the idea of electronegitivity is able to predict. The more electronegative element lowers the energy of the system. It is noteworthy that when both Nitrogen and Boron were present in Borazine the opposing relative effects on electrons broadly cancelled out. Energies were broadly similar to benzene, with one marginally higher and two lower.
The lowering in energy of the orbitals with the inclusion of more electronegative elements can be considered from the point of view of the MO diagram. the more electronegative fragment would be lower in energy as it's more able to accept electrons, and hence lowers the bonding orbitals of all those that result from it, and raise antibonding orbitals.
Another key point for the MO's of all four is the degeneracy of Orbitals. Degeneracy was highest for Benzene, which has the highest order of symmetry, followed by Borazine. The Pyridinium and Boratabenzene have the same level of degeneracy, and are symmetrically similar. So degeneracy, as might be expected, is related to the level of symmetry.
The order of MO's were broadly similar and while there were isolated changes in number, the broad structure, especially around the HOMO/LUMO structure was very similar in having an all pi orbital, followed by two degenerate sigma orbitals, then two half pi orbitals, another pair of pi orbitals, degenrate, with less bonding character, then another two degenerate sigma orbitals, finally the pi fully antibonding orbital. All structures showed this ordering that is the classical delocalized system arrangement, here quantum mechanics has shown it to be an excellent model for understanding the fundamental principles!
What is most exciting about the calculations performed is the ability of quantum mechanics being solved with a DFT model and a relatively poor basis set of 6-31G (d,p) to give relativly accurate information about the molecule and to be able to give enough information to test an empirically based model of aromaticity and show it to be a reasonable approximation.

