Rep:Mod:py714
The Free Energy and Thermal Expansion of MgO
Introduction
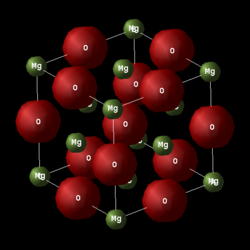
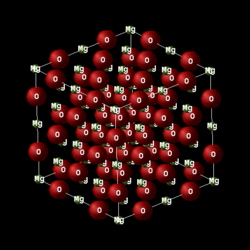
Magnesium oxide has a crystal structure made up of Mg2+ cations and O2- anions, which are held together by ionic bonds. The lattice of MgO is formed by translation of the unit cell, which can be either primitive or conventional. A primitive unit cell is the simplest form of representation of a crystal, and in the case of MgO, it is a rhombic structure containing 2 atoms. The conventional cell, however, provides a clearer visual representation of the crystal’s structure, which can be defined as a face-centred lattice (FCC) made up of 8 atoms. For calculations involving the molecular dynamics simulation, a supercell of MgO containing 32 MgO units is used for reasons explained further on.
| Primitive cell | Conventional cell | Super cell |
|---|---|---|
 |
 |
|
The focus of this laboratory is on calculating the energy and vibrations of a crystal of MgO. Firstly, the vibrational energy levels of MgO are calculated. Then they are used to compute the free energy of the crystal and to investigate how the material expands on heating. The thermal expansion of MgO is explored using two distinct simulations: a quasi-harmonic approximation (LD) and a molecular dynamics simulation (MD). Both methods are used to calculate a value for the coefficient of thermal expansion of MgO, , which is given by . The results produced by the LD and MD methods are compared below.
The quasi-harmonic approximation accounts for quantum effects and is able to calculate the vibrational frequencies of a solid directly, however it assumes that the normal modes of vibration are harmonic oscillations [1]. The molecular dynamics simulation, on the other hand, ignores quantum effects but it accounts for anharmonicity and large amplitude vibrations [2]. Therefore, LD can be regarded as a static tool for the solid state[1], whereas MD assumes that the atoms are always in constant motion and contradicts the concept of zero-point energy (a natural consequence of quantum mechanics) present in the quasi-harmonic approximation.
Methodology
DLVisualize is a graphical user interface for visualising the structures and properties of materials. It supports the General Utility Lattice Program (GULP) which was used for performing single point, optimisation, and molecular dynamics calculations on MgO.
Results and Discussion
Phonon modes of MgO
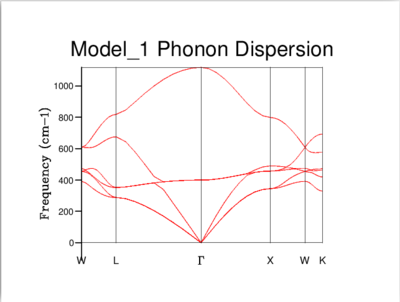
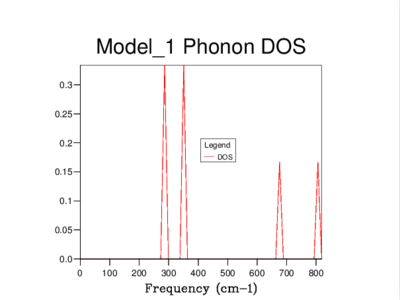
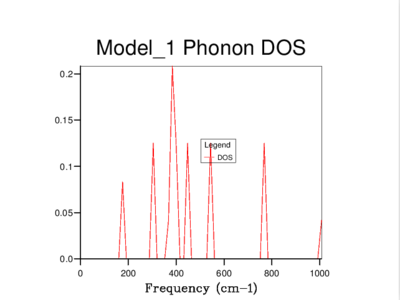
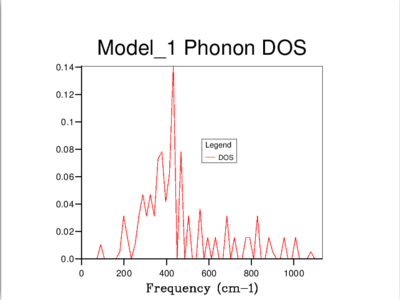
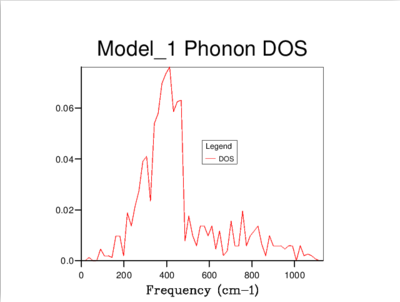
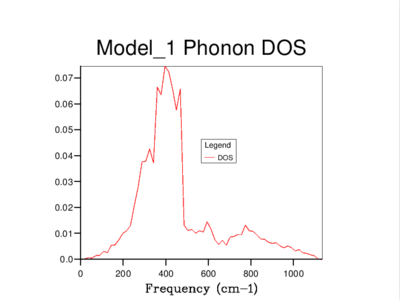
Every vibration in a crystal can be labelled with a k-vector, which is related to the amplitude and wavelength of that vibration. As can be seen below, a phonon dispersion curve plots vibrational (phonon) frequencies against k-vectors. On the other hand, a density of states curve summarizes the dispersion curve because it is in average over all k-points and it gives the number of vibrational modes at each frequency.
| Phonon dispersion | 1x1x1 | 2x2x2 | 4x4x4 |
|---|---|---|---|
 |
 |
 |
|
| 8x8x8 | 16x16x16 | 32x32x32 | 64x64x64 |
 |
 |
 |
|
The density of states of the 1x1x1 grid was computed for a single k-point, L, and it shows four peaks. The Log File for the calculation also shows the reciprocal coordinates (, , ) which are indicative of the high-symmetry k-point, L. For a unit cell with two atoms in 3D, we would expect to see six vibrational bands or branches, which is in fact what the phonon dispersion graph above shows. Note that there are two sets of two degenerate branches in the dispersion graph which explains why there are only four peaks in the DOS curve for a 1x1x1 grid, and two peaks which are double in height.
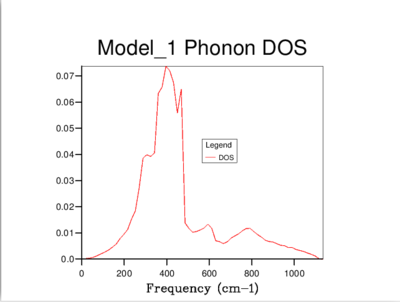
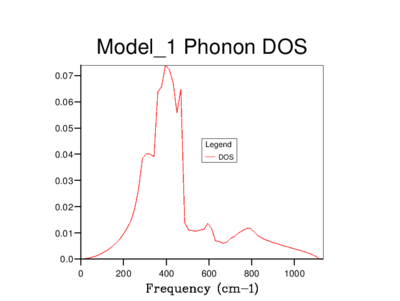
It's clear that the density of states varies with grid size, and that the larger the grid size, the smoother the DOS curve. This is because as we enlarge the grid size, we are sampling more k-points and gaining access to more vibrational bands at those points. It should be noted that even though the DOS tells us about the number of vibrational bands at a particular frequency, it gives no information about their populations.
A 16x16x16 grid provides a reasonable approximation to the density of states, however ultimately it was decided that the optimum size is 32x32x32 as it results in a more continuous curve which represents the phonon vibrations better. A denser grid of k-points, 64x64x64, was also sampled but it didn't provide significantly different results to those obtained from the 32x32x32 grid. Therefore, due to the time and computational constraints associated with the 64x64x64 grid, it was decided that the 32x32x32 grid would be used for the thermal expansion calculations carried out later on.
The 32x32x32 grid is suitable for calculations on similar crystal structures such as CaO whose lattice constant is 4.8105 Å[3] (cf MgO's lattice constant, 4.212 Å[4]). CaO's lattice constant is slightly larger than MgO's (by around 14%) which means that a slightly smaller grid size can be used in the calculations, around 28x28x28. However for other crystal structures, the optimal grid size for MgO won't be appropriate. For example, Faujasite has a lattice constant of 24.25 Å[5] which is around 6 times larger than that of MgO; a larger unit cell in real space gives a smaller cell in reciprocal space which requires a smaller k-point grid. Therefore for Faujasite, a smaller shrinking factor than 32 should be used. Similarly, for lithium we would need to use a smaller grid size. Describing the bonding in a metal as a lattice of positive metal cations surrounded by a sea of negative electrons can justify why that is the case. Clearly the vibrating metal cations repel one another, however the delocalised electrons in the lattice shield the cations and reduce the repulsive forces between them. This leads to a smaller energy dispersion in the vibrational structure of the metal, which means that fewer k-points need to be sampled and a smaller grid size can be used.
Computing the free energy - the Harmonic approximation
The free energy for an increasing grid size was calculated within the quasi-harmonic approximation, and its converge to an infinite grid was monitored. The free energy is a sum over all the vibrational bands of an infinite crystal, however a calculation on an infinite crystal cannot be carried out. Therefore, the minimum number of k-points required for an accurate answer has to be determined. The results obtained are tabulated below.
| Grid size | A, eV | Absolute ΔA, eV |
|---|---|---|
| 1x1x1 | -40.930301 | |
| 2x2x2 | -40.926609 | 3.692x10⁻³ |
| 4x4x4 | -40.92645 | 1.59x10⁻⁴ |
| 8x8x8 | -40.926478 | 2.8x10⁻⁵ |
| 16x16x16 | -40.926482 | 4x10⁻⁶ |
| 32x32x32 | -40.926483 | 1x10⁻⁶ |
| 64x64x64 | -40.926483 |
Clearly the grid size affects the accuracy of the answer, however a compromise has to be struck between accuracy and calculation time. The table above shows that convergence to the infinite grid is reached for a shrinking factor of 32. A 62x62x62 grid was also investigated, however the calculation took significantly longer to run and it provided the same answer as a 32x32x32 grid. As can be seen by the calculated absolute changes in free energy in the table, a grid size of 4x4x4 provides accuracy to 1 meV and 0.5 meV, and a grid size of 8x8x8 is appropriate for calculations accurate to 0.1 meV.
The free energy is related to the vibrational structure of a material. For calculations on CaO, the optimal grid size for MgO, 32x32x32, can be used. This is because their vibrational structures are similar. A smaller grid size would be required for Faujasite, because its reciprocal cell is smaller than MgO's. In a metal, such as lithium, the dispersion in energy of the vibrational structure is smaller than that in an insulator, such as MgO. This is because in an ionic system, the electrons are localised around the ions, whereas in a metal, the electrons are delocalised in the metal lattice. This delocalisation of electrons minimises the repulsive forces between the vibrating lithium cations in the lattice, leading to a smaller energy dispersion. Therefore, a smaller grid size than 32x32x32 can be used to obtain an accurate answer for Li.
The thermal expansion of MgO
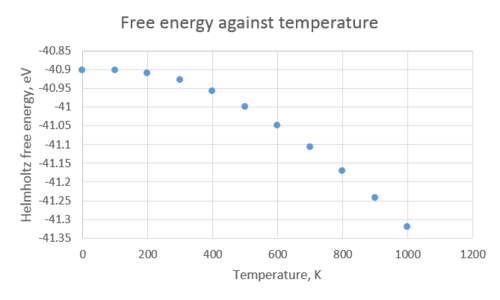
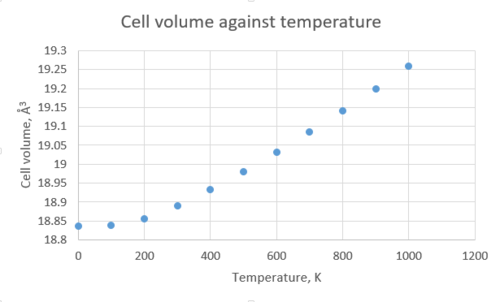
The structure of MgO was optimised with respect to the free energy at different temperatures within the quasi-harmonic approximation. Based on the previous investigations presented above, a shrinking factor of 32 was chosen for the k-space sampling for the calculation of the thermal expansion of MgO. The tabulated data below shows that the free energy and lattice constant vary with temperature.
| Temperature, K | Free energy, eV | Lattice constant, Å | Cell volume, Å3 |
|---|---|---|---|
| 0 | -40.90190629 | 2.986563 | 18.836496 |
| 100 | -40.90241981 | 2.986657 | 18.838266 |
| 200 | -40.90937745 | 2.987604 | 18.856201 |
| 300 | -40.92812483 | 2.98939 | 18.890025 |
| 400 | -40.95859432 | 2.991629 | 18.932507 |
| 500 | -40.99943614 | 2.994134 | 18.98011 |
| 600 | -41.04931565 | 2.99682 | 19.031221 |
| 700 | -41.1071195 | 2.999643 | 19.085057 |
| 800 | -41.17189216 | 3.002587 | 19.141316 |
| 900 | -41.24301846 | 3.005634 | 19.199638 |
| 1000 | -41.31984872 | 3.008783 | 19.260042 |
| Free energy against temperature | Lattice constant against temperature | Cell volume against temperature |
|---|---|---|
 |
 |
|
The Helmholtz free energy decreases, i.e. becomes more negative, as the temperature increases. If we refer to the equation for free energy, , it is clear to see why that is the case - as the temperature increases, the second term in the equation becomes larger, and the free energy becomes more negative. The lattice parameter, on the other hand, increases as the temperature increases, and therefore the volume does too. As the temperature increases, the average atomic vibration amplitude also increases, and in an anharmonic potential, this leads to an increase in the average interatomic separation[6]. Therefore for an asymmetric potential, increasing the temperature leads to longer bond lengths, and we call this thermal expansion. In simpler terms, increasing the temperature causes the atoms in a solid to vibrate more, and the faster they vibrate, the more the spacing between them is elongated. Conversely, if we were to consider a diatomic molecule with an exactly harmonic potential, its bond length will be unaffected by an increase in temperature. That is because in a harmonic oscillator the average interatomic distance remains constant and thus no thermal expansion is observed.
If we take the gradient of the most linear part of the 'Cell volume against temperature' graph, we obtain a straight-line equation of the form . Now if we substitute the gradient into the equation for calculating , we obtain a value for the thermal expansion coefficient of 2.651647x10⁻⁵K-1. The literature value for is 3.996x10⁻⁵K-1 [7], for a temperature range from 300K to 1000K. The discrepancy between the two values comes from the limitations of the quasi-harmonic approximation method; even though the calculation takes into account quantum effects, it completely disregards vibrational anharmonicity. Therefore as the temperature approaches the melting point of MgO (3125 K[8]), the phonon modes are not representative of the actual motion of the ions in the lattice.
Molecular Dynamics
The change in volume with respect to temperature was also studied with a molecular dynamics simulation. To carry out this calculation, a supercell containing 32 units of MgO was used. MD aims to reproduce the actual vibrational motion of the atoms in MgO, therefore carrying out an MD calculation on a unit cell would result in all cells in the crystal moving perfectly in phase, which is physically inaccurate. Ideally, MD calculations should be carried out on very large cells in order to obtain a true representation of the atomic motion, however MD is an expensive computational method, therefore we have to strike a compromise between accuracy and efficiency of calculation, so a cell of 32 MgO units was chosen. The change in cell volume with temperature is shown in the table below.
| Temperature, K | Cell volume, Å3 | Primitive cell volume, Å3 |
|---|---|---|
| 100 | 599.552364 | 18.73601138 |
| 200 | 600.513626 | 18.76605081 |
| 300 | 602.899441 | 18.84060753 |
| 400 | 604.18888 | 18.8809025 |
| 500 | 605.731599 | 18.92911247 |
| 600 | 607.831884 | 18.99474638 |
| 700 | 609.326722 | 19.04146006 |
| 800 | 611.740823 | 19.11690072 |
| 900 | 613.477023 | 19.17115697 |
| 1000 | 615.053657 | 19.22042678 |
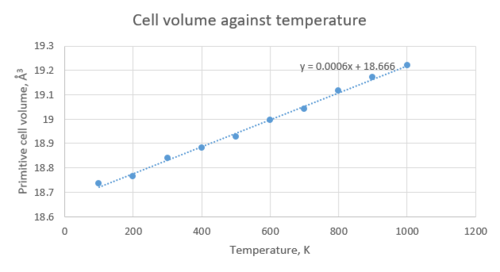
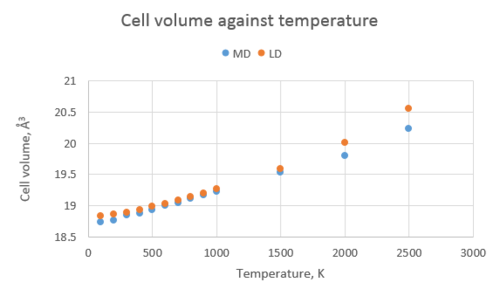
The expansion coefficient predicted by MD is 3.202389174x10⁻⁵K-1. This differs from the value for calculated using LD, but is in fact closer to the value reported in literature. MD is more accurate because it allows the crystal to evolve in time according to Newton's second law, . Also, unlike LD, MD does not break down at high temperatures and allows for the eventual breaking of bonds (in LD, the material would just continue to expand indefinitely because of the quantum approximations involved in the calculation).
Plotting the results from both calculations on the same graph allows for better comparison. It can be seen that the cell volume increases more rapidly with temperature in the LD case than in the MD case because higher-order anharmonic terms, which are the result of intrinsic phonon interaction, have been ignored[9]. On the other hand, MD calculations become accurate at high temperatures because atomic motion can then be regarded as classical.
Conclusion
It was determined that the minimum grid size for a reasonable approximation to the density of states for a magnesium oxide crystal within the harmonic approximation is 32x32x32. This grid size was also suitable for optimizing the crystal structure with respect to the free energy at a number of temperatures. Furthermore, the thermal expansion coefficient of MgO was determined using two computational methods: the quasi-harmonic approximation (LD) and the molecular dynamics simulation (MD), which gave values for of 2.651647x10⁻⁵K-1 and 3.202389174x10⁻⁵K-1 respectively. The quasi-harmonic approximation and the molecular dynamics simulation should not be regarded as competing computing techniques but instead they should be seen as two complementary methods [2]. We can use LD calculations, which require less time and computational power, when the anharmonicity of the vibrations is not significant, i.e. at lower temperatures, and we can use MD calculations at higher temperatures when the LD method breaks down and becomes inaccurate. Using a molecular dynamics simulation close to the melting point of a solid is more suitable because as we approach the melting point, LD begins to significantly overestimate the cell volume.
References
- ↑ 1.0 1.1 S. Parker, N. de Leeuw, E. Bourova and D. Cooke, Reviews in Mineralogy and Geochemistry, 2001, 42, 63-82
- ↑ 2.0 2.1 R. Della Valle and E. Venuti, Physical Review B, 1998, 58, 206-212
- ↑ P. Miedema, H. Ikeno and F. de Groot, Journal of Physics: Condensed Matter, 2011, 23, 145501
- ↑ S. Seal, Functional nanostructures, Springer, New York, 1st edn., 2008
- ↑ M. Suzuki, Fundamentals of Adsorption, Elsevier, Burlington, 1st edn., 1993
- ↑ web.mit.edu, http://web.mit.edu/mbuehler/www/SIMS/Thermal%20Expansion.html, (accessed February 2017)
- ↑ O. Anderson and K. Zou, Journal of Physical and Chemical Reference Data, 1990, 19, 69-83
- ↑ B. Kumar, S. Rodrigues and L. Scanlon, Journal of The Electrochemical Society, 2001, 148, A1191
- ↑ M. Matsui, G. Price and A. Patel, Geophysical Research Letters, 1994, 21, 1659-1662
