Rep:Mod:pp2814mgo
The Free Energy and Thermal Expansion of MgO
by Patricia Poths
Introduction
This computational lab focuses on the simulation of the thermal expansion of the MgO crystal lattice. This is modeled on Linux using GULP (General Utility Lattice Program). Two different approaches were used to approach the simulation; Quasi-Harmonic Approximation, and Molecular Dynamics. This lab is meant to act as an introduction to computational modeling, as well as to compare the computed results for both types of modeling. A fundamental aspect to this computation is the understanding of k-space. K-space is the Fourier transform of the real lattice points, which makes it easier to treat the structure mathematically to find the properties of the material. K values can also be called the wave vector- this allows us to extract information from the system. [1]
Quasi-Harmonic Approximation:
The quasi-harmonic approximation is a compromise between the harmonic approximation and reality. While a simple parabola (harmonic model) can model phonons close to equilibrium, the further you go from equilibrium, the greater the anharmonicity of the real system. The quasi-harmonic approximation uses a base parabola for the phonon approximation, and adds some anharmonic behavior by making the phonon behavior volume-dependent, making the approximation hold for a wider range of volumes.
The above equation is used in the quasi-harmonic approximation to find the Helmholtz free energy. This is done using the vibrational modes to approximate the zero-point energy (the residual energy left at 0K) and entropy, which are combined to find the approximate Helmholtz free energy of the system, using the phonon modes.
Molecular Dynamics:
The molecular dynamics approach involves giving all atoms in the system velocities, scaled to be appropriate for the temperature input, and then computes the force on each atom, and from that the accelerations. Then a series of timesteps are performed, each time step 1 femptosecond to ensure that enough samples are taken. with the velocities of each atom updating with each timestep. This system continues until the behavior stops fluctuating dramatically, and properties are extracted from the system using the time-averaged behavior focused on their trajectories and velocities and forces experienced. This requires a greater cell size than the quasi-harmonic approximation; a unit cell would model only the situation where all atoms were moving in phase. The computation used a cell with 32 MgO units, to compromise between speed and accuracy. This would correspond to a grid size that is the cube root of 32 (based on the fact that a cell with 8 MgO units, or two in each dimension, would have a k-value grid of 2x2x2), which would be 3.17- obviously not an exact calculation.
Results and Discussion:
An Initial Calculation on MgO
The initial calculation of MgO involved looking at the unit cell and undertaking a GULP calculation of the lattice parameters. The primitive unit cell parameters were found to be a=b=c= 2.9782 Angstrom, with angles α=β=γ= 60 degrees. This rhombohedron does not give an ideal image of the wider crystal structure. Instead, a cubic conventional cell can be used with sides of length 4.212 Angstrom can be used to show the relative positions of the atoms to better effect. The total lattice energy of the crystal was calculated to be -41.0753 eV
Calculating the phonon modes of MgO
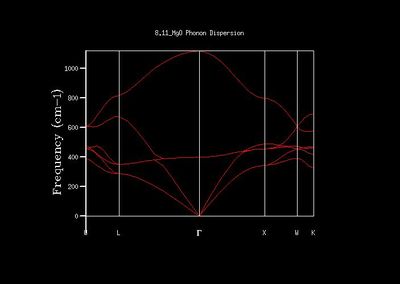
The next step was to calculate the phonon dispersion for MgO using GULP. This produced the image that can be seen adjacent. There are 6 branches that can be observed, due to the fact that the primitive cell has 2 atoms, and 3 dimensions (x,y,z) in this model. A total of 50 points (aside from the symmetry points W, L, Γ, X, W, and K) are plotted to give the curve below. The phonon vibration frequency ω is plotted against the wave vectors, or k-values, which will allow us in the future to extract information about the number of states we have, along with other physical information.
The density of states (DOS) graph was then plotted for different grid sizes (increasing shrinking factor), with increasing numbers of k-values sampled to ultimately get a continuous curve that displays at which frequencies there are more states. This is important, as it tells you at what energy the most states are (but not if they are filled, which is not important in this exercise.[1]
The dispersion curve is related to the DOS most obviously in that the flatter the dispersion curve, the greater the number of corresponding states; hence there is a higher DOS. The DOS is a measure of the number of states in a given interval relative to the number of states elsewhere. Hence the dispersion is related to the DOS, since the distribution of the very large (practically infinite) number of 'orbitals' is dictated by the dispersion function.[2]
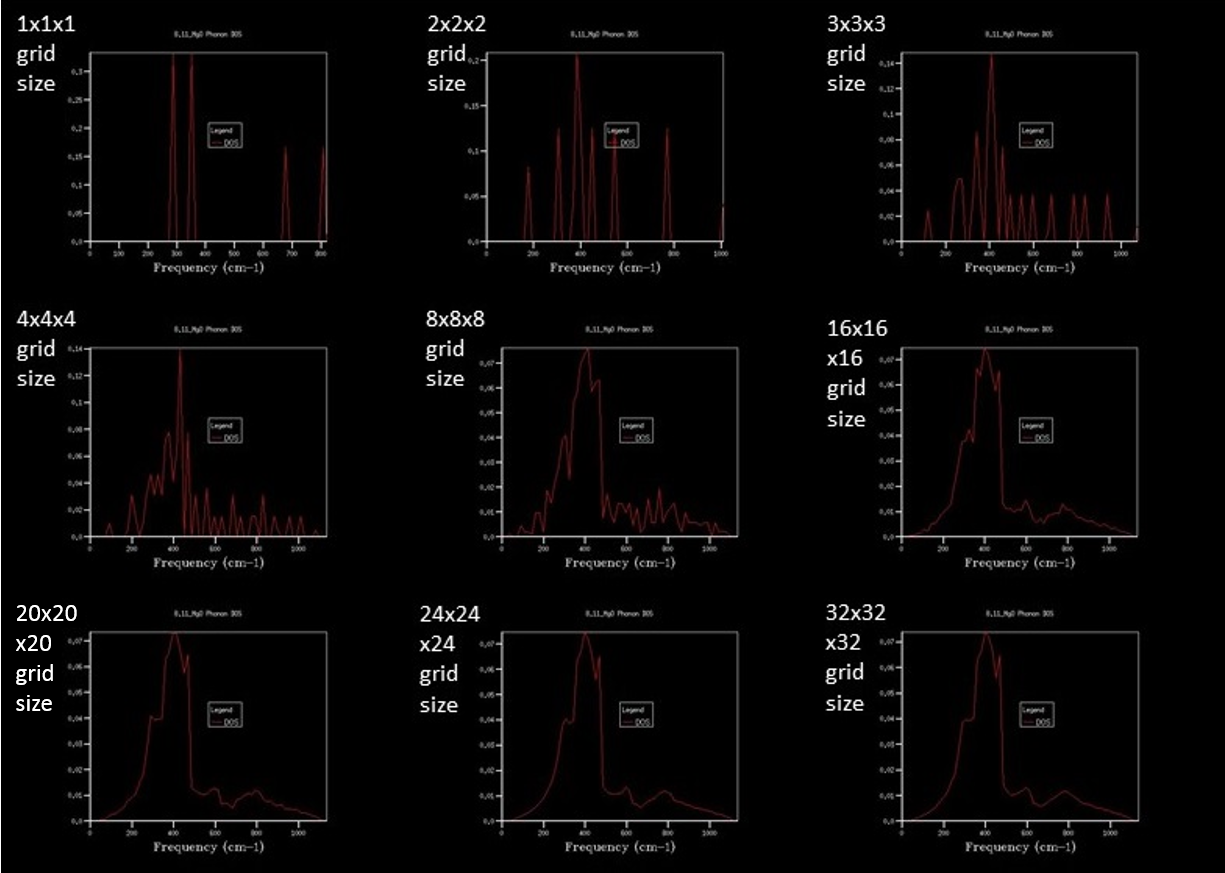
When comparing the DOS graph to the phonon dispersion, it soon became clear that the single k-point that the 1x1x1 DOS graph showed was of the K-point associated with the symmetry point L. The first two peaks at just under 300 cm-1 and ~ 350 cm-1 were twice as high as the remaining two peaks due to the degeneracy of the branches at that point, as observed on the phonon dispersion graph. This agreed with the Log file, which states that the coordinates of the k-value were (0.5, 0.5, 0.5), which corresponds to the symmetry point L.
As the grid size for the DOS increases, the more k-values in reciprocal space are included in the DOS calculations, and the more information can be included in the DOS graph. Essentially, the more points there are in the grid, the more locations in the dispersion relation can be sampled and displayed relative to one another.
After 8x8x8, the grid size is increased by 8 each time to keep the same grid points, but just to add more around the existing ones. Between 16x16x16 and 24x24x24 there is some change, but relatively minimal change. However between 24x24x24 and 32x32x32 there was virtually no visible change, meaning that around 24 cubed is the ideal grid size to show the full DOS with minimal grid points.
The optimal simple computational grid size (24) DOS looks the pretty much the same as the higher-grid-size DOS, with the main difference that it takes more time to calculate the higher grid numbers. The smaller DOS grid sizes have a spikier shape, which indicates that there is more noise in relation to the actual DOS, which is minimized by a greater sampling size, as is to be expected in most cases of data collection.
Using the phonon modes, it is possible to calculate the Helmholtz free energy for the system, using , where omega is related to the vibrational frequency of the phonon states, which are calculated with the dispersion and DOS functions. The shrinking factor obviously has an impact on the accuracy of the energy.
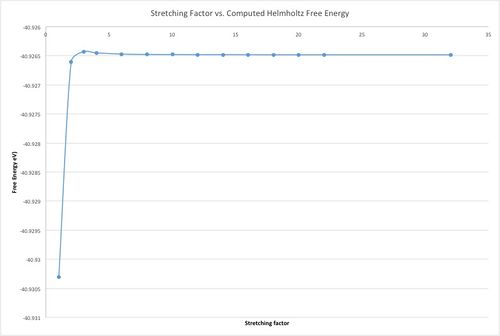
As can be seen by the table and the graph adjacent, shrinking factor definitely has an impact on the accuracy of the computed Helmholtz free energy. With the optimum value found at a grid size of 32, when one wants to find a suitable compromise between computing power and accuracy, one must look at ΔA, which is the difference between the energy at 32 grid size, and the energy at the given grid size. As shown by the table, ΔA decreases as the grid size increases. For accuracy to 6 d.p. compared to the optimal energy from 32 grid size, a grid size of 18 is the ideal compromise between computing power, time and accuracy. Therefore a grid size of 18x18x18 was used for the thermal expansion of MgO, which follows.
The same optimal grid size would probably work for a comparable oxide, e.g. CaO, which has very similar lattice parameters to MgO. A crystal with a much larger lattice, for example a zeolite, would require a smaller grid size in k-space to sample a similar number of lattice points, due to the reciprocal nature of k-space to real space. The opposite would be true for a crystal with much smaller lattice parameter, requiring a larger grid size to accurately sample the lattice and glean accurate information.
The Thermal Expansion of MgO
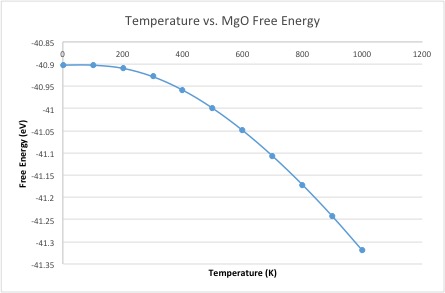
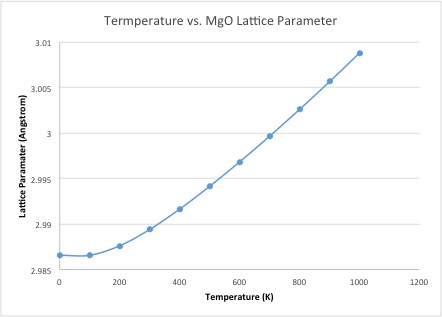
The curve of the free energy vs temperature shows the free energy getting more negative with increasing temperature. This means the system has more energy; this increase can be rationalized by –TdS term; as the temperature increases, not only does the minus sign make it more negative, but the entropic term also increases, as entropy increases with temperature. The lattice constant increases with temperature, which is logical, as we intuitively know that materials (generally) expand with heating: this just shows that even with a simple computation, the expansion of materials can be rationalized. The lattice parameter increase becomes more linear more quickly than the free energy decreases.
This would not happen if the approximation was perfectly harmonic, as the equilibrium bond length would not change with temperature; it is the anharmonicity of the potential energy surface of the system that allows for thermal expansion. The physical reason for thermal expansion is that the greater temperature gives the particles greater kinetic energy, which translates into greater motion/vibration. This results in an increased equilibrium bond distance as the particles move more, which is the cause of the physical expansion due to temperature.
The thermal expansion coefficient is given by . For the quasi-harmonic approximation, between 0K and 1000K, ignoring the curvature of the increase in lattice parameter, the coefficient was found to be 2.26 x 10⁻⁵ K-1. This is not too far removed from the literature value of 3.16 x 10⁻⁵ K-1,[3] but is not incredibly close. This could be due to the fact that the temperature range is slightly shifted in the literature value, between ~300-1200K. If instead we take the values between 300K and 1000K, to more closely match the temperature range of the literature value, the resulting thermal expansion coefficient is 2.83 x 10⁻⁵ K-1. This is evidently quite a bit closer to the literature value, showing that the temperature range is indeed very important. It may also be so much more accurate because it takes values from the more linear part of the curve.
The main approximations involved in this calculation are the parabolic basis of the quasi-harmonic approximation, and the hard sphere approximation of the ions, giving them purely ionic nature and neglecting any covalent effects. There is also the approximation of the Morse potential. The ions can't be treated with purely Coulombic forces, otherwise they would attract each other until they collided- we know that real ions do not do this due to the electron cloud repulsion. Therefore, in addition to the Coulombic attraction, another, short-range repulsion needs to be included in the approximation. This is known as the Buckingham potential, which combines with the Coulombic potential to approximate the Morse potential. [4]
Molecular Dynamics

It is obvious here that the increase of unit cell volume is modeled very differently for the quasi-harmonic approximation and the molecular dynamics model. The quasi-harmonic approximation results in a larger unit cell volume for the same temperature, as well as some curved nature to the trend at lower temperatures, while the trend becomes much more linear at higher temperatures. The molecular dynamics model simply shows a linear increase in unit cell volume with temperature. The quasi-harmonic approach is more accurate at lower temperatures due to the inclusion of zero-point energy as the harmonic component, whereas the molecular dynamics approximation is better at higher temperatures. This makes sense when you consider what would happen to the simulation around the melting point of MgO. With the quasi-harmonic approximations, the parabolic nature of the approx. means that the bonds would never dissociate; they would just get increasingly long while the crystal structure remains ordered. The MD approach however is much more chaotic in nature, and allows bonds to dissociate. If one were to compute a simulation at roughly the melting point of MgO, most likely you would see such dramatic movement of the atoms that there would be nothing of the crystal structure left. Clearly the molecular dynamics simulation is more accurate at higher temperatures. Therefore the two produce different results because the quasi-harmonic approximations includes the zero-point energy, and therefore is accurate at lower temperatures. However due to the harmonic approximation it cannot simulate bonds breaking. That's where the molecular dynamics model comes in- due to the random motion of the atoms, bonds can easily be broken. Only once energies have reached levels where the zero-point energy amount is negligible, is the model suitably accurate: therefore it works best at higher temperatures.
This can be seen on the graph where the quasi-harmonic and molecular dynamics curves start to converge to a similar linear trend (with the quasi-harmonic curve a little bit higher due to the inclusion of zero-point energy) at higher temperatures. It's then interesting to consider what would happen to the cell volume with each model, should the temperature continue to increase to and beyond the melting point of MgO. Presumably the cell volume with the quasi-harmonic approximation would simply continue to expand linearly as bonds would not break, while the MD model probably would reach a point where the cell volume no longer increased linearly, and increases dramatically in size. Furthermore, the unit cell volume would remain relatively true to cubic form in the quasi-harmonic approximation, while with the MD model that structure would be lost, so if the computation of the volume is based on a cubic pattern, it would be wholly unrepresentative of the actual "cell volume", whereas if it calculated it based on the location of the outermost atoms, regardless of the exact shape, then it would be quite large, and presumably fluctuate quite a bit.
The thermal expansion coefficient was calculated for the molecular dynamics model as well. It was found to be 2.981 x 10^-5 K-1over the 100K-1000K temperature range, which is closer to the literature value [3] than the quasi-harmonic approximation for the overall range of the calculations. But when the value is calculated between 300K and 1000K again to more closely match the literature value temperature range, the thermal expansion coefficient is found to be 3.02 x 10⁻⁵ K-1. This is once again a much better match for the literature value than when the whole range is taken. α is probably more accurate for the MD model due to the fact that it holds better for a wider range of temperatures, the higher temperatures, while the quasi-harmonic model is only accurate for a smaller range of (lower) temperatures.
The 32 unit cells used in the computation was a compromise to minimize computation size, meaning the effective grid size of k-values was relatively small. A more accurate grid size, and therefore total cell size based on the shrinking factor vs. accuracy investigation of before, would most likely be 18x18x18, which would be 5832 asymmetric unit cells, which would have a very high computational cost, but would produce a more accurate result.
Conclusion
Ultimately, the thermal expansion of MgO was modeled using both the quasi-harmonic approach, and the molecular dynamics approach. It was found that the quasi-harmonic model was more accurate at lower temperatures due to the inclusion of zero-point energy, but molecular dynamics is more accurate at higher temperatures, since it allows for bonds to break, whereas due to the harmonic/parabolic nature of the quasi-harmonic model, at high temperatures the bonds only lengthen but do not break, rendering it inaccurate at high temperatures or around the melting point of MgO. This is due to the different basis of the models.
When using the molecular dynamics model, it is important to use a cell size that is larger than that of the unit cell, as otherwise the out-of-phase vibrations would not be modelled. 32 units shows and calculate the vibrations and thermal expansion to a decent level of accuracy, but a cell of 18x18x18 MgO units would be better, based on the Free Energy vs. stretching factor optimisation from the quasi-harmonic model.
Ultimately, both models have merit, and are required for different uses- quasi-harmonic for looking at the system at very low temperatures due to the inclusion of zero-point energy, and the fact that a parabola can be a fairly accurate approximation for the Morse potential with very slow deviations from equilibrium. On the other hand, molecular dynamics models the atoms as moving with chaotic motion, which allows for more accurate modelling at higher temperatures, and looking at the phase transition from solid to molten.
References
- ↑ 1.0 1.1 A. P. Sutton, Electronic Structure of Materials, Oxford Science Publications, 2nd edn., 1993.
- ↑ R. Hoffmann, Angew. Chemie Int. Ed. English, 1987, 26, 846–878.
- ↑ 3.0 3.1 O. L. Anderson and D. G. Isaak, Spectroscopy, 1995, 357.
- ↑ R. H. Sloane and R. Press, Proc. R. Soc. London. Ser. A. Math. Phys. Sci., 1938, 168, 284 LP-301.

