Rep:Mod:pnr08mod2
General Principles
Basis Sets and Optimisations
Small Basis Sets - BH3
A trigonal planar molecule of BH3 was created in Gaussview, and the structure optimised using the B3LYP method and a 3-21G basis set. The optimisation kept the structure as trigonal planar, with a H-B-H bond angle of 120o, but changed the bond lengths so that they were all equal at 1.19Å.
The optimised structure can be seen by clicking here: and the optimisation calculation output file can be found here
The results summary gave the following information:
| BH3 Optimisation |
| File Name = bh3_opt |
| File Type = .log |
| Calculation Type = FOPT |
| Calculation Method = RB3LYP |
| Basis Set = 3-21G |
| Charge = 0 |
| Spin = Singlet |
| E(RB3LYP) = -26.46226338 a.u. |
| RMS Gradient Norm = 0.00020672 a.u. |
| Imaginary Freq = |
| Dipole Moment = 0.0000 Debye |
| Point Group = D3H |
| Job cpu time: 0 days 0 hours 1 minutes 7.0 seconds. |
The important things that can be gained from this are the confirmation that the B3LYP method and 3-21G basis set were used; a calculation of the overall energy of the molecule to be -26.46 Ha, which is equal to -11450 kJ mol-1 (4s.f.). Note that this energy is specific to the method and basis set used, and cannot be compared, only reproduced. Also, it shows that the ground state is a singlet (there are no unpaired electrons), that the molecule has no dipole moment and that the molecule has a D3h point group.
Looking at the output file from the optimisation in a text format, we can see the following:
        Item               Value     Threshold  Converged?
Maximum Force            0.000413     0.000450     YES
RMS     Force            0.000271     0.000300     YES
Maximum Displacement     0.001610     0.001800     YES
RMS     Displacement     0.001054     0.001200     YES
Predicted change in Energy=-1.071764D-06
Optimization completed.
   -- Stationary point found.
                          ----------------------------
                          !   Optimized Parameters   !
                          ! (Angstroms and Degrees)  !
--------------------------                            --------------------------
! Name  Definition              Value          Derivative Info.                !
--------------------------------------------------------------------------------
! R1    R(1,2)                  1.1935         -DE/DX =    0.0004              !
! R2    R(1,3)                  1.1935         -DE/DX =    0.0004              !
! R3    R(1,4)                  1.1935         -DE/DX =    0.0004              !
! A1    A(2,1,3)              120.0            -DE/DX =    0.0                 !
! A2    A(2,1,4)              120.0            -DE/DX =    0.0                 !
! A3    A(3,1,4)              120.0            -DE/DX =    0.0                 !
! D1    D(2,1,4,3)            180.0            -DE/DX =    0.0                 !
--------------------------------------------------------------------------------
GradGradGradGradGradGradGradGradGradGradGradGradGradGradGradGradGradGrad
This simply shows that the molecule converged to an optimal structure (with a stationary point in its energy) i.e. the change in the forces acting on the atoms, and the distances between them, within one optimisation step has fallen below a certain threshold value. For example, R1, R2 and R3 are the B-H bond lengths, and at the value of 1.1935Å, the rate of change of energy with respect to bond length is 0.0004 Ha rb-1, which is very small, and below a threshold value (so is considered to be effectively zero, hence a minimum in the energy. A1, A2 and A3, are the H-B-H bond angles, and at 120o, the rate of change of energy with respect to bond angle is zero. D1 having a value of 180o shows that the molecule is planar, and -DE/DX for this equaling zero means that it is also at a minimum energy, and changing it would result in a restoring force acting to bring it back to this conformation.
The graphs below show how the energy and root mean squared gradient (an average of all the seven gradients mentioned above) change with the structure resulting from each optimisation step.
The left graph shows that with each step, the total energy of the molecule became more negative before reaching the optimised structure, where the energy is lower than that of any other explored structure. The graph on the right shows that the RMS gradient (the rate of change of energy with respect to structure of the molecule) also decreases with each optimisation step, indicating that the molecule is moving closer and closer to a minimum in its energy.
It should be noted here that during the optimisation of some molecules, GaussView does not acknowledge the presence of some bonds. For example, in the optimisation of BH3, the bond lengths were initially set to 1.5Å before the optimisation was run. At this distance, GaussView did not draw in the bonds. Similar things can be seen in some optimised structures. This does not indicate that there is no bond present, simply that it falls outside the typical range of bond lengths between two specific atoms (a range which is stored within the program).
One cannot say therefore that there is no bond here. A chemical bond is simply an arrangement of electrons and nuclei that results in a favourable interaction, hence is stable compared to the isolated nuclei and electrons. Using this definition, the presence of a chemical bond does not indicate absolute stability in a molecule. If a small change in geometry causes a more stable conformation, a bond is still present - there is just a more stable bond in the second conformation, which, in the absence of a thermodynamic or kinetic barrier, will be spontaneously assumed.
Larger Basis Sets and Pseudopotentials - TlBr3
Again, using GaussView, a trigonal planar molecule of TlBr3 was created and optimised. However, this time around, though the same B3LYP method was used, it was used with a different basis set - LANL2DZ. This incorporates a medium sized basis set, D95V, to be used on first row elements (whereas 3-21G is a small basis set), and Los Alamos ECP on higher elements. Los Alamos is a medium sized basis set which incorporates a pseudo-potential, which approximately accounts for the relativistic effects that the electrons in the valence shells of large elements (such as Thallium) are subject to. This larger basis set results in an increased calculation time, but is necessary to produce accurate results for this more complicated system.
This optimisation retained the trigonal pyramidal structure with Br-Tl-Br bond angles of 120o, and gave three equal Tl-Br bond lengths of 2.65Å. A literature value for this length could not be found, due to its relative instability. However, the Tl-Br bond lengths in 1,1,4,4-tetramethylpiperazinium pentabromothallate (C8H20N2TlBr5) range between 2.591Å and 2.840Å[1], showing that the calculated value is, at the very least, in the correct region, so a good approximation.
The optimised structure can be seen here: and the output file from the optimisation can be found here.
The results summary is shown below.
| TlBr3 optimisation |
| File Name = tlbr3_opt |
| File Type = .log |
| Calculation Type = FOPT |
| Calculation Method = RB3LYP |
| Basis Set = LANL2DZ |
| Charge = 0 |
| Spin = Singlet |
| E(RB3LYP) = -91.21812851 a.u. |
| RMS Gradient Norm = 0.00000090 a.u. |
| Imaginary Freq = |
| Dipole Moment = 0.0000 Debye |
| Point Group = D3H |
| Job cpu time: 0 days 0 hours 3 minutes 58.0 seconds. |
The important differences to note here are the note of the different basis set (LANL2DZ), the longer computational time (due to the larger basis set) and the energy of -91.22 Ha i.e. -3200 KJmol-1.
Molecular Orbital Calculations and NBO Analysis
Molecular Orbitals of BH3
The optimised structure of BH3 was then submitted for molecular orbital and natural bond orbital analysis, keeping the same 3-21G basis set in use. The deposited file with these results in can be found here: DOI:10042/to-6627 .
The first eight computed molecular orbitals of BH3 are shown on the following MO diagram, and compared with the orbitals derived from the LCAO Method (essentially the same calculation, just using the atomic orbitals as a basis set).
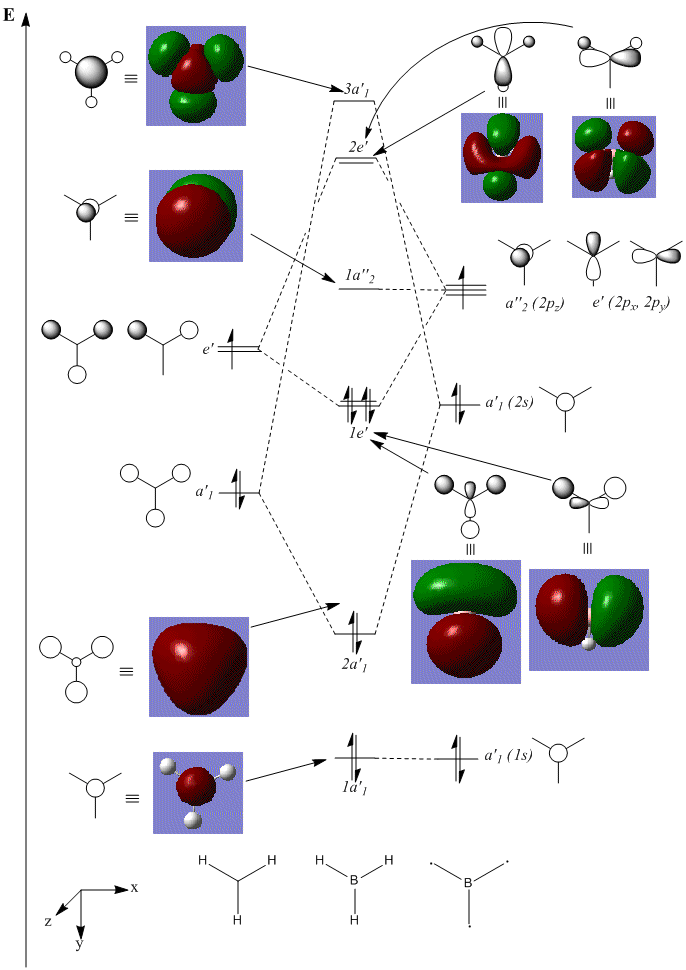
There are various advantages of using computational methods over applying LCAO by hand that this diagram illustrates. The first, and possibly the most important of these is its ability to definitively predict the ordering of the orbitals. From an LCAO point of view, it is obvious that the a'1 fragment orbitals are of a lower energy than the e' fragments due to more bonding and less antibonding interactions, and the boron 2s orbital is obviously lower in energy than the p orbitals. However, it is also quite clear that due to better overlap (s-s compared to s-p interactions), the splitting of the a'1 is greater. As a result, it is difficult to predict whether the 2e' levels or the 3a'1 level is higher in energy. Despite this, using computational methods, we can definitely calculate that the 2e' levels are 0.00357 Ha (9 kJ mol-1) higher.
Using this diagram, we can compare the 'real' MOs to those calculated by LCAO. It turns out that the lower energy, filled bonding orbitals are very well represented in LCAO, as are non-bonding orbitals (specifically those that in LCAO are simple atomic orbitals that do not interact with other AOs, due to symmetry considerations). The graphical depiction of orbitals becomes less accurate for unfilled antibonding orbitals, particularly those with a greater number of nodes.
Obviously, the advantages of using LCAO is that it does not require a computer to obtain a reasonable approximation to the MOs, and that it can be quite quick to apply. However, when dealing with more complicated molecules, this no longer applies, and a computer is much quicker to use, especially to consider mixing of the orbitals.
NBO Analysis of BH3
Looking at the .out output file from the MO calculations, we can explore the natural bond orbitals of the molecule.
The first analysis done here is a calculation in which Gaussian effectively looks at how much time the electrons in each of the MOs spend around each individual atom, to calculate the effective charge around each atom, viewed in the column 'Natural Charge', which is the difference between the charge of the nucleus and the 'natural valence population', the effective number of electrons around that atom. The column labelled 'Core' accounts for the electrons in filled shells (the 2 electrons n=1 energy level in the case of Boron).
Summary of Natural Population Analysis:
                                      Natural Population
               Natural  -----------------------------------------------
   Atom  No    Charge         Core      Valence    Rydberg      Total
-----------------------------------------------------------------------
     B    1    0.33161      1.99903     2.66935    0.00000     4.66839
     H    2   -0.11054      0.00000     1.11021    0.00032     1.11054
     H    3   -0.11054      0.00000     1.11021    0.00032     1.11054
     H    4   -0.11054      0.00000     1.11021    0.00032     1.11054
=======================================================================
  * Total *    0.00000      1.99903     6.00000    0.00097     8.00000
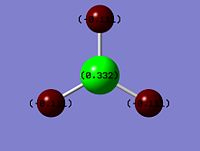 |
Figure 1 - Image showing the charge density on each atom in BH3
|
This can be shown in a more visual way in the image to the right. An atom coloured green indicates a positive charge around the atom, whereas an atom coloured red indicates a negative charge. The numbers indicate the magnitude of the δ+ (+0.332) and δ- charges (-0.111), compared to 1, which would be a full formal positive (or negative for -1) charge.
Next, we can see an analysis of the natural bond orbitals, which is a similar concept to that mentioned above, whereby 2 centre - 2 electron bonds are assumed, and it is calculated what contributions from each of the atomic orbitals are needed to achieve this.
(Occupancy) Bond orbital/ Coefficients/ Hybrids
    1. (1.99853) BD ( 1) B   1 - H   2
               ( 44.48%)   0.6669* B   1 s( 33.33%)p 2.00( 66.67%)
                                           0.0000  0.5774  0.0000  0.0000  0.0000
                                           0.8165  0.0000  0.0000  0.0000
               ( 55.52%)   0.7451* H   2 s(100.00%)
                                           1.0000  0.0000
    2. (1.99853) BD ( 1) B   1 - H   3
               ( 44.48%)   0.6669* B   1 s( 33.33%)p 2.00( 66.67%)
                                           0.0000  0.5774  0.0000  0.7071  0.0000
                                          -0.4082  0.0000  0.0000  0.0000
               ( 55.52%)   0.7451* H   3 s(100.00%)
                                           1.0000  0.0000
    3. (1.99853) BD ( 1) B   1 - H   4
               ( 44.48%)   0.6669* B   1 s( 33.33%)p 2.00( 66.67%)
                                           0.0000  0.5774  0.0000 -0.7071  0.0000
                                          -0.4082  0.0000  0.0000  0.0000
               ( 55.52%)   0.7451* H   4 s(100.00%)
                                           1.0000  0.0000
    4. (1.99903) CR ( 1) B   1           s(100.00%)
                                           1.0000  0.0000  0.0000  0.0000  0.0000
                                           0.0000  0.0000  0.0000  0.0000
    5. (0.00000) LP*( 1) B   1           s(100.00%)
    6. (0.00000) RY*( 1) B   1           s(  0.00%)p 1.00(100.00%)
    7. (0.00000) RY*( 2) B   1           s(  0.00%)p 1.00(100.00%)
    8. (0.00000) RY*( 3) B   1           s(  0.00%)p 1.00(100.00%)
    9. (0.00000) RY*( 4) B   1           s(  0.00%)p 1.00(100.00%)
   10. (0.00032) RY*( 1) H   2           s(100.00%)
                                           0.0000  1.0000
   11. (0.00032) RY*( 1) H   3           s(100.00%)
                                           0.0000  1.0000
   12. (0.00032) RY*( 1) H   4           s(100.00%)
                                           0.0000  1.0000
   13. (0.00147) BD*( 1) B   1 - H   2
               ( 55.52%)   0.7451* B   1 s( 33.33%)p 2.00( 66.67%)
                                           0.0000  0.5774  0.0000  0.0000  0.0000
                                           0.8165  0.0000  0.0000  0.0000
               ( 44.48%)  -0.6669* H   2 s(100.00%)
                                           1.0000  0.0000
   14. (0.00147) BD*( 1) B   1 - H   3
               ( 55.52%)   0.7451* B   1 s( 33.33%)p 2.00( 66.67%)
                                           0.0000  0.5774  0.0000  0.7071  0.0000
                                          -0.4082  0.0000  0.0000  0.0000
               ( 44.48%)  -0.6669* H   3 s(100.00%)
                                           1.0000  0.0000
   15. (0.00147) BD*( 1) B   1 - H   4
               ( 55.52%)   0.7451* B   1 s( 33.33%)p 2.00( 66.67%)
                                           0.0000  0.5774  0.0000 -0.7071  0.0000
                                          -0.4082  0.0000  0.0000  0.0000
               ( 44.48%)  -0.6669* H   4 s(100.00%)
                                           1.0000  0.0000
Looking at the first three orbitals, denoted BD, it can be seen that 44.48% of the bond can be attributed to the B atom (1/3 of which came from an s orbital, 2/3 from p orbitals - hence the B is sp2), and 55.52% comes from the H atom (entirely contributed from the 1s orbital). Note that in the molecular orbitals calculated before, there is a greater contribution (coefficient) from the hydrogen atoms than for the boron 1s orbital toward the 2a'1 orbital due to the fact that the bonding H3 fragment orbital is lower in energy than the boron 2s orbital. This is reflected in this greater NBO contribution from the H atom in each B-H bond.
The fourth orbital, designated CR, is the electronic 'core' of the molecule consisting of the 1s electrons from boron which do not contribute to a conventional 2c-2e bond. The higher orbitals are designated with an asterix (*), representing the fact that these NBO orbitals are formally unfilled orbitals, though they can still be analysed in a similar fashion.
The next section of interest is the second order perturbation theory analysis, which essentially indicates any mixing between these NBOs. Looking at the table below, we can see that the only interactions are between the core electrons and Rydberg orbitals (large, diffuse orbitals, also found in the table above to be entirely boron s orbitals, but with a higher principle quantum number, n=4,5,6), with a relatively small interaction energy (only an E(2) of 20 kcal mol-1 or above represents a significant interaction).
Second Order Perturbation Theory Analysis of Fock Matrix in NBO Basis
    Threshold for printing:   0.50 kcal/mol
                                                                             E(2)  E(j)-E(i) F(i,j)
        Donor NBO (i)                     Acceptor NBO (j)                 kcal/mol   a.u.    a.u.
===================================================================================================
within unit  1
  4. CR (   1) B   1                / 10. RY*(   1) H   2                    1.51    7.54    0.095
  4. CR (   1) B   1                / 11. RY*(   1) H   3                    1.51    7.54    0.095
  4. CR (   1) B   1                / 12. RY*(   1) H   4                    1.51    7.54    0.095
Vibrational Analysis
Vibrational Analysis of BH3
A vibrational analysis was performed on the molecule (the output can be found here), using the B3LYP method and 3-21G basis set (the same as used in the optimisation). As can be seen in the table below, all the vibrational modes were found to have a positive frequency, indicating that the optimised structure was found to be a minimum in the energy profile, as expected, not a maximum or point of inflection (which are also stationary points, hence could be given as a result using this method of optimisation).
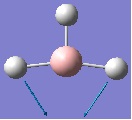
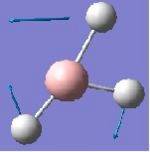
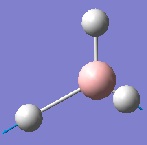
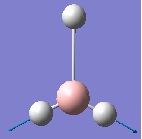
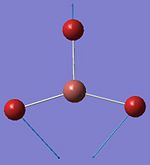
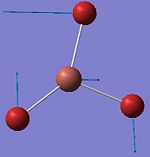
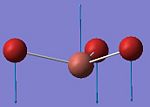
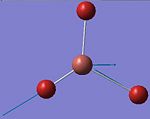
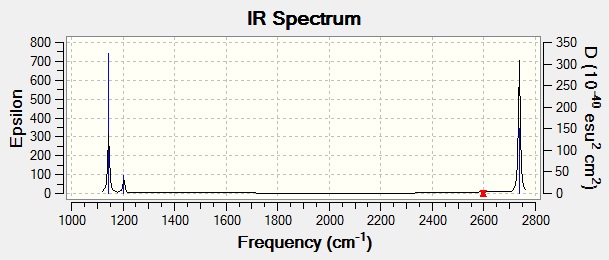
Here, we can see that there are six vibrational modes (as predicted by 3N-6, N=4), however, not all of these will be visible in the IR spectrum. The intensity of the peaks is related to the change in dipole moment that the vibration causes within the molecule. As a result, vibration 4, which is totally symmetrical and hence causes no change in dipole moment, cannot be seen at all (indicated by the zero intensity, shown in the table above). Similarly, vibrations 2 and 3 contain components that partially cancel each others' change in dipole moment out, resulting in an overall small change in dipole moment, hence a small intensity. As a result these peaks may be difficult to discern in an actual spectrum. In contrast, in vibrations 1, 5 and 6, all the components of the vibrations reinforce each other, leading to a large change in dipole moment, hence a large intensity. These three peaks will be the obvious peaks in the IR spectrum.
This can be seen in the simulated spectrum using the calculated values, as shown below:
Vibrational Analysis of TlBr3
A similar vibrational analysis was performed on TlBr3 (the output can be found here. This time, the B3LYP calculation method was still used, however, with a LANL2DZ basis set, as in the optimisation. It is important that the same method and basis set are used in the vibrational analysis as in the optimisation, as the optimisation leaves the molecule described in terms of this basis set. Hence, using a different set for the vibrational analysis is effectively trying to manipulate functions in a way only appropriate for a different set of functions.
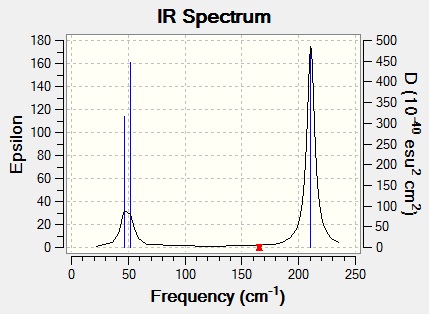
The most important difference to note here is that the peaks occur at much lower wavenumbers, indicating that the Tl-Br bond is much weaker than the B-H bond. This is to be expected firstly as thallium and bromine are two rows apart in the periodic table, hence their orbitals are very mismatched in size, resulting in an inefficient overlap compared to boron and hydrogen, only separated by one row. Also, thallium and bromine are much larger elements than boron and hydrogen, resulting in much more diffuse orbitals, again giving a worse overlap.
The same factors govern the intensities of the peaks, hence the only other important difference is the fact that the A"2 vibration is now at a higher wavenumber than the E" vibrations. This can be attributed to the fact that they contain different contributions of motions from central (B, Tl) atoms and outside ones (H, Br), which when combined with the fact that the ratio of masses for Tl:Br is different from that for B:H, affects the relative energy of vibration in the two molecules. Apart from this, the order remains unchanged, since, as a general rule, asymmetric stretches require more energy than symmetric ones.
The calculated IR spectrum containing the above vibrations is shown below:
Looking in the log file, we can see the six 'low frequencies' at -3.4213, -0.0026, -0.0004, 0.0015, 3.9367 and 3.9367 cm-1. These are not accurate frequencies due to the approximations generated by using a basis set; however, the relative sizes are important. There are three frequencies roughly one order of magnitude lower than the lowest energy vibrations (the E" vibrations), which can be attributed to the three rotational degrees of freedom of the molecule. The other three are at least four orders of magnitude lower than the lowest vibrations, which can be a attributed to the three translational degrees of freedom of the molecule.
Cis-Trans Isomerism in an Octohedral Complex
Two different molecules, the cis and trans isomers of [Mo(PCl3)2(CO)4] were modelled computationally using a B3LYP method, first using the LANL2MB basis set and pseudo-potential, then refined with the LANL2DZ basis set and pseudo-potential, and finally further refined by introducing d orbitals into the basis set for phosphorous atoms to account for any hypervalent properties that it may show.
Optimised Geometries of the Isomers
The final optimisation calculations can be found here: DOI:10042/to-6961 (cis complex) and here: DOI:10042/to-6962 (trans complex). The structures themselves can be found here: and here:
In the optimised trans structure, the Mo-P bond length is found to
| Bond | Calculated length (cis) / Å | Calculated length (trans) / Å | Literature length[2] / Å |
|---|---|---|---|
| Mo-P | 2.48 | 2.42 | 2.50 |
| P-Cl | 2.12 | 2.12 | n/a |
| Mo-C | 2.02 / 2.05 | 2.06 / 2.06 | 2.01 / 2.02 |
| C-O | 1.17 / 1.18 | 1.17 / 1.12 | 1.16 / 1.17 |
It can be seen here that all of the computed bond lengths are within 0.1Å of the literature values. Although these cannot be directly compared, as they are not for the exact same complexes, they are similar, showing that the calculation has given a reasonable result. The complex has remained roughly octohedral, slightly distorted by a few degrees as a result of steric interactions. This, again, shows that a reasonable result has been calculated.
Comparing the cis and trans isomers, we can see that while the Mo-C bond is slightly shorter in the cis complex, the C-O bond is slightly longer, and vice versa. This indicates that the carbonyl ligands are bonded slightly more strongly in the cis-complex thanks to a greater degree of backbonding. This could be due to the fact that the electron donation from the phosphine ligands both come from a similar direction, and point roughly in the direction of the carbonyl ligands. This results in there being a greater electron density on the molybdenum centre to donate into the C=O π* antibonding orbital, strengthening the bond. This is not seen in the trans complex, as the direction of electron donation is perpendicular to the Mo-C bond.
However, the Mo-P bond is calculated to be shorter in the trans complex, indicating a stronger bonding of the PCl3 ligand in the trans-complex. This could be simply a result of the size of the ligands resulting in a steric clash in the cis conformation, preventing the ligands from getting as close into the complex, hence bonding as strongly, as would otherwise be expected.
Looking at the calculated energies of the complexes, it can be seen that the trans isomer is 3.27 kJ mol-1 lower in energy than the cis isomer. This can likely be primarily attributed to the lack of a destabilising steric clash between the phosphine ligands. This is a relatively small difference, so can be fine tuned by changing the ligands. However, it is significant, so under thermodynamic conditions, assuming there is not an abnormally large kinetic barrier to isomerisation (which is not unreasonable), then the majority of the molecules will convert to the trans isomer.
If the steric clash is indeed the main destabilising factor for the cis isomer, it is reasonable to expect that if the PR3 ligand was altered so that R was a smaller group, this would limit this destabilising effect, stabilising the cis complex with respect to the trans complex. Conversely, increasing the size of the R group would increase the energy gap between the isomers, making the trans isomer even more stable relative to the cis one.
In addition to this, if the R groups were more electron donating, then this could cause tighter bonding of the carbonyl ligands in the cis complex, for the reasons stated above, which could overall stabilise the cis complex relative to the trans one.
In summary, we might expect that large, electron withdrawing R groups would increase the stability of the trans complex, while small, electron donating R groups would stabilise the cis complex, reducing the energy difference between the two.
Vibrational Analysis
The vibrational analysis calculations can be found here: DOI:10042/to-6964 (cis complex) and here: DOI:10042/to-6969 (trans complex).
The first thing to be noted in the vibrational analysis of the two complexes is that the two lowest energy vibrations in both complexes are rotations about the Mo-P bonds. These occur at 4.45cm-1 and 6.97cm-1 in this trans complex, and at 11.73cm-1 and 20.28cm-1 in the cis complex (these higher wavenumbers are due to the fact that the rotating groups are next to each other, resulting in a clash between the two which raises their energy).
Since these are at such a low energy, thermal energy at room temperature will be enough to significantly excite these vibrational modes. Hence, in reality, it is likely that these phosphine groups are constantly rotating about the Mo-P bond, even at room temperature.
Now, looking at the carbonyl stretches, we can see four vibrational modes for each complex (three asymmetric, one symmetric), detailed below:
| Stretch | Cis vibration frequency / cm-1 | Intensity (cis) | Literature frequency[3] (cis) / cm-1 | Trans vibration frequency / cm-1 | Intensity (trans) | Literature frequency[3] (trans) / cm-1 |
|---|---|---|---|---|---|---|
| Asymmetric 1 | 1938.08 | 1605 | 1986 | 1939.19 | 1606 | 1896 |
| Asymmetric 2 | 1941.51 | 813 | 1994 | 1939.90 | 1606 | 1896 |
| Asymmetric 3 | 1952.35 | 588 | 2004 | 1966.85 | 6 | Not seen |
| Symmetric | 2019.12 | 545 | 2072 | 2025.50 | 5 | Not seen |
We can see that the vibration frequencies for the trans complex are significantly underestimated, but are nonetheless reasonable (they at least show the right qualitative trends).
Firstly, note that the symmetric and 3rd asymmetric stretches have a distinctly lower vibration frequency in the cis complex (the other two are roughly the same). This is indicative of a slightly weaker bond, hence a greater degree of backbonding to the carbonyl ligands in the cis complex, as hypothesised earlier.
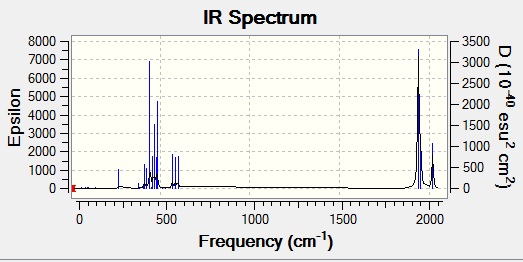
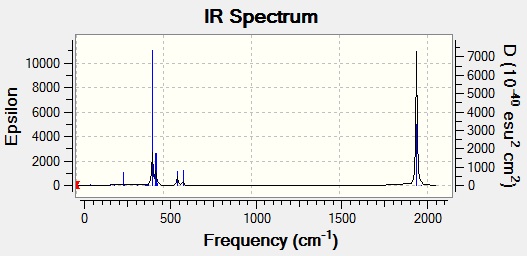
When looking at the actual spectra of the two molecules, the cis complex is found to have four peaks, as predicted here, whereas the trans complex is only found to have one. This is because asymmetric stretches 1 and 2 are actually degenerate, so appear at the same frequency, and asymmetric 3 and the symmetric stretch lead to no overall change in the dipole moment of the molecule, hence are not IR active stretches (indicated by the very low calculated intensity). The increased symmetry of the molecule reduces the number of CO peaks seen.
This effect can be seen by comparing the two spectra, shown below:
Mini Project - Fluorination of Borazine
In this mini-project, the electronic effects of fluorinating different positions (none, all three borons, all three nitrogens, all six positions) on a borazine ring were explored. Each structure was optimised and analysed using a B3LYP method and a 6-311g(d,p) basis set. No pseudo-potentials were needed since all elements in the structures are first or second row elements.
The optimisation calculations can be found here: DOI:10042/to-6980 (unsubstituted), DOI:10042/to-6981 (N-substituted), DOI:10042/to-6982 (B-substituted), DOI:10042/to-6983 (fully substituted). The optimised structures can be found here:
Vibrational Analysis
The vibrational analysis calculations can be found here: DOI:10042/to-7033 (unsubstituted), DOI:10042/to-7037 (N-substituted), DOI:10042/to-7036 (B-substituted), DOI:10042/to-7039 (fully substituted).
Below is a table containing the 30 vibrational modes of borazine. Clicking on the number assigned to the number will take you to an animation of the relevant vibration. The calculated frequencies and intensities are given, along with the character label for the vibration.
| Vibration Number | Frequency / cm-1 | Intensity | Symmetry label in D3h point group |
|---|---|---|---|
| 1 | 290.08 | 0.0002 | E" |
| 2 | 290.97 | 0.0005 | E" |
| 3 | 409.20 | 24.4175 | A"2 |
| 4 | 528.24 | 0.4682 | E' |
| 5 | 528.31 | 0.4537 | E' |
| 6 | 717.75 | 0.0466 | E" |
| 7 | 718.45 | 0.0859 | E" |
| 8 | 731.42 | 55.0121 | A"2 |
| 9 | 863.87 | 0 | A"1 |
| 10 | 923.85 | 0.0339 | E" |
| 11 | 924.19 | 0.0393 | E" |
| 12 | 936.12 | 206.4911 | A"2 |
| 13 | 938.92 | 0.0634 | E' |
| 14 | 939.29 | 0.0669 | E' |
| 15 | 946.01 | 0 | A'1 |
| 16 | 1046.44 | 0 | A'2 |
| 17 | 1080.41 | 0.0526 | E' |
| 18 | 1080.67 | 0.0603 | E' |
| 19 | 1226.78 | 0 | A'2 |
| 20 | 1324.25 | 0.0010 | A'2 |
| 21 | 1397.50 | 33.8240 | E' |
| 22 | 1397.84 | 34.7180 | E' |
| 23 | 1484.30 | 478.6750 | E' |
| 24 | 1484.51 | 478.8953 | E' |
| 25 | 2609.26 | 295.2421 | E' |
| 26 | 2609.57 | 295.1291 | E' |
| 27 | 2619.61 | 0.1514 | A'1 |
| 28 | 3627.72 | 2.1656 | A'1 |
| 29 | 3629.48 | 42.0763 | E' |
| 30 | 3630.00 | 43.4006 | E' |
From these, a few key vibrations can be chosen which are key to isolating the electronic properties of the bonds in question. Vibrations 9 (N ring breathing), 15 (B ring breathing) and 19 (symmetric B-N stretching) provide an insight into the B-N stretch. Vibrations 25, 26 (B-H antisymmetric stretches) and 27 (B-H symmetric stretch) can be used to explore the B-H / B-F bonds, and vibrations 28 (N-H symmetric stretch), 29 and 30 (N-H antisymmetric stretched) can be used to explore the N-H / N-F bonds.
These stretches were subsequently identified in all four molecules, and their frequencies listed in the tables below.
| Vibration Number | Unsubstituted frequency / cm-1 | N-substituted frequency / cm-1 | B-substituted frequency / cm-1 | Fully substituted frequency / cm-1 |
|---|---|---|---|---|
| 9 | 863.87 | 519.08 | 871.45 | 503.33 |
| 15 | 946.01 | 929.85 | 540.07 | 557.89 |
| 19 | 1226.78 | 1226.35 | 1307.71 | 1239.08 |
Looking at the last vibration, we can see that fluorination doesn't affect the frequency of this vibration very much. However, the one obvious point is that it is affected much more in the B-fluorinated compound, and that it actually causes the frequency on the B-N stretch to increase i.e. it strengthens the B-N bond. This can be explained inferring the standard model of borazine, which assumes that there is electron donation from the lone pair on the nitrogen into the empty p orbital of the boron atom. Fluorinating the boron positions increases the lewis acidity of the boron atoms, making then more electrophilic, encouraging a larger degree of donation. This increases the order of the B-N bond, strengthening it.
The exact same reason can be attributed to the increase in frequency of vibration 9 upon the fluorination of the boron positions. The same effect is seen in vibration 15, when going from the N-fluorinated borazine to the fully substituted one.
The opposite effect can be seen in vibration 15. When the nitrogen positions are fluorinated, the frequency of vibration 15 decreases. The fluorine atoms withdraw electron density from the nitrogen atoms, reducing their ability to donate electron density to the boron atoms. As a result, the bond order of the B-N bonds is lower than it would otherwise be, hence the bonds are weaker, so at a lower frequency.
The same effect is seem in vibration 9 when moving from the B-fluorinated borazine to the fully substituted one.
| Vibration Number | Unsubstituted frequency / cm-1 | N-substituted frequency / cm-1 | B-substituted frequency / cm-1 | Fully substituted frequency / cm-1 |
|---|---|---|---|---|
| 25 / 26 (Asymmetric B-H/B-F) | 2609.26 / 2609.57 | 2734.72 / 2734.92 | 1148.12 / 1148.38 | 1529.78 / 1529.89 |
| 27 (Symmetric B-H/B-F) | 2619.61 | 2738.54 | 1386.38 | 1489.31 |
| 29 / 30 (Asymmetric N-H/N-F) | 3629.48 / 3630.00 | 1015.48 / 1015.85 | 3627.78 / 3629.19 | 921.29 / 921.49 |
| 28 (Symmetric N-H/N-F) | 3627.72 | 1182.68 | 3627.21 | 1183.29 |
The first thing that can be noted here is that an X-H bond is much stronger than an X-F bond (X = N or B). This is caused, firstly, by the fact that the orbital on the H is much more concentrated (less diffuse) than that on the F, since it is in the 1st row, not the second, of the periodic table, hence gives a better overlap, and secondly, that s orbitals in general give a better overlap than p orbitals (F will be sp3 hybridised), hence H (s) gives a better overlap than F (sp3). This better overlap leads to a stronger bond.
Secondly, the fluorination of the nitrogen positions increases the B-H or B-F vibration frequencies. This, again, is related to electron donation. The B-H/F bond is antiperiplanar to one of the B-N bonds, and hence the B-N bond can donate electron density into the B-H/F σ* antibonding orbital, weakening the B-H/F bond. The fluorination of the nitrogen position reduces the electron density in the B-N bond, hence reduces this interaction, strengthening the B-H/F bond.
In the majority of cases, the fluorination of the boron positions has little or no effect on the N-H or N-F vibration frequencies. This is because there is little of this interaction in the first place. The N-H/F σ* antibonding orbital is high in energy, hence is not a good electron acceptor. As a result, reducing the electron density in the B-N bond makes little difference to the level of interaction, hence the frequency of vibration. In addition to this, there is little electron density present on a boron atom for the fluorine to withdraw, hence the substitution has little effect.
Molecular Orbital Analysis
The molecular orbital and NBO calculations can be found here: DOI:10042/to-7006 (unsubstituted), DOI:10042/to-7005 (N-substituted), DOI:10042/to-7004 (B-substituted), DOI:10042/to-7002 (fully substituted),
The six highest energy occupied orbitals and three lowest energy unoccupied orbitals of borazine are shown on an energy level diagram below:
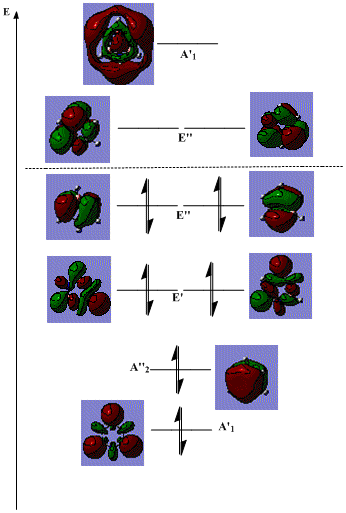
On its own, this does not provide a large amount of information, however, analogies can be drawn with benzene, since the two molecules are isoelectronic.
The dotted line indicates the barycentre of the system, hence those any orbitals below it are bonding, stabilising the system; those above it are antibonding, destabilising it. Hence, in the same way as in benzene, all of the bonding orbitals are filled, leaving all of the antibonding ones unoccupied. In fact, the three highest energy bonding orbitals in benzene are of a very similar form to the occupied A"2 and E" orbitals in the diagram above.
However, in borazine, the E' orbitals shown are found in between these two orbitals, whereas in benzene, analogous orbitals are found below the A"2 counterpart. This is due to the fact that they contain a large contribution from the boron atoms, which are less electronegative, hence higher in energy, than the carbon atoms that would be found in benzene. As a result, the molecular orbitals are raised in energy above the A"2 orbital.
Obviously, borazine is less symmetric than benzene, and this is reflected in the relative contributions from B and N atoms. Whereas in benzene, each carbon atom would contribute the same amount to the orbitals (overall, not necessarily in one specific orbital), in borazine, the spread of contributions is different. For example, in the strongly bonding A"2, the nitrogen atoms contribute more to the overall form of the orbital than the boron atoms. In contrast, in the strongly antibonding unfilled A'1, the boron atoms contribute more.
The energy level diagram of the hexafluorinated borazine is shown below:
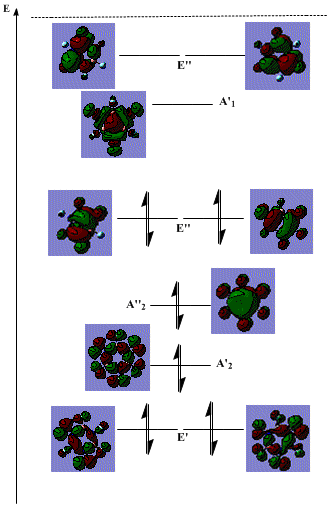
Most of the features of the diagram remain the same. The only essential difference is that instead of H atoms contributing s orbitals to the MO, F atoms contribute p orbitals. This adds to the complexity of the orbitals, but the essential characteristics are the same. The MOs shown here retain the same symmetry labels, with the exception that the A'1 orbital changes to A'2 symmetry.
The ordering of the orbitals slightly changes in response to the fluorination. Firstly, the E' level drops significantly in energy. This is mainly due to the fact that the p orbitals of the fluorine atoms in the plane of the molecule can overlap significantly due to their larger reach than the s orbitals in hydrogen which barely overlap at all due to the smaller spherical orientation, and due to the fact that they are from the n=1 level, not n=2, hence are less diffuse. This hence provides a stabilising, bonding interaction, lowering the energy of the orbital.
The other change is that the unfilled A'1 orbital drops in energy relative to its unsubstituted counterpart. This possibly arises due to the fact that the primary antibonding component is between p orbitals on the F atoms and the B/N atoms (compared to s orbitals on H atoms and p orbitals on B/N orbitals in the unsubstituted borazine). These p orbitals are more diffuse (again due to the characteristics of p orbitals compared to s, and due to the row of the periodic table), hence the antibonding contribution is weaker than for concentrated H orbitals, resulting in a relative stabilisation.
Another point to note is that as a general rule, the more bonding the orbital, the greater the contribution from the F orbital compared to the B/N atoms. This is as a result of fluorine's strong electronegativity, which draws the electron density out of the molecule away from the less electronegative central atoms. This is the opposite of that seen in the unsubstituted version, where the central N atoms are more electronegative than the outer H atoms (although the B atoms aren't, though this is a much smaller difference), hence in the bonding orbitals, the greater contribution is from the central atoms.
Next, we can see the energy levels of the B- (left) and N- (right) trisubstituted borazine below:
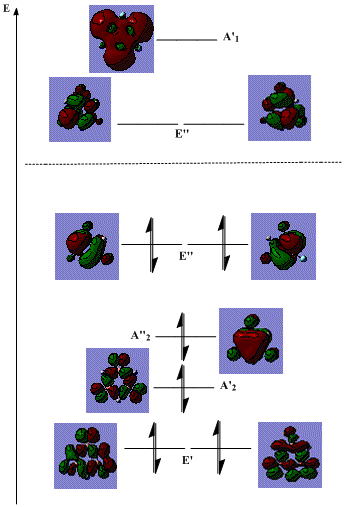

Comparing these to their unsubstituted version, it is clear that similar effects are present, with these structures sitting as intermediates between the two extremes.
However, more can be discovered by comparing these two alone. The relative contributions from the different atoms are similar in the unsubstituted and the B-substituted compounds. This is mainly because the boron atom is electron deficient, hence has little electron density for an electron withdrawing substituent to accept. As a result, little actually changes. This is backed up by the little change in N-H stretching frequencies upon B-substitution seen in table 9 above. However, a small effect can best be seen in the A"2 in that the contribution from the N atom actually increases in the B-substituted compared to N substituted borazine.
However, it is also quite clear that in the N-substituted borazine, the bonding orbitals have a greater contribution from the N atoms, whereas the antibonding ones have a greater contribution from the B atoms, compared to the B-substituted borazine. Here, there is a large amount of electron density on the nitrogen atom from the fluorine to pull out of the ring, making the orbitals more diffuse, lowering the energy of the N-H/F unit, and leading to the electron density being highest on these units.
NBO Analysis
The effective charges present on each type of atom in the four compounds are detailed in the table below:
| Atom | Charge on unsubstituted | Charge on B-substituted | Charge on N-substituted | Charge on fully substituted |
|---|---|---|---|---|
| B | +0.206 | +0.372 | +0.265 | +0.427 |
| N | -0.340 | -0.380 | -0.045 | -0.095 |
| H(B) | -0.072 | n/a | -0.012 | n/a |
| H(N) | +0.206 | +0.211 | n/a | n/a |
| F(B) | n/a | -0.203 | n/a | -0.141 |
| F(N) | n/a | n/a | -0.208 | -0.191 |
Looking at the table above, we can see that directly fluorinating a boron atom makes it much more positively charged due to a simple inductive effect, and it makes the nitrogen atoms more negatively charged, though only by a small amount, further adding weight to the result that B-fluorination actually has quite a negligible effect. The effect it does have, however, may be explained by a longer-range induction effect. The greater positive charge on the boron atom induces an electron withdrawing inductive effect on the N-H/F unit. Electron density is withdrawn from the H/F atom (shown by the increase in positive charge/decrease in negative charge on these atoms), through the N, towards the B-H/F unit. However, the electronegativity of N means that this electron density being pulled through doesn't make it further than the N atom, and the electron density accumulates here.
Directly fluorinating a nitrogen atom makes it much less negatively charged, due to a simple inductive effect, and it makes the boron (and adjacent hydrogen) atoms more positively charged due to a combination of a longer range inductive effect, and the removal of electron density from the nitrogen atoms, preventing donation into the empty boron p orbital.
Conclusions
The data above can be used together to draw the conclusion that substituting the N atoms and the B atoms on borazine with an electron withdrawing substituent produced very different electronic effects.
Firstly, the fluorination of an N-H bond polarises and weakens the bond. The B-N bond order is also decreased, hence the bond weakened, due to a reduced donation from the nitrogen lone pair to the empty p orbital on boron. The B-H/F bond, however, is strengthened, possibly due to the reduction of a different orbital interaction (between B-N σ and B-H/F σ*). Both B and N atoms lose electron density (also shown by the drop in contribution to the bonding orbitals). In general, N-fluorination withdraws electron density from the ring.
The fluorination of a B-H bond, again polarises and weakens it. The B-N bond is strengthened, due to an encouraged donation from the N lone pair into the empty boron orbital, and the effect on the N-H/F bond is negligible, but slightly weakened. The nitrogen atom actually gains a small amount of electron (which can also be seen in a greater contribution to the bonding orbitals). In summary, in contrast to N-fluorination, B-fluorination surprisingly increases the electron density in the ring, though polarising it more towards the nitrogen atoms.
Completely fluorinating the borazine, as expected, withdraws electron density from the ring, though the two effects above (N-substituting and B-substituting) are roughly additive.
References
- ↑ A. Linden, K.W. Nugent, A. Petridis, B.D. James, Inorg. Chim. Acta, 1995, 285, 122-128: DOI:10.1016/S0020-1693(98)00339-9
- ↑ G. Hogarth, T. Norman, Inorg. Chim. Acta, 1997, 254, 167-171: DOI:10.1016/S0020-1693(96)05133-X
- ↑ 3.0 3.1 E.C. Alyea, S.Song, Inorg. Chem., 1995, 24 (15), 3864–3873: DOI:10.1021/ic00119a006


