Rep:Mod:pko124
Borane
Optimization
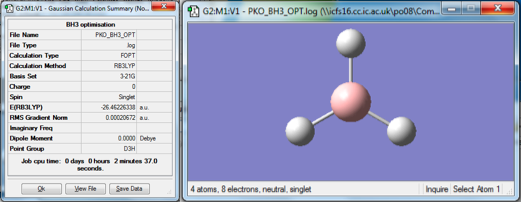
A molecule of BH3 was drawn in Gaussview and modified to have B-H bond lengths of 1.50 angstrom. An optimisation calculation was then carried out using the B3LYP method and a 3-12G basis set. The optimised geometry and the resulting summary file are shown in figure 1. The gradient was found to be 0.000207a.u., which is low enough to show that the energy of the molecule is at a stationary point. The "real" text-based output file was checked in order to ensure that the job had converged. The optimization calculation found the B-H bond length to be 1.19 angstroms and the H-B-H bond angle to be 120°.
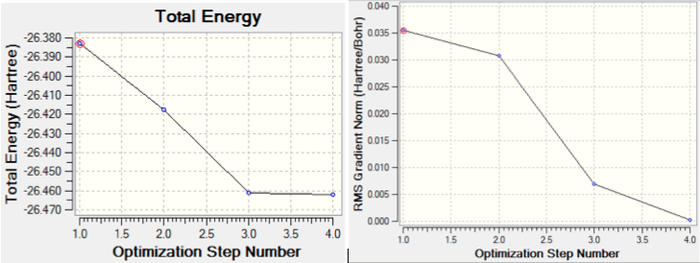
Two graphs were also generated from the optimized geometry; these show the total energy of the molecule, and the gradient with respect to the number of iterations carried out. We can see that as more iterations are carried out, the total energy of the molecule decreases dramatically until the 3rd iteration; this is because as more iterations are carried out, the geometry gets closer and closer to the optimum geometry of the molecule (ie. that with the lowest energy). As the optimum geometry is approached, the rate of change of energy is reduced, hence the lessening of the gradient in the energy graph. From the gradient graph, it is clear that the gradient reaches zero at the 4th iteration. This is when the optimum geometry has been achieved, and the energy is therefore at a minimum, hence the energy curve is at a stationary point and has no gradient. The two graphs obtained are shown in figure 2.
Vibrational analysis
On the optimized structure that was previously created, frequency analysis was carried out in order to find the vibrations of the molecule. This involves looking at the second derivative of the potential energy surface and enables us to confirm that the optimized structure is at a minimum; if the second derivative of the curve is positive, then this is the case.
A Gaussian frequency calculation using the keywords "pop=(full,nbo)" was carried out in Gaussview, and the resulting summary file was checked to ensure that the energy was the same as that found for the optimized structure previously. With this confirmed, the "real" output file was then checked, and the "low frequencies" (those corresponding to the motions of the molecule's centre of mass) were analysed. Normally, these would be zero, but the inaccuracies of the fairly low level method used mean that they are larger here. The largest of the low frequencies found was around 66cm-1, which is significantly smaller than all the other vibrations found, meaning that they are sufficiently small. The 6 frequencies expected (due to BH3 being non-linear and having 3n-6 vibrational modes) for the optimized molecule are shown below:
| Mode number | Vibrational frequency / cm-1 | Intensity | Point group | Vibrational form |
|---|---|---|---|---|
| 1 | 1144 | 93 | A" | all B-H bonds wag out of plane |
| 2 | 1204 | 12 | E' | 2 B-H bonds in scissor movement in-plane |
| 3 | 1204 | 12 | E' | all B-H bonds bend in-plane |
| 4 | 2598 | 0 | A' | all B-H bonds stretch symmetrically |
| 5 | 2737 | 104 | E' | 2 B-H bonds stretch asymmetrically |
| 6 | 2737 | 104 | E' | all B-H bonds stretch asymmetrically |
From this, we can see that vibration pairs 2 and 3, and 5 and 6 are degenerate. The fact that all frequencies are positive confirms that the geometry optimization was successful in finding the minimum energy.
MO calculations
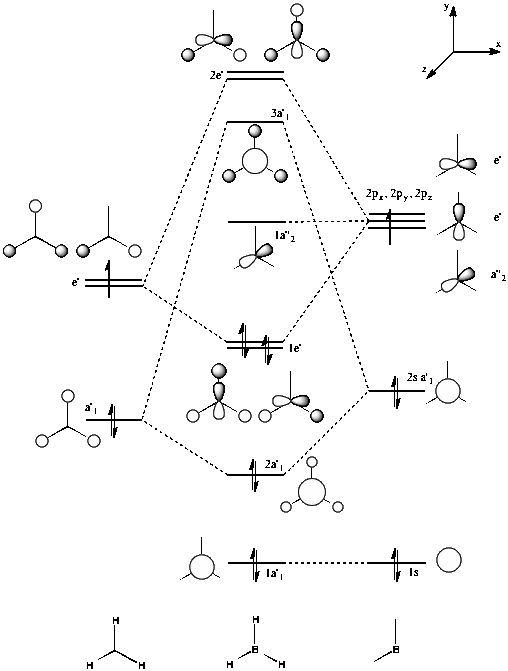
The molecular orbitals of the optimized structure of borane can also be calculated; this proves extremely useful as they can then be compared to those predicted during the drawing of MO diagrams. A molecular orbital diagram for BH3 is shown in figure 3.
A Gaussian energy calculation with the keywords "pop=full" was set up and run on the HPC server. Gaussview was then used to visualise all of the MOs. They are shown in figure 4, and their corresponding qualitative MOs predicted by the MO diagram shown below in figure 5, for comparison.


We can see that the MOs predicted by qualitative analysis are in good agreement with those found quantitatively by the calculation. The quantitative diagrams are more useful in showing the 3D nature of the MOs. Whilst the basic interactions are correctly identified during the LCAO (MO diagram) approach, in order to fully understand the contribution of each orbital, the calculated MOs are necessary. The calculation showed MO number 8 to be the highest in energy, however this was placed underneath 6 and 7 in the MO diagram drawn. This provides a good demonstration of how while LCAO approximations can successfully predict the anti-bonding and bonding interactions of the molecular orbitals, it is much more difficult to correctly predict the order in which the MOs will lie.
NBO analysis
Natural bond orbital analysis was also carried out, which enables us to visualise the charge distribution across a molecule. This gave an overall charge of zero for the molecules, as expected of course for a neutral molecule. The analysis also agrees with our expectations by showing the boron atom to have a high positive charge, since it is Lewis deficient. The numerical charges for each atom can be assigned, and show the boron to have a charge of 0.331 and each hydrogen to have a charge of -0.110. The symmetry of the molecule would suggest that all the hydrogen atoms would have an equal charge.
NBO analysis can also be used to determine the hybridization of the bonds, through analysis of the "Summary of Natural Population Analysis" section of the log file of the population calculation. This shows each of the B-H bonds to be comprised of 33.3% contribution from the s orbital and 66.7% contribution from the p orbital. These results suggest the central boron atom is sp2 hybridised. The bond is made up of 44.5% contribution from boron orbitals, and 55.5% contribution from the hydrogen orbitals, suggesting that the electron density of the bond is slightly drawn towards the hydrogen atoms. This agrees with the charge distribution shown in the first part of this section.
TlBr3
Optimization
A molecule of thallium bromide was drawn in Gaussview, and the symmetry was restricted to the D3h point group. This was set to a very tight restriction of only 0.0001 tolerance. The optimisation calculation was then run on the TlBr3 molecule, using the LanL2DZ basis set and the DFT-B3LYP method. The optimised geometry and the resulting summary file are shown in figure 6.
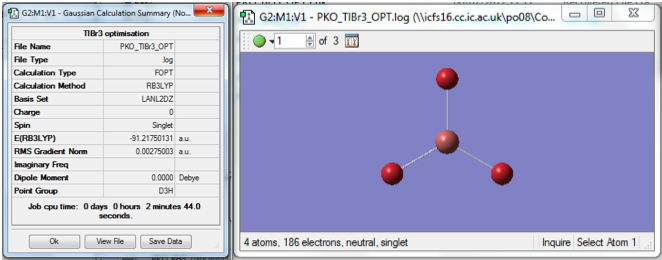
We can see that the energy of the molecule is -91.22a.u. and the gradient is 0.0027a.u. The calculation showed the optimum B-Br bond length to be 2.69 angstroms and the Br-Tl-Br bond angle to be 120°. This is in good agreement with the literature. The output log file for the calculation can be found here: MEDIA:PKO_TLBR3_OPT.LOG
Vibrational analysis
Vibrational analysis can be carried out, as with the borane molecule, to find the stretching frequencies and to determine if the resulting optimized molecule was actually at a minimum energy. The results are shown in the following table:
| Mode number | Vibrational frequency / cm-1 | Intensity | Point group |
|---|---|---|---|
| 1 | 46.43 | 3.69 | E' |
| 2 | 46.43 | 3.69 | E' |
| 3 | 52.14 | 5.85 | A2" |
| 4 | 165.27 | 0 | A1' |
| 5 | 210.69 | 25.48 | E' |
| 6 | 210.69 | 25.48 | E' |
Once again, we can see that there are two pairs of degenerate frequencies. The low frequencies were -3.42, 0.00, 0.00, 0.00, 3.94, 3.94. Compared to the frequencies displayed in the table above, these low frequencies are small enough to prove that the calculation was successful. The fact that all the frequencies are positive confirms that the potential energy curve is definitely at a minimum at the optimized geometry. The output file for the frequency analysis is found here: MEDIA:PKO_TLBR3_FREQ.LOG
Defined simply, a bond is a joining of two atoms via sharing of electron density. It brings the two atoms into closer proximity but results in a more stable system than if each atom were present individually. Gaussview does not always show the bonds present in the molecule after optimization. This is because the bond lengths calculated are often longer than those in the program's database of bond lengths, possibly due to the fact that inorganic molecules often have much larger bonds than the organic molecules on which the parameters are normally based. Gaussview therefore does not necessarily recognise these interactions as bonds, yet as it still predicts the electron density, it still provides a fair representation of the composition of a bond.
Isomers of Mo(CO)4L2
In this section, an analysis is carried out into the two isomers of the Mo(CO)4L2 molecule, where L=PPh3. For this choice of ligand, however, the phenyl groups are too large and would require Gaussian calculations that take too long a time, so the rings have been replaced with Cl atoms, which are also fairly large, yet take much less time due to much fewer atoms being present. These have a similar charge distribution to the phenyl groups so are a good choice for an substitution.
The two isomers will be optimized and their energies compared, to determine whether the cis or trans isomer is the most thermodynamically stable. A frequency analysis can then be carried out, to confirm that the minimum energies have been obtained in the optimization.
Optimization
The molecules were drawn in Gaussview and the initial optimization was carried out using the BL3YP method and the LANL2MB basis set, and the "opt=loose" keywords. The output file for the cis isomer can be accessed here: Cis opt 1 and the trans file can be accessed here: Trans opt 1. Figure 7 shows the resulting summary file and the first optimized geometry for the cis isomer, and the same data for the trans isomer can be seen in Figure 8.

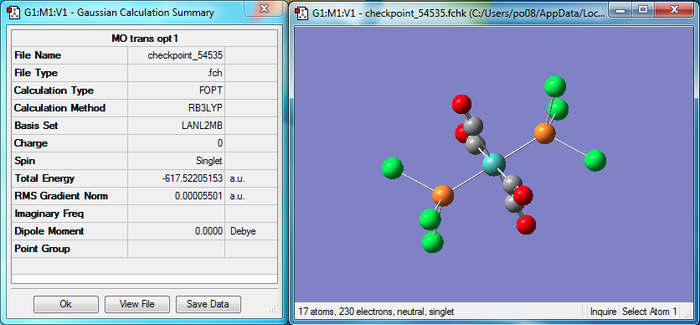
This optimization has previously been known to provide a fairly good representation of the bond lengths and angles, however the dihedral angles can often be found to be wrong, which can lead to the wrong minimum point of the potential energy curve (with 2 minima) being calculated as the optimum energy. To prevent this, the torsion angle of the PCl3 ligands are altered. The PCl3 groups of the cis isomer are altered so that one ligand has a Cl group pointing up parallel to the axial bond, and one is pointing down. For the trans isomer, the two PCl3 ligands were eclipsed and one Cl bond for each group was aligned parallel to a Mo-C bond.
With these new geometries in place, the second optimization was carried out, again with the BL3YP but this time using the LANL2DZ pseudo-potential and basis set. The keywords were replaced with "int=ultrafine scf=conver=9" to increase the convergence. The output files can be found here: for the cis isomer (shown in Figure 9) and here: for the trans isomer, shown in Figure 10.
fig 9
fig 10
Vibrational analysis
Now that the optimized geometries have been found,
