Rep:Mod:pjmo
Conformational analysis using molecular mechanics
Unless otherwise stated, all molecules presented in this section were modelled on ChemBio 3D, before being imported into Avogadro to compute their energies (following geometry optimisation using the MMFF94s force field).
Hydrogenation of cyclopentadiene dimer
The literature states that the dimerisation of cyclopentadiene is under kinetic control which results in the formation of the endo- product.[1] From theory, it would be expected that this kinetic product has a lower energy transition state but higher total energy. Thus it would follow that the thermodynamic product is exo- with a higher energy transition state but lower total energy.
Table 1 below details the computational results obtained from the optimisation of both the endo- and exo- geometries.
| Dimer | Optimised Total Energy | Optimised Structure | ||
|---|---|---|---|---|
| Exo- (1) | 55.410373 kcal/mol
231.84 kJ/mol |
| ||
| Endo- (2) | 58.229685 kcal/mol
243.63 kJ/mol |
|
As hypothesised above, the observed mode of dimerisation involves formation of the endo- product and thus reaction is kinetically controlled. It would be expected that the kinetic (endo-) product has a higher energy than the thermodynamic product (exo-). This hypothesis is reflected in the total energies calculated for the two products which show that the exo- product has an energy of 231.84 kJmol-1 and the endo- product of 243.63 kJmol-1. This value of total energy does not have any true thermodynamic significance (it does not relate to a particular property of a molecule). Moreover, it allows a comparison to be made between the isomers of a particular molecule and hence the comparison above is valid despite it's lack of experimental significance. This hypothesis is validated by computed results reported in the literature, which reflect the same conclusion as presented above.[1]
The endo-dimer can then be subsequently hydrogenated to give a dihydro-derivative.
| Endo- dimer (3) | Endo- dimer (4) | |||||
|---|---|---|---|---|---|---|
| Optimised structure |
| |||||
| Total energy
(kJmol-1) |
212.37 |
172.74 | ||||
| Total angle bending energy
(kcal/mol)* |
30.86 |
24.69 | ||||
| Total bond stretching energy
(kcal/mol) |
3.31 |
2.82 | ||||
| Torsional energy
(kcal/mol) |
0.059 |
-0.38 | ||||
| Van der Waals energy*
(kcal/mol) |
13.28 |
10.64 | ||||
| Electrostatic energy
(kcal/mol) |
5.72 |
5.15 | ||||
| Olefin Angle (°) |
107 |
112 |
A comparison of the total energies of the dihydro- derviates (3 and 4) in Table 2 show that isomer 4 is the more thermodynamically stable isomer of the two. The variance in energies between the two isomers strongly suggests that the position of the olefinic bond dictates the overall stability of the molecule. Therefore, the analysis should centre around the different interactions that arise due to differing position of the alkene bond. Although all these terms contribute to the overall total energy of the molecule, only the Van der Waals and total angle bending energies vary significantly enough to warrant a place in this discussion.
The Van der Waals energy of isomer 3 is 2.64 kcal/mol higher than that of isomer 4 which suggests there is a greater level of repulsive Van der Waals' interactions present in molecule 3 than in 4. Repulsive VdW interactions are caused by atoms being positioned closer together than the sum of their individual VdW radii. It is most likely that these repulsive interactions are caused by close approach of hydrogen atoms introduced in the hydrogenation of the dimer which, most importantly, does not occur when molecule 4 is hydrogenated. In order to more accurately quantify the origin of this effect, an NCI or QTAIM analysis could be carried out in conjugation with the measurement of Van der Waals' radii using the crystal structure of both of the different dihydro- derivatives. Unfortunately due to time constraints, this extension to the investigation was not possible on this occasion, however it would be pertinent to carry out if the experiment were to repeated. The total angle bending energy of isomer 3 is 6.17 kcal/mol higher than that of isomer 4 which suggests it experiences higher ring strain than molecule 4. According to theory, an sp2 hybridised carbon, such as the ones involved in the olefinic bonds would prefer to be orientated at 120°. Examination of the olefin angles present in molecules 3 (107°) and 4 (112°) show that there is more angle strain present in molecule 3 which reflects the increased total angle bending energy and thus its contribution to the larger total energy of molecule 3.
Taxol intermediate atropisomerism
Molecules 9 (carbonyl up) and 10 (carbonyl down) illustrated in Figure 1 below are key intermediates in the overall synthesis of the anti-cancer drug, Taxol. Paquette suggests that both of these isomers can be isolated at room temperature and thus the barrier to the rotation of the molecule, in order to generate the other species, must be high.[2]The name given to this type of isomerism is atropisomerism and molecules 9 and 10 are atropisomers of each other.
Figure 1. Taxol intermediates [3]
The aim of this section of the investigation was to identify which of the two Taxol atropisomers is more thermodynamically stable. The stability is clearly dependent on the conformation of the molecule. A simple cyclohexane ring has 4 possible conformations, all with different energies (see Figure 2 below)

However larger cyclic compounds have many more conformations available to them.For instance, by moving to an 8 carbon backbone there are already 6 possible conformational minima with arguably more complex structures than those seen in cyclohexane.[5] Hence it follows that the conformational complexity of a relatively large fused ring system, such as shown in species 9 and 10, will be particularly high and thus there will be many possible conformations with a wide variety of totals energies.
As mentioned above, the aim of this section is to suggest which of the atropisomers is the most stable. However it is not within the remit of this investigation to carry out a systematic analysis of all available conformations. Therefore, two conformations of both molecule 9 and 10 (4 in total) have been chosen. They are differentiated by the conformation of their cyclohexane ring. In order to generate the different conformations, the structures had to be manually The salient data is displayed in Tables 3 and 4 below.
| Conformation 1 | Conformation 2 | |||||
|---|---|---|---|---|---|---|
| Optimised structure |
| |||||
| Conformation of cyclohexane ring |
Chair |
Boat | ||||
| Total Energy |
295.41 kJmol-1 |
326.21 kJmol-1 |
| Conformation 1 | Conformation 2 | |||||
|---|---|---|---|---|---|---|
| Optimised structure |
| |||||
| Conformation of cyclohexane ring |
Chair |
Twist Chair | ||||
| Total Energy |
253.53 kJmol-1 |
288.40 kJmol-1 |
These data show that molecule 10 (carbonyl down) is the most thermodynamically stable atropisomer of the taxol intermediate. They also show that the specific conformation of the molecule can have a significant effect on the molecule's total energy. The lowest energy conformation analysed was that of the cyclohexane chair with a total energy of 253.53 kJmol-1. The most likely reason for the greater stability of molecule 10 is the anti-periplanar overlap of the σ*C-O orbital with the σC-H orbital of the neighbouring carbon.[6] This a.p.p. interaction is strongly stabilising due to the donation of electron density from the occupied (bonding) σC-H orbital into the non-occupied (anti-bonding) σ*C-O orbital which results in a stabilisation energy.[6] This stabilising effect is dependent on the energy gap between the donor and acceptor orbitals.[6] Thus in the case of molecule 10, it is a particularly strong effect as the electronegative power of the oxygen atom causes the C-O bond to be a good acceptor and C-H bonds are capable donors.[6] The stabilising anti-periplanar orbital overlap is not present in molecule 9, due to the upward position of the C=O bond and therefore its conformations are higher in energy.
As discussed in the script, the alkene reacts slowly upon functionalisation. This is caused by the hyper-stability of bridgehead alkenes. First postulated by Bredt in 1924[7][8], the concept of hyper-stability describes the unusual stability (low total energy) experienced by alkenes in a bridgehead location, as shown in molecules 9 and 10. The literature suggests that hyper-stabilised alkenes are thermodynamically more stable than their parent (hydrogenated) hydrocarbon[8] and that this difference in stability can be quantified with the concept of 'olefinic strain'[8].
In order to test this hypothesis, the investigation was extended to compute the relative stability of a hydrogenated version of one of the conformers discussed in the thermodynamic stability discussion above. The twist chair conformation of Taxol 10 was hydrogenated in ChemBio 3D and then optimised with the MMFF94s force field in Avogadro. The results of the exploration of its energy are shown in Table 5 below.
| Hydrogenated Taxol 10 | Taxol 10 | |||||
|---|---|---|---|---|---|---|
| Optimised structure |
| |||||
| Total Energy |
438.48 kJmol-1 |
288.40 kJmol-1 |
The total energy values appear to agree strongly with the hyper-stability hypothesis discussed above; the total energy of the hydrogenated species is 150.08 kJmol-1 larger than the corresponding alkene.
Quantum mechanical spectroscopic simulations
In this section of the investigation, a further intermediate in the synthesis of taxol (Taxol 18, shown in Figure 3 below) was spectroscopically simulated using quantum mechanical methods to predict both its 1H and 13C NMR data.
Figure 3. Structure of Taxol 18
The molecule was constructed in ChemBio 3D before being imported into Avogadro and optimised using the MMFF94s force field, resulting in a total energy of 427.92 kJmol-1.
It should be noted that attempts to orientate the cyclohexane ring present in the molecule to a chair conformation were unsuccessful; the ring always reverted to the twist boat conformation during optimisation. The previous discussion on local and global minima above suggest that although a twist boat cyclohexane ring is unlikely to represent the global minimum of the product, it is very likely it corresponds to a local minimum. Comparison of conformation energy results with colleagues suggests the more favoured cyclohexane chair conformation had a total energy of ~ 421 kJmol-1.
The optimised geometry was then submitted to Gaussian (via the HPC) with the following input command:
# b3lyp/6-31g(d,p) opt scrf(cpcm,solvent=benzene) freq(vcd) NMR EmpiricalDispersion=GD3
Unfortunately, the first three attempts to perform this calculation on the HPC were unsuccessful, despite modifications to the command input. It was later determined that this was potentially due to the length of the calculation required and the lack of sufficient processing power on the 'Gaussian 1px' cluster. The job was subsequently resubmitted to the 'Gaussian 8px' cluster, with greater processing power and a longer job cut off time, which resulted in successful completion. The outputs of this calculation can be found here: DOI:10042/132752 .
The results of the simulation are split by nucleus investigated and presented below.
1H NMR of Taxol intermediate
The atom numbers listed in the Table 6 correlate to the atoms in Taxol 18 as designated in Figure 4. below.
Figure 4. 3D Taxol 18 structure with atom labels
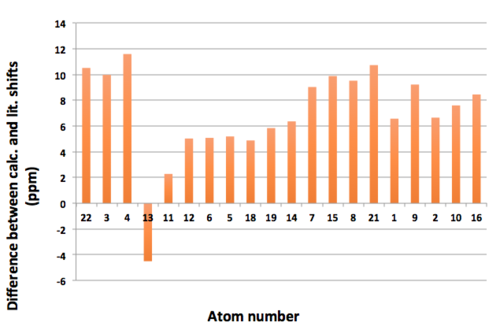
Furthermore, the use of environment notation allows for easier illustration of the difference between calculated and literature shift values shown on the graph in Figure 5. The calculated shifts are denoted 'Mean calculated shift' due to an anomaly of the calculated shift results. According to experiment/theory, if a sample were to be analysed with 1H NMR, in general, it would be expected that protons present in a methylene or methyl group would have the same (or at least very similar) chemical shifts as they are in the same proton environment. However, the raw shift data generated by the quantum mechanical simulation gave showed protons in the same methyl/methylene group (shown on the structure diagram in Figure 4) with remarkably different shift values (differences of ≤1.44 ppm; difference of 1.44 ppm was between protons 30/31 (H)). This distribution of shifts, regardless of identical environment, is most likely due to the fact that the spin-spin couplings of the molecule were not generated as this specific command was not included on the calculation input (due to time constraints; calculations of this type would have taken ~ 36 hours for a molecule the size of Taxol 18). As a result, in order to rationalise the data with theory, the shifts of each proton in a methylene / methyl group were averaged to give a single shift for that group. This gives the type of result that would be expected from experiment (ie. a single value for protons in the same environment). Furthermore, the chemical shift data obtained from the literature has also been averaged to give a mean value across a multiplet. This was necessary in order to compare with calculated results as the literature data was not assigned and thus it was impossible to denote the shift of each proton in the multiplet.
| Atoms (Environment) | Mean
calculated shift (ppm) |
Lit. shift[9] (ppm) | Mean lit. shift (ppm) | Difference
of mean shifts (ppm) |
|---|---|---|---|---|
| 28 (A) | 5.40 | 5.21 | N/A | 0.19 |
| 45 / 46 (B) | 3.31 | 3.00 - 2.70 | 2.85 | 0.46 |
| 47 / 48 (C) | 3.26 | 3.00 - 2.70 | 2.85 | 0.41 |
| 24 / 25 (D) | 2.85 | 3.00 - 2.70 | 2.85 | 0.00 |
| 32 / 33 (E) | 2.78 | 2.70 - 2.35 | 2.53 | 0.25 |
| 49 / 50 (F) | 2.41 | 2.70 - 2.35 | 2.53 | -0.12 |
| 26 / 27 (G) | 2.31 | 2.20-1.70 | 1.95 | 0.36 |
| 30 / 31 (H) | 2.26 | 2.20-1.70 | 1.95 | 0.31 |
| 29 (I) | 2.08 | 2.20-1.70 | 1.95 | 0.13 |
| 40 (J) | 1.96 | 2.20-1.70 | 1.95 | 0.01 |
| 41 / 42 (K) | 1.83 | 1.58 - 1.20 | 1.39 | 0.44 |
| 43 / 44 (L) | 1.76 | 1.58 -1.20 | 1.39 | 0.37 |
| 51 / 52 / 53 (M) | 1.48 | 1.10 | N/A | 0.38 |
| 37 / 38 / 39 (N) | 1.35 | 1.07 | N/A | 0.28 |
| 34 / 35 / 36 (O) | 1.28 | 1.03 | N/A | 0.25 |
Figure 5 below highlights the differences between the mean calculated and mean literature shifts. It clearly shows that in most cases, the calculated shifts do not align with those reported in the literature (the mean difference is 0.25 ppm). Although error will have inevitably been introduced by the averaging of various results, as outlined above, the magnitude of disagreement between the two data sets suggests that the computed values are of a low level of accuracy. A major contributing factor to this disagreement of values is that only one conformation of the molecule was used to generate the computed 1H NMR data. As discussed previously, the conformation of Taxol 18 used in this simulation was one of many potential conformations. It has already been that the twist-boat cyclohexane conformation used was unlikely to be the lowest energy conformer. However it should not be forgotten that there are other ring structures present in Taxol 18, each of which have a preferred conformation, suggesting there are many conformations available to Taxol 18; it has a high level of conformational ambiguity. When the literature results were generated experimentally, they would reflect the weighted-time average of all of the conformers available to Taxol 18. As a result, it should be expected that the computed chemical shifts are of a lower level of accuracy and thus can help explain the disagreement with literature values. This contribution to the disagreement of values could have been minimised if the computed chemical shifts of multiple confirmations were averaged (according to the Boltzmann distribution), however due to time constraints this extension to the investigation was not carried out. If the simulation were to be repeated, greater agreement to the literature values would be expected if the spin-spin coupling calculations were carried out, as this would allow for the formation of multiplets in the computed data. Additionally, if assigned literature values could have been attained, this would have prevented the need for the averaging of multiplet shift values which is clearly a source of error within the comparison.
Figure 5. Differences between 1H mean calculated shifts and mean literature shifts
As mentioned above, the shift data produced by the simulation do not align to the hypothesis that each proton in a methylene / methyl group will have a very similar chemical shift due to their location in the same proton environment. Another interesting observation related to this is that, on 6 occasions, protons in completely different environments, at different locations on the molecule, were reported as having identical chemical shifts (to 10 d.p.). This is extremely unlikely and contradicts strongly with theory / experimental results and hence is most likely to be a result of systemic error introduced by the approximations the calculation uses to generate shift results.
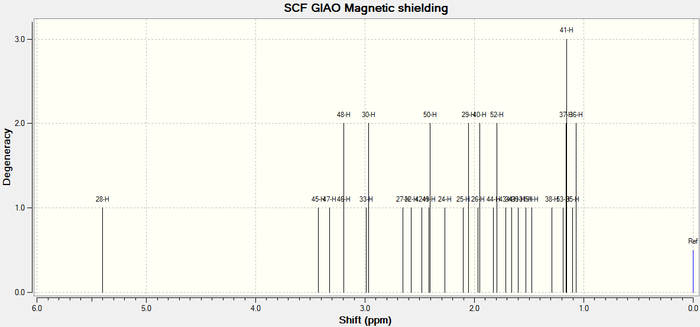
The simulated 1H NMR spectrum of Taxol 18 is illustrated in Figure 6 below.
Figure 6. Taxol 18 1H NMR spectrum
13C NMR of Taxol intermediate
The atom numbers used for each 13C shift correspond to the carbon atom labels used in the same diagram (Figure 4) as used for the 1H NMR discussion of Taxol 18. As each environment only contains 1 carbon atom hence no environment labels are required in this case and atom numbers suffice. Furthermore, this removes the need to average computed and literature shift values which removes significant error from the comparison; error which was present in the comparison of 1H NMR data of Taxol 18 above.
| Atom | Calculated shift (ppm) | Lit. shift[9] (ppm) | Difference (ppm) |
|---|---|---|---|
| 22 | 200.98 | 211.49 | 10.51 |
| 3 | 138.75 | 148.72 | 9.97 |
| 4 | 109.31 | 120.90 | 11.59 |
| 13 | 79.11 | 74.61 | -4.50 |
| 11 | 58.25 | 60.53 | 2.28 |
| 12 | 46.27 | 51.30 | 5.03 |
| 6 | 45.86 | 50.94 | 5.08 |
| 5 | 40.34 | 45.53 | 5.19 |
| 18 | 38.40 | 43.28 | 4.88 |
| 19 | 34.44 | 40.28 | 5.84 |
| 14 | 32.37 | 38.73 | 6.36 |
| 7 | 27.75 | 36.78 | 9.03 |
| 15 | 25.59 | 35.47 | 9.88 |
| 8 | 21.32 | 30.84 | 9.52 |
| 21 | 19.27 | 30.00 | 10.73 |
| 1 | 18.99 | 25.56 | 6.57 |
| 9 | 16.13 | 25.35 | 9.22 |
| 2 | 15.56 | 22.21 | 6.65 |
| 10 | 13.79 | 21.39 | 7.60 |
| 16 | 11.38 | 19.83 | 8.45 |
In a similar fashion to the 1H NMR data above, Figure 7 below illustrates the differences between the calculated and reported chemical shifts. On the whole, the computed shifts appear to agree reasonably well. This is still clearly still some disagreement between the two data sets. However proportionally speaking, it appears the computed 13C chemical shift values appear to align better with the literature than those 1H. The mean difference between the computed and literature shifts is 6.99 ppm. Although this is significantly larger than the mean difference for the 1H values, it must be remembered that 13C shift values are much larger than 1H values and thus proportionally speaking, it is a smaller mean difference.
It has been reported in the literature that carbons attached to heavy elements, require an additional correction to be implemented to computed NMR results to correct for spin orbit coupling error.[10] This insight is pertinent to this investigation as Taxol 18 contains a 5 membered ring in which carbons are attached to two sulphur atoms. The requirement of this correction is illustrated nicely by the difference between literature and calculated chemical shift values for atom 13 (which attached to two sulphur atoms). Figure 7. shows that atom 13 is the only element with a negative deviation from literature values (the literature chemical shift is larger than the computed). If a correction were to be implemented, it would be reasonable to suggest that the difference would be brought more in line with the mean difference of positive 6.99 ppm.
Unfortunately an empirical correction for carbons attached to S atoms is yet to be determined[10] and thus cannot be explicitly applied to the results, however knowledge of the requirement to implement such a correction is useful in the rationalisation of the computed results and adds further backing to the argument that the 13C values agree better with the literature than the 1H values listed above.
Figure 7. Differences between 13C calculated shifts and literature shifts
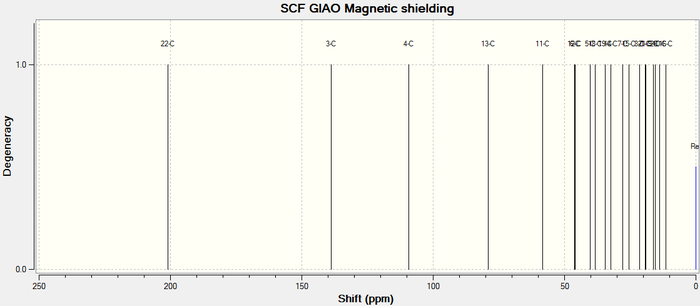
The simulated 13C NMR spectrum of Taxol 18 is illustrated in Figure 8 below.
Figure 8. Taxol 18 13C NMR spectrum
In conclusion, it can be seen from the 1H and 13C NMR discussions above that computed 13C NMR data is agrees considerably better with the literature than the corresponding 1H data. However it should be repeated that the 1H data and comparisons displayed are deemed particularly inaccurate due to the averaging of shift data, required to make any sort of reasonable rationalisation of the computed results. Therefore, confidence in the accuracy and reproducibility of the 1H chemical shift results should be significantly lower than that of 13C.
Analysis of the properties of the synthesised epoxides
The two epoxides chosen for analysis in this investigation are 1,2-dihydronapthalene oxide (DHNO) and trans-β-methyl styrene oxide (TBMSO). These choices mirror those made in the wet epoxidations carried out previously in the synthesis lab. They were constructed on ChemBio 3D and minimised in Avogadro using the MMFF94s force field. Their configurations were denoted as drawn, by ChemBio 3D, as (R,S)-1,2-dihydronapthalene oxide and (S,S)-trans-β-methyl styrene oxide.
Epoxidation Catalyst Structure
Both the Shi and Jacobsen catalysts exhibit remarkable enantioselectivity when used in asymmetric epoxidation reactions. The structures of the catalysts are displayed below.
Shi Catalyst
Unfortunately the crystal structure of the Shi catalyst is not present in the CCDC and therefore the structure was sourced from PubChem and converted to a .mol file.
The Shi catalyst contains an anomeric centre which enables the catalyst to direct the approach of the incoming alkene during the epoxidation reaction. It is a useful functionality as it introduces a rigid conformation to the 5 membered ring of the anomeric centre (due to the anomeric effect; preferred axial position) and allows for the enantioselectivity of the catalyst. Cis-alkenes experience steric hindrance with the 5-membered ring at the anomeric centre upon approach (due to its rigid conformation), trans-alkenes do not.
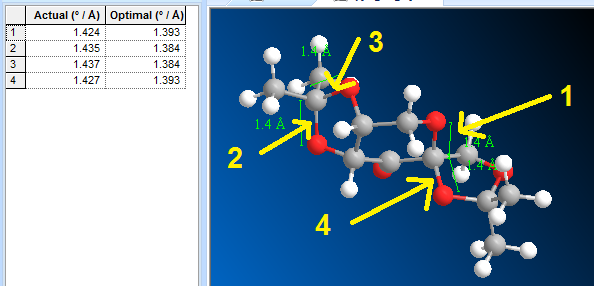
The anomeric effect can be interpreted as the interaction of an electronegative atom's lone pair (Oxygen at the anomeric centre) with the C-O anti-bonding orbital of the axial C-O bond, causing weakening and thus lengthening of bond. Figure 9 below shows the lengths of certain C-O bonds (both those involved and not involved in the anomeric centre.
Figure 9. Bond lengths of certain C-O bonds in the Shi catalyst
As mentioned above, unfortunately the crystal structure of the Shi catalyst could not be obtained as it is not present on the CCDC. The 3D geometry obtained from the PubChem structure introduced particular challenges as the structure did not report the bond lengths that would be expected from a crystal structure. This was potentially due to the molecule being modelled and not optimised before being published to PubChem. Thus as a result, the bond lengths that should be considered to align the bond lengthening hypothesis above to the results from the structure are those labelled 'Optimal' on the left side of Figure 9. The bonds labelled 1 and 4 correspond to the O-C-O substructures around the anomeric centre and are the bonds which would be expected to be longer in light of the discussion above. When comparing these C-O bonds to those labelled 2 and 3 (not involved in an anomeric centre), it is shown that in fact the 'Optimal' lengths do agree with the bond lengthening hypothesis; bonds 1 and 4 are 0.009 Å longer than bonds 2 and 3.
Although the bonds are longer and these results agree with the hypothesis, the magnitude of the difference is perhaps smaller than expected. This could, however, be partly explained by the use of a non-crystal structure, which, if used, would have provided a much more accurate representation of the bond lengths present in the molecule.
Jacobsen Catalyst
The Jacobsen catalyst's crystal structure, sourced from the CCDC, is displayed as a Jmol file below.
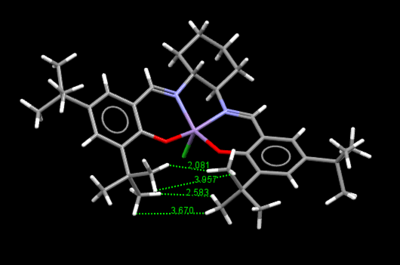
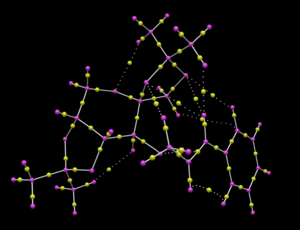
The structure shows close proximity between the adjacent t-butyl groups on the phenyls located below the central manganese atom. The distances between the closest hydrogen atoms on the t-butyl groups are highlighted in Figure 10 below.
Figure 10. Distances between adjacent t-butyl H atoms on Jacobsen's catalyst
The Van der Waals' radius of hydrogen can be considered as 1.20 Å.[11] Therefore, it could be expected from theory that the maximum attractive Van der Waals' interactions between two hydrogen atoms would occur at a distance of approximately 2.40 Å.[11]. Furthermore, as this distance is shortened below 2.40 Å, the attractive interactions would be strongly overpowered by repulsive interaction.
Examining the interaction distances, labelled on Figure 10, between the t-butyl hydrogens shows that the interactions related to the inter-atomic distances of 3.670 Å and 3.957 Å can largely be ignored. It is not completely implausible that they could have some effect on the Van der Waals' interaction between the two t-butyl groups, however they are well outside the range of attractive interactions and thus their influence is difficult to quantify. That said, it is clear the interaction between the two hydrogen atoms that are 2.081 Å would be strongly repulsive as this is significantly shorter than the sum of the VdW radii of the hydrogen atoms. Finally, it could be argued that the the interaction between the hydrogen atoms located 2.583 Å apart is reasonably attractive as it is close to the maximum attractive distance of 2.4 Å. Moreover, considering the strongly repulsive interaction present between the previous set of hydrogen atoms and lack of any other strongly interacting hydrogen atoms, 2.583 Å must be an attractive distance to counteract the repulsive interactions and allow the close proximity of the two t-butyl groups.
The significance of the small separation of the two t-butyl groups is that it prevents the approach of the alkene from the bottom of the catalyst during the epoxidation reaction, due to steric hindrance and thus allows for the enantioselectivity of the epoxidation.[12]
Epoxide NMR data
In the case of the epoxides, the computed NMR data will be used to verify the integrity of the modelled structures. The NMR data for only one enantiomer of each epoxide has been calculated; the results would show identical shifts for both enantiomers for each epoxide and hence cannot be used to rationalise the absolute configuration of the molecules. Therefore, in the interests of brevity, the data for only one enantiomer of each epoxide is reported below. The shifts could be used to help verify epoxide products synthesised in the lab.
The outputs of the NMR calculations can be found here: TBMSO (DOI:10042/132751 ) & DHNO (DOI:10042/132750 )
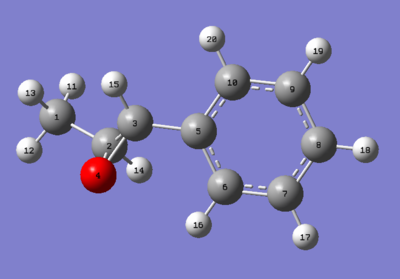
trans-β-methylstyrene oxide
Figure 11. TBMSO structure with atom labels for NMR
| Atom (Environment) | Calculated shift (ppm) | Literature shift[9] (ppm) | Difference (average) (ppm) |
|---|---|---|---|
| 20 / 19 / 17 | 7.63 | 7.24-7.39 (7.32) | 0.31 |
| 18 | 7.56 | 7.24-7.39 (7.32) | 0.24 |
| 16 | 7.44 | 7.24-7.39 (7.32) | 0.12 |
| 15 | 3.55 | 3.57 | -0.02 |
| 14 | 2.92 | 3.32-3.40 (3.36) | -0.44 |
| 12 | 1.81 | 1.45 | 0.36 |
| 11 | 1.72 | 1.45 | 0.27 |
| 13 | 0.85 | 1.45 | -0.60 |
The 1H NMR spectrum of TBMSO is presented in Figure 12 below.
Figure 12. TBMSO 1H NMR spectrum
| Atom | Calculated shift (ppm) | Literature shift[9] (ppm) | Difference (ppm) |
|---|---|---|---|
| 5 | 125.27 | 135.84 | 10.57 |
| 7 | 114.37 | 128.30 | 13.93 |
| 9 | 113.62 | 127.70 | 14.08 |
| 10 | 113.09 | 127.70 | 14.61 |
| 8 | 113.02 | 127.70 | 14.68 |
| 6 | 108.78 | 125.70 | 16.92 |
| 2 | 52.62 | 59.70 | 7.08 |
| 3 | 50.87 | 59.70 | 8.83 |
| 1 | 9.13 | 18.10 | 8.97 |
The 13C NMR spectrum of TBMSO is presented in Figure 13 below.
Figure 13. TBMSO 13C NMR spectrum
1,2-dihydronaphthalene oxide
Figure 14. DHNO structure with atom labels for NMR
| Atom (Environment) | Calculated shift (ppm) | Literature shift[9] (ppm) | Difference (average) (ppm) |
|---|---|---|---|
| 14 | 7.63 | 7.34 | 0.29 |
| 12 | 7.52 | 7.09 - 7.25 (7.17) | 0.35 |
| 13 | 7.52 | 7.09 - 7.25 (7.17) | 0.35 |
| 15 | 7.33 | 7.02 | 0.31 |
| 21 | 3.72 | 3.79 | -0.07 |
| 20 | 3.72 | 3.66 | 0.06 |
| 16 | 3.02 | 2.64-2.70 (2.67) | 0.35 |
| 17 | 2.40 | 2.47 | -0.07 |
| 18 | 2.35 | 2.29-2.37 (2.33) | 0.02 |
| 19 | 1.70 | 1.62-1.72 (1.67) | 0.03 |
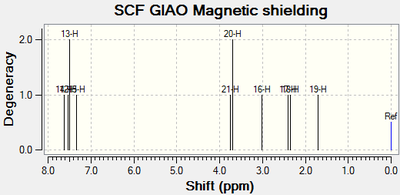
The 1H NMR spectrum of DHNO is presented in Figure 15 below.
Figure 15. DHNO1H NMR spectrum
| Atom | Calculated shift (ppm) | Literature shift[9] (ppm) | Difference (average) (ppm) |
|---|---|---|---|
| 5 | 124.14 | 137.10 | 12.96 |
| 4 | 120.68 | 132.90 | 12.22 |
| 3 | 115.85 | 129.90 | 14.05 |
| 6 | 114.13 | 128.83 | 14.70 |
| 1 | 113.72 | 128.80 | 15.08 |
| 2 | 111.74 | 126.50 | 14.76 |
| 9 | 46.73 | 55.50 | 8.77 |
| 10 | 45.12 | 55.20 | 10.08 |
| 7 | 18.33 | 24.80 | 6.47 |
| 8 | 15.24 | 22.20 | 6.96 |
The 13C NMR spectrum of DHNO is presented in Figure 16 below.
Figure 16. DHNO13C NMR spectrum
Assigning the absolute configuration of the product
Optical rotation of the epoxides
Optical rotation calculations were run on the epoxides as part of the investigation into the assignment of the absolute configuration of molecules. The calculations were run using the .log files from the NMR calculations ,discussed above, using the following command:
# CAM-B3LYP/6-311++g(2df,p) polar(optrot) scrf(cpcm,solvent=chloroform) CPHF=RdFreq

...

589nm 365nm
The output files from the calculation can be found here: TBMSO (DOI:10042/142213 ) / DHNO (DOI:10042/142230 ).
This resulted in the computation of optical rotation data for both epoxides (1 enantiomer each) at 589 nm and 365 nm. The data are summarised in Table 12 below.
| TBMSO (°) | DHNO (°) |
|---|---|
| - 46.8 (S,S) (lit. 45.7[13]; -48.5[14] | 155.8 (R,S) (lit. -144.9[15]; -138.0[16]) |
Table 12 above compares the computed values of the optical rotation of the epoxides to their literature values. It can be seen that the computed values agree reasonably well with those reported in the literature. This would suggest that the accuracy of the computed results is relatively high.
However, it should be noted that it is not uncommon for incorrect optical rotation data to reported and thus the literature values should not necessarily be treated as a 'gold standard'. The inaccuracy of reported values is perhaps due to the strong dependence of optical rotation on temperature, which can fluctuate within a lab. In order to mitigate this potential inaccuracy, multiple literature values have been stated. The presence (or lack, thereof) of a minus symbol indicates the particular enantiomer under investigation and if the other enantiomer had been computed or synthesised it would show the opposite sign of optical rotation (for instance TBMSO (R,R) would equal 46.8° and DHNO (S,R) would equal -155.8°).
Chiroptical properties of the epoxides
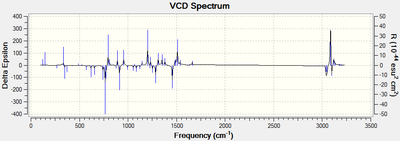
VCD spectra were computed for both epoxides. The output of those calculations are in the same repository as the epoxide NMR calculations they are called with the .log rather than .fchk files. They can be found here: TBMSO (DOI:10042/132751 ) & DHNO (DOI:10042/132750 ).
Figure 17. VCD Spectrum of 1,2-dihydronaphthalene oxide
Figure 17. VCD Spectrum of trans-β-methylstyrene oxide
VCD spectroscopy allows for the determination of the absolute configuration of molecules through the comparison of computed and experimental VCD spectra.[17] Previously determination of absolute configuration could only be achieved through the use of X-ray crystallography which requires an atom heavier than oxygen to be present in the molecule and thus is unsuitable for the epoxides under discussion.[17] Unfortunately, very few literature references are available for VCD spectra as it is currently not a widely used technique (e.g. Imperial College Chemistry Dept. does not own a VCD spectrometer due to its considerable expense). It is clearly a very powerful technique, however due to the lack of experimental VCD spectra available for the epoxides in question, it is not possible to use the computed spectra in isolation to determine the absolute configuration of the epoxides.
The electronic circular dichroism spectra of both 1,2-dihydronaphthalene oxide and trans-β-methylstyrene oxide were generated as part of the investigation (TBMSO:DOI:10042/142354 / DHNO:DOI:10042/142356 ). However the results are not shown as they have no experimental significance; the epoxides are not coloured (no chromophore present) and ECD spectra are recorded in the UV range (80 - 300 nm).
Calculated properties of the epoxide transition states
The two tables below illustrate the energies of the various transition states of the Shi and Jacobsen catalysed epoxides. The lowest energy transition state (G‡) of each configuration of each epoxide is highlighted.
| G‡ of Transition State (Ha) | ||||
|---|---|---|---|---|
| TS # | TBMSO | DHNO | ||
| R,R | S,S | R,S | S,R | |
| 1 | -1343.022970 | -1343.017942 | -1381.120782 | -1381.131343 |
| 2 | -1343.019233 | -1343.015603 | -1381.125886 | -1381.116109 |
| 3 | -1343.029272 | -1343.023766 | -1381.134059 | -1381.126039 |
| 4 | -1343.032443 | -1343.024742 | -1381.126722 | -1381.136239 |
| G‡ of Transition State (Ha) | ||||
|---|---|---|---|---|
| TS # | TBMSO | DHNO | ||
| R,R | S,S | R,S | S,R | |
| 1 | -3383.253816 | -3383.262481 | -3421.359354 | -3421.369033 |
| 2 | -3383.254344 | -3383.257847 | -3421.359499 | -3421.361580 |
The highlighted values have been transposed to Tables 15 and 16 respectively, in order to calculate the enantiomeric excess (e.e.) values of the molecules. The calculation used to produce these values is shown below (the equations used have been adapted from the literature [18].)
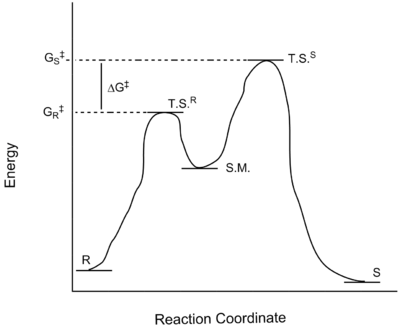
The enantiomeric excess (the excess of one enantiomer produced over the other) is defined as shown in eqn. (1) whereby k stands for the rate constant associated with the formation of that particular enantiomer; favoured denotes the lowest energy enantiomer and disfavoured the higher energy enantiomer.
The rate constant (k) can also be expressed with the Arrhenius equation (eqn. 2) which states that:
Equations 1 and 2 are then combined and rearranged to give the enantiomeric excess in terms of properties of the reaction (∆G‡) giving eqn (3) below:
Whereby ∆G‡ is calculated using the difference between the free energies of transition state (G‡) of the favoured and disfavoured enantiomers:
| Epoxide | Enantiomer | Energy (G‡) (au) | Energy Difference (ΔG‡) (kJmol-1) | e.e. (%) |
|---|---|---|---|---|
| DHNO | R,S | -1381.134059 | -5.72 | 81.92 |
| S,R | -1381.136239 | |||
| TBMSO | R,R | -1343.032443 | -20.22 | 99.94 |
| S,S | -1343.024742 |
| Epoxide | Enantiomer | Free Energy (G‡) (au) | Energy Difference (ΔG‡) (kJmol-1) | e.e. (%) |
|---|---|---|---|---|
| DHNO | R,S | -3421.359499 | -25.03 | 99.99 |
| S,R | -3421.369033 | |||
| TMBSO | R,R | -3383.254344 | -21.36 | 99.96 |
| S,S | -3383.262481 |
The particular enantiomers in excess (and hence the enantiomer to which the e.e. values relate), shown in Tables 15 and 16 above, are those with the lowest values of the free energy of transition state (G‡). In the qualitative example below, the computed e.e. value would correspond to the (R) enantiomer due to its lower value of (G‡). This diagram also illustrates the concept of ∆G‡ and hence shows the origins of the terms used to compute e.e. values.
Figure 18. Qualitative epoxidation reaction profile
Table 17 below compares the computed results of favoured enantiomer to those described in the literature.
| Catalyst | Epoxide | Computed config. | Literature config. | Computed e.e. (%) | Literature e.e. (%) |
|---|---|---|---|---|---|
| Shi | DHNO | (S,R) | (S,R)[19] | 81.92 | 32[19] |
| TBMSO | (R,R) | (R,R)[19] | 99.94 | 88[19] / 92[20] | |
| Jacobsen | DHNO | (S,R) | (S,R)[21] | 99.99 | 85[22] / 69[23] |
| TBMSO | (S,S) | N/A | 99.96 | 48[22]a |
Table 17 shows that the favoured configurations of both the Shi catalysed epoxides and Jacobsen catalysed DHNO agree with the literature configurations. Literature values for the configuration of the Jacobsen catalysed trans-β-methylstyrene oxide were difficult to obtain for the selectivity reasons discussed below.
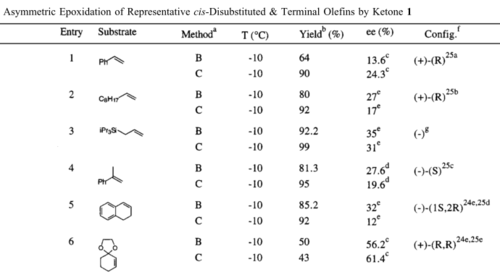
One of the principal aims of this computational investigation is to compare the results of particular asymmetric epoxidations, achieved in the wet experiment, with those calculated using molecular dynamics and simulations. Although not immediately clear from the e.e. results in Tables 15 and 16 above, the two asymmetric (enantioselective) catalysts used (Shi and Jacobsen) have remarkably different selectivities. It is widely reported in the literature[21][24][25] that the Jacobsen catalyst is almost entirely enantioselective towards cis- and unfunctionalised alkenes. Conversely, the Shi catalyst is renowned [19][26] for being significantly enantioselective towards trans- and terminal alkenes (ie. significantly less selective towards cis- alkenes). Enantiomeric excess can be interpreted as a quantitative measure of enantioselectivity. As a result, it would be expected that the would Jacobsen catalyst generate large e.e. values for cis- alkenes (such as 1,2-dihydronaphthalene oxide) and that the Shi catalyst do the same for terminal and trans- alkenes (such as trans-β-methylstyrene oxide). Enantiomeric excess values from wet experiments reported in the literature strongly agree with this hypothesis (see Figures 19 and 20).
Figure 19. Examples of Shi catalyst selectivity[19]
Figure 20. Further examples of Shi catalyst selectivity [27]

The ΔG‡ values shown in Tables 15 and 16 can be used to infer the selectivity of the catalyst as these values are proportional to the enantiomeric excess (see Eqn. 3 above). For instance, although the ΔG‡ value for Shi catalysed trans-β-methylstyrene oxide is significantly larger than would be expected between two transition states[20], the fact that it is larger, in relative terms, than the value for 1,2-dihydronaphthalene oxide implies that the Shi catalyst is, as expected from the literature, enantioselective towards trans- alkenes. This pattern is repeated respectively with the Jacobsen catalyst (a larger value for the cis- alkene). It should be noted that the magnitudes of the Jacobsen ΔG‡ values are very large considering it is simply a difference of configuration. Unlike the the Shi ΔG‡ values, the difference in ΔG‡ between the two alkenes is not as distinct. This could be explained by the lower enantioselectivity experienced with the Jacobsen epoxidation of dihydronaphthalene than the Shi epoxidation of trans-β-methylstyrene oxide (ie. the epoxidation of the favoured alkene).
Put simply, the ΔG‡ values appear to show that this method of calculation generates better (more in line with theory/experiment) results for the Shi catalysed epoxidations than the Jacobsen catalysed epoxidations (specific reasons for this are discussed later). However, that is not to say that the subsequent e.e. results produced are particularly accurate; simply that they are better predicted for Shi than for Jacobsen catalysed epoxidations.
Moving on to the specific e.e. values, it would appear that the computed e.e. results do not agree with the hypothesis anywhere near as well as the ΔG‡ values. Following the discussion above, we would expect high e.e. values for Shi catalysed TBMSO and Jacobsen catalysed DHNO and significantly lower values for the Shi-DHNO and Jacobsen-TBMSO. However Tables 15 and 16 show that there are high e.e. values for all epoxides. Particularly concerning are the high e.e values for Shi-DHNO and Jacobsen-TBMSO; the large amount of experimental evidence compiled on the high enantioselectivity of these catalysts suggests these values should be far lower.[19]
As previously mentioned, the magnitude of free energy difference between the favoured and unfavoured enantiomers (ΔG‡) is much larger than would be expected from experiment.[20] These large values correspond to an large separation of products (the higher TS energy is much less likely to be achieved) and thus anomalously high e.e. values; the calculation used to generate e.e. values is exponentially dependent on ΔG‡(shown in eqn. 3 above). Furthermore, as ΔG‡ is derived from the computed G‡ values for each of the enantiomers, it becomes clear that even a small miscalculation of the G‡ could lead to wildly unexpected enantiomeric excess values.
Upon first considering these anomalous results, it appeared possible that the accuracy of the calculation could be called into question, perhaps due to insufficient terms present in the calculation (ie. a high level basis set used.) However it was then discovered that the calculations had used a "ωB97XD/6-311G(d,p)/SCRF=solvent" method[28] which had been used previously in this investigation to model configurations to acceptably high level of accuracy. Further investigation showed that it is common for computed G‡ values to be over approximated using quantum mechanical methods [20] [29] and often a scaling factor is used to bring the values in line with those expected from experiment.[20]. Furthermore, the reactions themselves could also be considered as a source of error in the calculations, particularly those in which the Jacobsen catalyst is used. This is because the mechanism of reaction in the Jacobsen epoxidation is not yet fully understood. The literature suggests that a multitude of transition states have been postulated and the exact structure is yet to be determined.[30].If the mechanism / transition state of a reaction has yet to be fully rationalised theoretically, it could be argued that it would be near impossible to accurately model the transition state's energy, especially in a calculation that does not use ab intiomethods.
Thus to conclude, although the computed e.e. values may not align well with those published in the literature, when compared relatively by catalyst, they appear to fit better with the enantioselectivity hypothesis. It would have been pertinent to compare these results with those achieved in the wet experiment, however due to unforeseen complications, no e.e results were generated in the wet experiment.
Non covalent interactions (NCI) of epoxide transition states
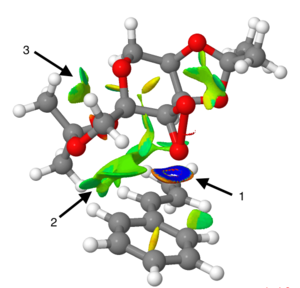
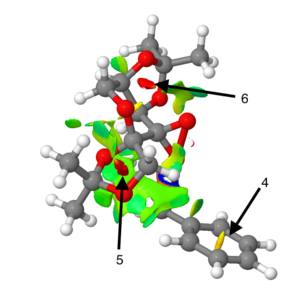
NCI analysis using an electron density map of an epoxide transition state allows for the qualitative determination of non-covalent interactions present in the species. Figures 21 and 22 below exhibit the results of NCI analysis, performed on transition state 3 of TBMSO (R,R) (see Table 13 for reference). N.B. The NCI analysis was performed at the 'fine' level.
Figure 21. NCI electron density plot of TMBSO (R,R) transition state 3
The variance in colour represents the varying degree of NCI interaction whereby blue represents strong attractive interaction, green represents reasonably attractive, yellow represents weakly repulsive and red represents strong repulsive interaction. Arrow 1 on Figure 21 above indicates an area of very strong attractive interactions. Due to its location near the active site of the transition state (dioxirane) it is assumed that this is where the new bond would form. However, as mentioned in the script, as this is such a strong interaction and effectively a precursor to a covalent interaction, it is not recognised as a 'true' non-covalent interaction. Arrows 2 and 3 indicate regions more indicative of true non-covalent interactions, more specifically they appear to be areas of attractive interaction between methyl hydrogens, perhaps around an inter-nuclear separation of 2.4 Å.
Figure 22. Alternative view of Figure 21
Arrow 4 highlights an area of mildly repulsive NCI. As it is centred in a 6-membered ring, it would seem logical to suggest this is arising from the less than optimal VdW radii separation of the six carbon atoms. Arrows 5 and 6 show a stronger repulsive interaction, again centred in a ring, however this time it appears more likely that this could be due a repulsive VdW interaction between the two, electronegative, oxygen atoms present in the same ring.
Electronic topology (QTAIM) in epoxide transition states
The QTAIM analysis can be used in conjunction with the previous NCI analysis to produce a more complete picture of the electron density distribution across the transition state.
Figure 23. Electronic topology plot of TMBSO (R,R) transition state 3
The different coloured dots correspond to different types of interaction (yellow=non covalent interaction; purple= covalent interaction). Examination of Figure 23 shows that the BCPs tend to be located closer to the more electropositive atom in the bond; for instance it is often closer to the H in C-H bonds and very close to the carbons in C-O bonds.
Potential new candidates for investigation
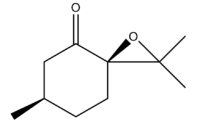
The final stage of the investigation was to identify new potential epoxide candidates to include in subsequent investigations of the same format (ie. 1C experiments). Using the Reaxys database as a starting point, the epoxide substructure was inputted along with specific optical rotary power (-300 >ORP>300) and molecular weight (<200) parameters. This search returned many hundreds of results which was subsequently narrowed down to a final candidate, cis R-(+)-pulegone oxide.
Figure 24. Structure of cis R-(+)-pulegone oxide
This candidate has an ORP of 44.5°[31] and a molecular weight of 168.2. Reaxys suggests that it has been reasonably well characterised, with 14 ORP values listed and has a relatively simple synthetic route. The corresponding alkene for this epoxide ((5R)-5-methyl-2-propan-2-ylidene-cyclohexan-1-one) is available to buy on the kilogram scale at a reasonable price (£65.60 /100 g) from Sigma Aldrich and hence could also be used in the lab experiment (1S).
References
- ↑ 1.0 1.1 Caramella, P., Quadrelli, P., & Toma, L. (2002). An Unexpected Bispericyclic Transition Structure Leading to 4+2 and 2+4 Cycloadducts in the Endo Dimerization of Cyclopentadiene. Journal of the American Chemical Society, 124(7), 1130–1131. doi:10.1021/ja016622h
- ↑ Elmore, S. W., & Paquette, L. A. (1991). The first thermally-induced retro-oxy-cope rearrangement. Tetrahedron Letters, 32(3), 319–322. doi:10.1016/S0040-4039(00)92617-0
- ↑ Rzepa, H. (2009). Taxol Molecules. Imperial Chemistry Wiki. Retrieved December 03, 2014, from https://wiki.ch.ic.ac.uk/wiki/index.php?title=File:Taxol_molecules.gif
- ↑ Rzepa, H. (2014). Cycloalkanes. Conformational Analysis. Retrieved from http://www.ch.ic.ac.uk/local/organic/conf/c1_rings.html
- ↑ Rocha, W. R., Pliego, J. R., Resende, S. M., Dos Santos, H. F., De Oliveira, M. A., & De Almeida, W. B. (1998). Ab initio conformational analysis of cyclooctane molecule. Journal of Computational Chemistry, 19(5), 524–534. doi:10.1002/(SICI)1096-987X(19980415)19:5<524::AID-JCC5>3.0.CO;2-O
- ↑ 6.0 6.1 6.2 6.3 Rzepa, H. (2012). An orbital analysis of the stereochemistry of the E2 elimination reaction. Chemistry with a twist. Retrieved December 07, 2014, from http://www.ch.imperial.ac.uk/rzepa/blog/?p=6205
- ↑ Bredt, J. (1924). Über sterische Hinderung in Brückenringen (Bredtsche Regel) und über diemeso-trans-Stellung in kondensierten Ringsystemen des Hexamethylens. Justus Liebig’s Annalen Der Chemie, 437(1), 1–13. doi:10.1002/jlac.19244370102
- ↑ 8.0 8.1 8.2 Maier, W. F., & Schleyer, P. V. R. (1981). Evaluation and prediction of the stability of bridgehead olefins. Journal of the American Chemical Society, 103(8), 1891–1900. doi:10.1021/ja00398a003
- ↑ 9.0 9.1 9.2 9.3 9.4 9.5 Paquette, L. A., Pegg, N. A., Toops, D., Maynard, G. D., & Rogers, R. D. (1990). [3.3] Sigmatropy within 1-vinyl-2-alkenyl-7,7-dimethyl-exo-norbornan-2-ols. The first atropselective oxyanionic Cope rearrangement. Journal of the American Chemical Society, 112(1), 277–283. doi:10.1021/ja00157a043
- ↑ 10.0 10.1 Braddock, D. C., & Rzepa, H. S. (2008). Structural reassignment of obtusallenes V, VI, and VII by GIAO-based density functional prediction. Journal of Natural Products, 71(4), 728–30. doi:10.1021/np0705918
- ↑ 11.0 11.1 Bondi, A. (1964). van der Waals Volumes and Radii. The Journal of Physical Chemistry, 68(3), 441–451. doi:10.1021/j100785a001
- ↑ Cavallo, L., & Jacobsen, H. (2004). Toward a catalytic cycle for the Mn-salen mediated alkene epoxidation: a computational approach. Inorganic Chemistry, 43(6), 2175–82. doi:10.1021/ic0353615
- ↑ Wang, Z.-X., Frohn, M., & Shi, Y. (2003). Asymmetric epoxidation of trans-b-methylstyrene and 1-phenylcyclohexene using a D-fructose-derived ketone: (R,R)-trans-b-methylstryrene oxide and (R,R)-1-phenylcyclohexene oxide . Organic Syntheses, 80, 9. doi:10.15227/orgsyn.080.0009
- ↑ Besse, P., Renard, M. F., & Veschambre, H. (1994). Chemoenzymatic synthesis of chiral epoxides. Preparation of 4-phenyl-2,3-epoxybutane and 1-phenyl-1,2-epoxypropane. Tetrahedron: Asymmetry, 5(7), 1249–1268. doi:10.1016/0957-4166(94)80167-3
- ↑ Sasaki, H., Irie, R., Hamada, T., Suzuki, K., & Katsuki, T. (1994). Rational design of Mn-salen catalyst (2): Highly enantioselective epoxidation of conjugated cis olefins. Tetrahedron, 50(41), 11827–11838. doi:10.1016/S0040-4020(01)89298-X
- ↑ Boyd, D. R., Sharma, N. D., Agarwal, R., Kerley, N. A., McMordie, R. A. S., Smith, A., … Sheldrake, G. N. (1994). A new synthetic route to non-K and bay region arene oxide metabolites from cis-diols. Journal of the Chemical Society, Chemical Communications, (14), 1693. doi:10.1039/c39940001693
- ↑ 17.0 17.1 Izumi, H., Futamura, S., Nafie, L. A., & Dukor, R. K. (2003). Determination of molecular stereochemistry using vibrational circular dichroism spectroscopy: absolute configuration and solution conformation of 5-formyl-cis, cis-1,3,5-trimethyl-3-hydroxymethylcyclohexane-1-carboxylic acid lactone. Chemical Record (New York, N.Y.), 3(2), 112–9. doi:10.1002/tcr.10055
- ↑ Schneebeli, S. T., Hall, M. L., Breslow, R., & Friesner, R. (2009). Quantitative DFT modeling of the enantiomeric excess for dioxirane-catalyzed epoxidations. Journal of the American Chemical Society, 131(11), 3965–73. doi:10.1021/ja806951r
- ↑ 19.0 19.1 19.2 19.3 19.4 19.5 19.6 Wang, Z.-X., Tu, Y., Frohn, M., Zhang, J.-R., & Shi, Y. (1997). An Efficient Catalytic Asymmetric Epoxidation Method. Journal of the American Chemical Society, 119(46), 11224–11235. doi:10.1021/ja972272g
- ↑ 20.0 20.1 20.2 20.3 20.4 Schneebeli, S., & Hall, M. (2009). Quantitative DFT modeling of the enantiomeric excess for dioxirane-catalyzed epoxidations. Journal of the American …, 131, 3965–3973. Retrieved from http://pubs.acs.org/doi/abs/10.1021/ja806951r
- ↑ 21.0 21.1 Jacobsen, E. N., Zhang, W., Muci, A. R., Ecker, J. R., & Deng, L. (1991). Highly enantioselective epoxidation catalysts derived from 1,2-diaminocyclohexane. Journal of the American Chemical Society, 113(18), 7063–7064. doi:10.1021/ja00018a068
- ↑ 22.0 22.1 Hanson, J. (2001). Synthesis and Use of Jacobsen’s Catalyst: Enantioselective Epoxidation in the Introductory Organic Laboratory. Journal of Chemical Education, 78(9), 1266. doi:10.1021/ed078p1266. a This value refers to trans-α-methylstyrene
- ↑ Rispens, M. T., Meetsma, A., & Feringa, B. L. (1994). Crystal and Molecular Structure and Reactivity of Jacobsen Epoxidation Catalyst N , N ’ -di ( 3- t -butyl-5-methyl salicylidene ) cyclohexanediamine manganese ( III ) chloride · MeCN. Recl. Trav. Chim. Pays-Bas, 113, 413–415.
- ↑ Hanson, J. (2001). Synthesis and Use of Jacobsen’s Catalyst: Enantioselective Epoxidation in the Introductory Organic Laboratory. Journal of Chemical Education, 78(9), 1266. doi:10.1021/ed078p1266
- ↑ Zhang, W., & Jacobsen, E. N. (1991). Asymmetric olefin epoxidation with sodium hypochlorite catalyzed by easily prepared chiral manganese(III) salen complexes. The Journal of Organic Chemistry, 56(7), 2296–2298. doi:10.1021/jo00007a012
- ↑ Singleton, D. A., & Wang, Z. (2005). Isotope effects and the nature of enantioselectivity in the shi epoxidation. The importance of asynchronicity. Journal of the American Chemical Society, 127(18), 6679–85. doi:10.1021/ja0435788
- ↑ Frohn, M., & Shi, Y. (2000). Chiral Ketone-Catalyzed Asymmetric Epoxidation of Olefins. Synthesis, 2000(14), 1979–2000. doi:10.1055/s-2000-8715
- ↑ Rzepa, H. (2014). Enantioselective epoxidation of alkenes using the Shi Fructose-based catalyst. An undergraduate experiment. Chemistry with a twist. Retrieved December 04, 2014, from http://www.ch.imperial.ac.uk/rzepa/blog/?p=12308
- ↑ Corbeil, C. R., Thielges, S., Schwartzentruber, J. A., & Moitessier, N. (2008). Toward a Computational Tool Predicting the Stereochemical Outcome of Asymmetric Reactions: Development and Application of a Rapid and Accurate Program Based on Organic Principles. Angewandte Chemie, 120(14), 2675–2678. doi:10.1002/ange.200704774
- ↑ Linker, T. (1997). The Jacobsen–Katsuki Epoxidation and Its Controversial Mechanism. Angewandte Chemie International Edition in English, 36(19), 2060–2062. doi:10.1002/anie.199720601
- ↑ Bach, R. D., & Klix, R. C. (1985). On the geometric requirements for concerted 1,2-carbonyl migration in α,β-epoxy ketones. Tetrahedron Letters, 26(8), 985–988. doi:10.1016/S0040-4039(00)98492-2


