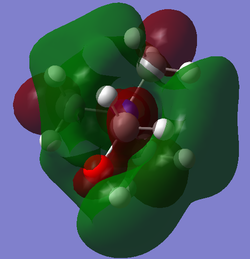
Rep:Mod:pjm11
EX3 optimisation
BH3 (B3LYP / 3-21G basis set)
The optimisation log file for BH3 (using the 3-21G basis set) can be found here
BH3 (B3LYP/6-31G(d,p) basis set)
The optimisation log file for BH3 (using the 6-31G(d,p) basis set) can be found here
| Summary Data | Convergence Data | Jmol | |||
|---|---|---|---|---|---|
 |
 Item                       Value     Threshold  Converged?
 Maximum Force            0.000203     0.000450     YES
 RMS     Force            0.000098     0.000300     YES
 Maximum Displacement     0.000653     0.001800     YES
 RMS     Displacement     0.000415     0.001200     YES
 Predicted change in Energy=-1.436188D-07
 Optimization completed.
-- Stationary point found. |
|
GaBr3 (B3LYP/LANL2DZ)
The optimisation log file can be found here: DOI:10042/110530
| Summary Data | Convergence Data | Jmol | |||
|---|---|---|---|---|---|
 |
 Item                       Value     Threshold  Converged?
 Maximum Force            0.000000     0.000450     YES
 RMS     Force            0.000000     0.000300     YES
 Maximum Displacement     0.000003     0.001800     YES
 RMS     Displacement     0.000002     0.001200     YES
 Predicted change in Energy=-1.282696D-12
 Optimization completed.
-- Stationary point found. |
|
BBr3 (B3LYP/6-31G(d,p)LANL2DZ)
The optimisation log file can be found here: DOI:10042/110543
| Summary Data | Convergence Data | Jmol | |||
|---|---|---|---|---|---|
 |
 Item                       Value     Threshold  Converged?
 Maximum Force            0.000008     0.000450     YES
 RMS     Force            0.000005     0.000300     YES
 Maximum Displacement     0.000036     0.001800     YES
 RMS     Displacement     0.000023     0.001200     YES
 Predicted change in Energy=-4.027374D-10
 Optimization completed.
-- Stationary point found. |
|
Comparison of EX3 Geometries
| BH3 | BBr3 | GaBr3 | |
|---|---|---|---|
| r(E-X) (Å) | 1.19 (lit. 1.19 [1]) | 1.93 (lit. 1.90 [2]) | 2.35 (lit. 2.25 [3]) |
| θ(X-E-X) (°) | 120 (lit. 120 [4]) | 120 (lit. 120 [5]) | 120 |
The data displayed above show that changing the ligand (ie. BH3 and BBr3) results in a change in the bond length (an elongation from BH3 to BBr3). This is due to a change in orbital size; Br atomic orbitals are significantly larger and more diffuse than those of H. Boron is in row 2 of the periodic table, hydrogen is in row 1 and bromine in row 4. The overlap of the hydrogen AOs with the boron AOs will be significantly better than that of bromine as they are of a similar size, due to their closer nature in the periodic table (c.f. bromine). This increased overlap results in a stronger, shorter bond. In addition, hydrogen atoms are significantly smaller than the large, bulky atoms of bromine and hence can be accommodated much closer around the relatively small boron centre, resulting in a shorter bond length.
Altering the central atom also results in an elongation of bond length (from BBr3 to GaBr3). If the same reasoning were to be used as above, it would be expected that the bond length would in fact decrease as B and Br are not in the same row but Ga and Br are in the same row. However, in this case, the steric hinderance argument makes a greater contribution. Although Ga and Br are in the same row, Ga has a significantly larger covalent radius(1.23 Å[3]) than B (0.84 Å[3]) (as does Br for that matter (1.17 Å[3]), as previously discussed). As a result there is significant steric clash between the large Ga and Br atoms and hence the bond lengthens in order to accommodate the larger sized atoms. In this case, the steric effect overrides the same row argument used above.
Comparing gallium and boron, there are some similarities and differences between the elements. They are both in group 13 of the periodic table and hence have a similar valence electron configuration, as a result they should form a similar number of bonds. Ga is larger, due to its lower position on the periodic table which brings steric clash considerations. Boron manages to avoid steric clash itself as it is much smaller (higher on the periodic table) but as a result, may not be able to accommodate as many ligands/atoms around itself when acting as a central atom. Boron has a higher electronegativity value (2.04[6]) than Ga (1.81[6]) which results in greater electron density localised on the boron than gallium in a corresponding molecule. Boron's greater electronegativity also results in more polar covalent bonds being formed (c.f. with gallium); this can have wide ranging effects on the properties of the molecules.
A bond can be thought of as two atoms or molecules bound together by some forces of attraction. The nature of these forces can vary dramatically dependent on the molecule. It is often (incorrectly) assumed that there are two types of bond: covalent (a shared pair of electrons) and ionic (e- transfer between two atoms to form ions, held together by strong electrostatic forces of attraction. However this gives an inaccurate picture of bonding. A more accurate portrayal would be a spectrum on which covalent and ionic bonds represent the two possible extremes. For instance it is possible to have polar covalent bonds (eg. H2O), formed when atoms with high polarisability are involved . Additionally molecules can be described as covalent with a degree of ionic character (eg. LiI). The position particular bonds on this spectrum are influenced by many factors including electronegativity of the atoms involved and their associated dipole moments.
In terms of the strength of bonds, this is also most helpfully described as a spectrum from very weak bonds or interactions to extremely strong covalent bonds. At the weak end of the spectrum there are intermolecular interactions. These might not formally be classed as a bond but they are forces of attraction between two atoms or molecules (see definition above); e.g. Van der Waals interactions between N2 molecules in liquid nitrogen. An example of a weak covalent bond is I-I (152 kJmol-1 [3]). A medium strength bond such as H-Cl has a bond dissociation enthalpy of 427 kJmol-1 [6]. Finally, an example of a strong bond is the triple bond found in N2 which has a bond dissociation enthalpy of 945 kJmol-1 [6].
In order to facilitate a discussion such as the one above, calculations on the molecules in question have to be perfomed on Gaussian the results visualised in Gaussview. Occasionally Gaussview does not display bonds in molecules in which we would expect there to be bonds. This does not mean that the bond does not exist, it is simply a product of the parameters gaussview uses. When deciding where to display bonds, gaussview has a range of bond lengths for which it will display a bond. If a bond length falls outside these parameters, a bond will not be displayed. This does not mean that the bond does not exist, simply that it is outside the parameters of the system. If the parameters were altered to include the increased bond length within the range, the bond would be displayed.
Frequency analysis
BH3 (B3LYP/6-31G(d,p))
The BH3 frequency file is: here
| Summary Data | Low Frequencies |
|---|---|

|
Low frequencies --- -10.1940 -10.1821 -3.1776 0.0004 0.0579 0.4920 Low frequencies --- 1162.9850 1213.1461 1213.1463 |
| Wavenumber (cm-1) | Intensity | IR active? | Type |
| 1163 | 93 | Yes | Bend |
| 1213 | 14 | Yes | Bend |
| 1213 | 14 | Yes | Bend |
| 2583 | 0 | No | Stretch |
| 2716 | 126 | Yes | Stretch |
| 2716 | 126 | Yes | Stretch |
Some of the vibrations are not shown on the computed spectrum for a number of reasons. These vibrations are either not IR active or they are degenerate (i.e. they have the same energy and intensity as another vibration). In order for a vibration to IR active, and thus be present on an IR spectrum, the vibration must be associated with a change in dipole moment. The vibrations listed as 'No' under the heading 'IR active?' therefore do not result in a change in dipole moment and are not seen on the spectrum (2583 cm-1). Of the remaining five vibrations, 4 make up two degenerate vibrations and thus only 2 peaks are shown (1213 cm-1 and 2716 cm-1).
GaBr3 (B3LYP/LanL2DZ)
The GaBr3 frequency file is here: DOI:10042/110545
| Summary Data | Low Frequencies |
|---|---|

|
Low frequencies --- -1.4877 -0.0015 -0.0002 0.0096 0.6540 0.6540 Low frequencies --- 76.3920 76.3924 99.6767 |
| Wavenumber (cm-1) | Intensity | IR active? | Type |
| 76 | 3 | Yes | Bend |
| 76 | 3 | Yes | Bend |
| 100 | 9 | Yes | Bend |
| 197 | 0 | No | Stretch |
| 316 | 126 | Yes | Stretch |
| 316 | 126 | Yes | Stretch |
The frequency of a vibration is directly proportional to its energy (as per Planck's equation: E=hν). The energy of a vibration is by definition linked to the strength of the bond(s) involved. As discussed above, the Ga-Br bond length (2.35 Å) is longer than the B-H bond length (1.19 Å) and thus is a weaker bond than the B-H bond. As the Ga-Br bonds are weaker, it would be expected that the energies of the vibrations would be lower than that of B-H which has stronger bonds and hence higher energy vibrations. This is reflected in the large difference between the frequency values illustrated in the spectra above.
| Molecule | Frequency (cm-1) | Intensity | Displacement Diagram |
| BH3 | 1163 | 93 | 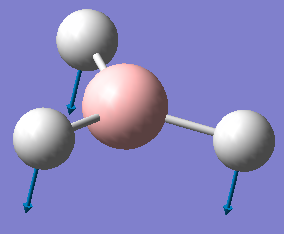
|
| GaBr3 | 100 | 9 | 
|
The nature of the umbrella vibration is different for BH3 and GaBr3. In BH3 the central atom is heavier than the ligands and as a result it is the hydrogen atoms which are displaced, whereas in GaBr3 the central atom is lighter than the ligands and thus the gallium atom is displaced.
It is vitally important to use the same method and basis set for both the optimisation and frequency calculations as it allows for comparison of results (e.g. total energies) across different molecules. Essentially the method and basis set are treated as independent variables (with their own, specific, associated error) in the investigation and the results achieved as dependent variables. The comparison of energies computed with different basis sets/methods are completely obsolete.
Carrying out a frequency analysis allows for confirmation that the minimum structures have been identified on the potential energy surface of the molecule. This is achieved by finding the second derivative of the PES and ensuring that all the frequencies are positive. Additionally, by running a frequency analysis, it allows for the computation of the IR and Raman modes of the molecule which enables comparison with experimental data.
The "Low Frequencies" identified during the frequency analysis of a molecule provide insight into the extent of convergence achieved during the analysis of the (pre-optimised) molecule. Specifically, they relate to the small motions of the centre of mass of the molecule being analysed.
Molecular orbital & NBO analysis
BH3 (B3LYP/6-31G)
BH3 population analysis can be found here:DOI:10042/93628
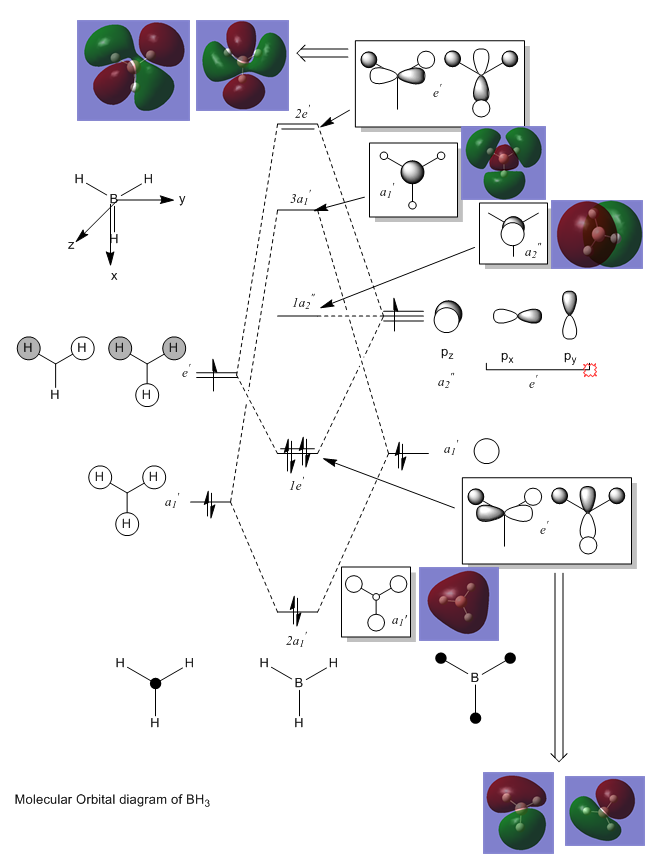
The MO diagram above includes both the computed MOs (boxed in purple) and the LCAO MOs and hence their structures can be compared. The significant difference between the two sets of MOs is the localisation of the surface (electron density) across the molecule. The LCAO MOs are localised on the fragments and provide a clearer picture of the orbitals in play and their specific interactions. Conversely, the computed MOs tend to be much more delocalised across the molecule. This often creates a more complex picture of electron density that can at times be harder to interpret but has a much higher accuracy associated with it. This comparison shows that qualitative MO theory (LCAO MOs) can be used in conjunction (before) the quantitative picture to provide a broad understanding of the MOs and interactions before drilling into the detail of the quantitative picture.
NH3 (B3LYP/6-31G)
An optimisation calculation of the structure of NH3 was run using the B3LYP method in conjunction with the 6-31G(d,p) basis set. The optimisation log file for NH3 can be found here
| Summary Data | Convergence Data |
|---|---|
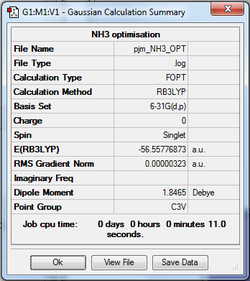 |
Item               Value     Threshold  Converged?
 Maximum Force            0.000006     0.000015     YES
 RMS     Force            0.000004     0.000010     YES
 Maximum Displacement     0.000012     0.000060     YES
 RMS     Displacement     0.000008     0.000040     YES
 Predicted change in Energy=-9.843853D-11
 Optimization completed.
    -- Stationary point found.
|
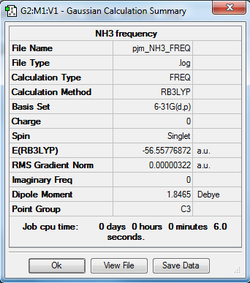
The log file of the optimised structure, obtained above, was then used as a starting point to generate a frequency calculation of the optimised NH3 molecule. The NH3 frequency analysis log can be found here
| Summary Data | Low Frequencies |
|---|---|
|
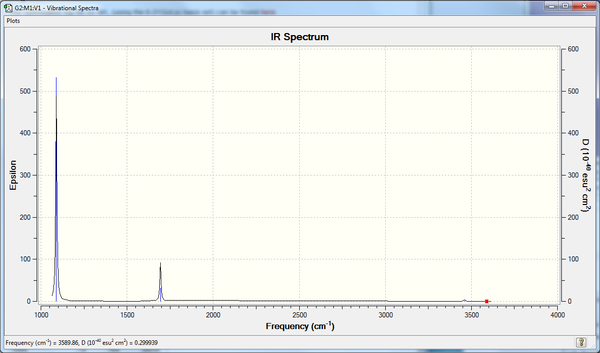
Low frequencies --- -0.0138 -0.0030 0.0013 7.0781 8.0927 8.0932 Low frequencies --- 1089.3840 1693.9368 1693.9368 |
| Wavenumber (cm-1) | Intensity | IR active? | Type |
| 1089 | 145 | Yes | Bend |
| 1694 | 14 | Yes | Bend |
| 1694 | 14 | Yes | Bend |
| 3461 | 1 | Slightly | Stretch |
| 3590 | 0 | No | Stretch |
| 3590 | 0 | No | Stretch |
The NH3 frequency analysis file was used as a starting point to carry out a population analysis of the optimised NH3 structure. The population analysis log can be found here
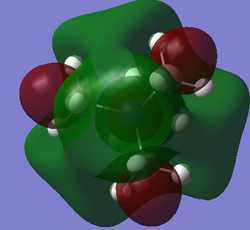
The table below presents the occupied MOs of NH3.
| MO | MO surface |
|---|---|
| 1 | 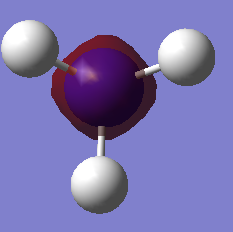
|
| 2 | 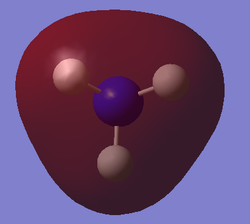
|
| 3 | 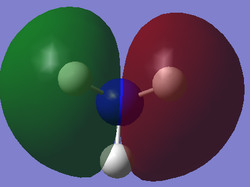
|
| 4 | 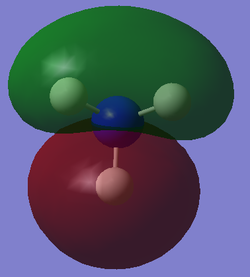
|
| 5 | 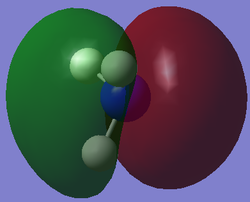
|
NH3 Natural Bond Orbital (NBO) Analysis
The NH3 population analysis log file above was used to investigate the natural bond orbitals of NH3. The data attained is recorded in the table below.
| NBO Charge Distribution | Charge Colour Range | Specific NBO Charges |
|---|---|---|
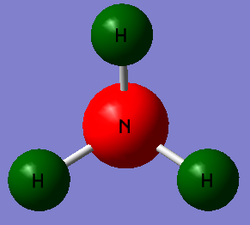 |
-1.125 to 1.125 | N:-1.125
H:0.375 |
Association Energies (Ammonia-Borane)
An optimisation calculation of the structure of NH3BH3 was run using the B3LYP method in conjunction with the 6-31G(d,p) basis set.
The optimisation log file for NH3BH3 can be found here
| Summary Data | Convergence Data |
|---|---|
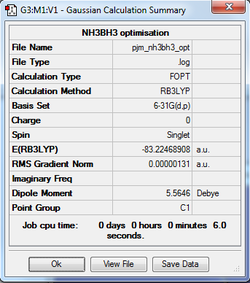 |
Item               Value     Threshold  Converged?
 Maximum Force            0.000002     0.000015     YES
 RMS     Force            0.000001     0.000010     YES
 Maximum Displacement     0.000020     0.000060     YES
 RMS     Displacement     0.000010     0.000040     YES
 Predicted change in Energy=-7.832356D-11
 Optimization completed.
    -- Stationary point found.
|
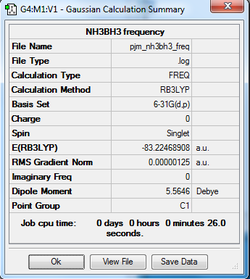
The optimised structure of NH3BH3 was then used as a starting point to generate a frequency calculation.
The NH3BH3 frequency analysis log can be found here
| Summary Data | Low Frequencies |
|---|---|
|
Low frequencies --- -3.8381 -0.0007 0.0009 0.0010 1.9637 3.1331 Low frequencies --- 263.4786 632.9616 638.4481 |
| Wavenumber (cm-1) | Intensity | IR active? | Type |
| 263 | 0 | No | Bend |
| 633 | 14 | Yes | Stretch |
| 638 | 4 | Yes | Bend |
| 639 | 4 | Yes | Bend |
| 1069 | 41 | Yes | Bend |
| 1069 | 41 | Yes | Bend |
| 1196 | 109 | Yes | Bend |
| 1204 | 3 | Yes | Bend |
| 1204 | 3 | Yes | Bend |
| 1329 | 114 | Yes | Bend |
| 1676 | 28 | Yes | Bend |
| 1676 | 28 | Yes | Bend |
| 2472 | 67 | Yes | Stretch |
| 2532 | 231 | Yes | Stretch |
| 2532 | 231 | Yes | Stretch |
| 3464 | 3 | Yes | Stretch |
| 3581 | 28 | Yes | Stretch |
| 3581 | 28 | Yes | Stretch |
The energies of NH3, BH3 and NH3BH3 were attained from their respective geometry data summary tables and used in the following comparison.
| Molecule | Energy (au) | Energy (kJmol-1) |
| NH3 | -56.5577687 | -148492.43 |
| BH3 | -26.6153235 | -69878.54 |
| NH3BH3 | -83.2246891 | -218506.44 |
Thus the dissociation energy of NH3BH3 can be determined with the following calculation:
ΔE=E(NH3BH3)-[E(NH3)+E(BH3)]
Using the data in the table above, this value is calculated as: -0.0515969 au or -135.47 kJmol-1.
This value appears reasonably inline with what would be expected for a bond dissociation enthalpy (in the hundreds of kJmol-1). Comparing this value to those discussed in the strength of bonds discussion above, the NH3BH3 (N-B) bond would be categorised as a weak bond as it is even weaker than the bond dissociation enthalpy used as an example of a weak bond (I-I; 152kJmol-1). The bond arises from the lone pair donation from the N atom to the B atom forming a dative covalent bond. The literature describes the bond dissociation enthalpy of this bond as 65.5 kcal/mol[7] which converts to -274kJmol-1. This is over double the size of the computed bond dissociation enthalpy and there are various potential reasons for this dissimilarity. The literature[7] describes back bonding from the boron atom the nitrogen atom which could rationalise some of the difference in energy by increasing the strength of the B-N bond. In addition, it is likely that the basis set used to calculate the larger dissociation enthalpy, reported in the literature, was significantly more precise than the 6-31G basis set used in this investigation.
Ionic Liquids - Comparison of 'onium' cations
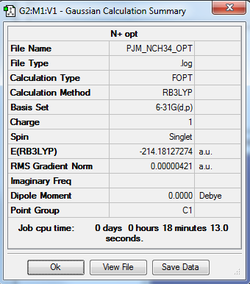
[N(CH3)4]+
The cation's geometry was optimised and the optimisation log file can be found here
| Summary Data | Convergence Data | Jmol | |||
|---|---|---|---|---|---|
 |
Item               Value     Threshold  Converged?
 Maximum Force            0.000011     0.000015     YES
 RMS     Force            0.000003     0.000010     YES
 Maximum Displacement     0.000051     0.000060     YES
 RMS     Displacement     0.000013     0.000040     YES
 Predicted change in Energy=-4.687127D-10
 Optimization completed.
-- Stationary point found. |
|
The log file of the optimised structure was used to generate a frequency calculation of [N(CH3)4]+.
The [N(CH3)4]+ frequency analysis log can be found here DOI:10042/101573
| Summary Data | Low Frequencies |
|---|---|

|
Low frequencies --- -8.9566 -5.5859 -4.0848 -0.0002 0.0005 0.0008 Low frequencies --- 182.3528 288.1546 288.5266 |
[N(CH3)4]+ MO analysis
All of the MOs discussed below are occupied, bonding MOs. Unoccupied MOs have not been discussed as they are calculated differently by Gaussian and thus a comparison with occupied MOs would be obsolete.
| MO number | MO structure | Energy | Interaction |
|---|---|---|---|
| 6 |  |
-1.19646 au / -3141.31 kJmol-1 | The 6th MO is the first non core orbital of [N(CH3)4]+. It is delocalised across the whole molecule and is totally symmetric which is expected because of it's tetrahedral geometry. It's lack of nodes (there are no changes of phase, all interactions are in-phase interactions) and hence its relatively low energy, results in a strongly bonding MO. The MO appears to sag inwards towards the central nitrogen as it is significantly more electronegative than the other atoms in the molecule and draws electron density towards itself. |
| 8 | 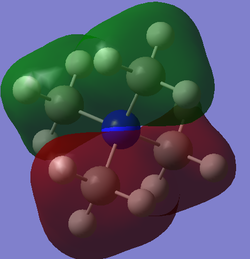 |
-0.92556 au / -2430.06 kJmol-1 | The relatively low energy of this MO again suggests that it is strongly bonding. This is shown on the diagram by strong through-bond s-orbital interactions centred on the methyl groups. In contrast to the previous MO, this MO has nodal points and consequently has aspects of antibonding character introduced by the reasonably strong through space, antibonding interactions. This is illustrated in the marked increase in energy of this MO from the previous MO. The nodal point arises from a nitrogen p-orbital interacting with s-orbitals from the methyl groups above and below the plane , which thus enables for antibonding interactions (as different phases are present). |
| 10 |  |
-0.80746 au / -2119.99 kJmol-1 | This MO exhibits strong through-bond antibonding interaction between the electron density in the nitrogen s-orbital and the surrounding carbon s-orbitals. These interactions raise the energy of the molecule. There are through space bonding interactions between the s-orbitals of hydrogens on adjacent methyl groups which helps to stabilise the molecule. Going back to the MO analysis of BH3 and its subsequent MO diagram, it can be inferred that this MO is effectively the other in the pair (or antibonding MO) of MO 6 in this table. However by examination of its energy, in the case of [N(CH3)4]+ it is a bonding MO, unlike in BH3 where the equivalent MO is an antibonding MO. |
| 16 | 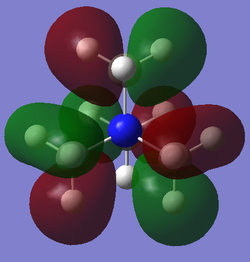 |
-0.58035 au / -1523.71 kJmol-1 | This MO illustrates another marked increase in energy due to significant through space antibonding interactions. The strong thorugh space antibonding interactions between the elongated lobes (formed by p (carbon atoms) and s (hydrogen atoms) orbital overlap) localised over the methyl groups strongly increase the energy of the molecule. The molecule is relatively highly symmetric but this is facilitated by a large increase in the number of nodes present in the MO, which, by proxy (enabling more thorugh space antibonding interactions) further increases the energy of the molecule. There is also some through space bonding interaction between lobes of the same phase. However this is weak in magnitude due to the distance between these lobes. |
| 21 | 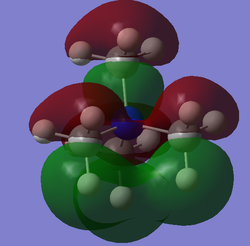 |
-0.57934 au / -1521.06 kJmol-1 | This is the HOMO of [N(CH3)4]+ and appears to have bonding character overall as would be expected for a HOMO. This is brought about by the strong through-bond bonding interaction above and below the nitrogen atom (green lobes). There is also weak through-space bonding interactions between lobes of the opposite phase (red). The molecule appears to have a relatively high concentration of nodes brought about by the contribution of C and N p-orbitals to the MO. The energy of the MO is raised by both through bond and through space antibonding interactions present in the MO. |
[P(CH3)4]+
It should be noted that the origoinal optimisation of the phosphorus cation was unsuccessful; the geometry did not converge. After discussion with a demonstrator and analysis of the intermediate geometry optimisation profile, it was determined that this was potentially due to symmetry being imposed on the molecule, by Gaussian, in order to speed up the calculation.
Once removed the cation's geometry was optimised and the optimisation log file can be found here
| Summary Data | Convergence Data | Jmol | |||
|---|---|---|---|---|---|
 |
Item               Value     Threshold  Converged?
 Maximum Force            0.000000     0.000015     YES
 RMS     Force            0.000000     0.000010     YES
 Maximum Displacement     0.000031     0.000060     YES
 RMS     Displacement     0.000012     0.000040     YES
 Predicted change in Energy=-1.698864D-11
 Optimization completed.
-- Stationary point found. |
|
The log file of the optimised structure was used to generate a frequency calculation of [P(CH3)4]+.
The [P(CH3)4]+ frequency analysis log can be found here DOI:10042/101540
| Summary Data | Low Frequencies |
|---|---|

|
Low frequencies --- -11.5558 -0.0029 -0.0021 -0.0021 4.4482 11.2570 Low frequencies --- 156.3697 191.9820 192.2254 |
[S(CH3)3]+
The optimisation log file for [S(CH3)3]+ can be found here
| Summary Data | Convergence Data | Jmol | |||
|---|---|---|---|---|---|
 |
Item               Value     Threshold  Converged?
 Maximum Force            0.000014     0.000015     YES
 RMS     Force            0.000004     0.000010     YES
 Maximum Displacement     0.000055     0.000060     YES
 RMS     Displacement     0.000018     0.000040     YES
 Predicted change in Energy=-1.924800D-11
 Optimization completed.
-- Stationary point found. |
|
The log file of the optimised structure was used to generate a frequency calculation of [S(CH3)3]+.
The [S(CH3)3]+ frequency analysis log can be found here DOI:10042/101500
| Summary Data | Low Frequencies |
|---|---|

|
Low frequencies --- -8.9536 -2.4333 -0.0013 0.0031 0.0043 12.9033 Low frequencies --- 161.9829 199.2582 199.9441 |
Ionic Liquids - Cation Data Comparison
The cation population analysis log files above were used to investigate the natural bond orbitals of the three cations above. The log files can be found here: [N(CH3)4]+ [P(CH3)4]+ [S(CH3)3]+. The data attained is recorded in the table below. The charge range has been fixed to -1.000 to 1.000 in order to ensure it is the same for all of the images presented.
| Cation | NBO Charge Distribution | Specific NBO Charges | Bond orbital/ Coefficients/ Hybrids Analysis |
|---|---|---|---|
| [N(CH3)4]+ | 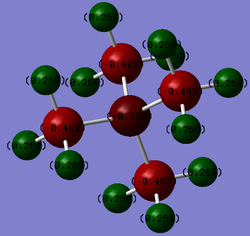 |
N:-0.295
C:-0.483 H:0.269 |
 4. (1.98452) BD ( 1) C   1 - N  17
                ( 33.65%)   0.5801* C   1 s( 20.78%)p 3.81( 79.06%)d 0.01(  0.16%)
                                           -0.0003 -0.4552  0.0237 -0.0026  0.2121
                                            0.0090 -0.6446 -0.0274 -0.5733 -0.0243
                                            0.0122  0.0108 -0.0329  0.0165 -0.0051
                ( 66.35%)   0.8145* N  17 s( 25.00%)p 3.00( 74.97%)d 0.00(  0.03%)
                                            0.0000 -0.5000  0.0007  0.0000 -0.2068
                                            0.0000  0.6282 -0.0001  0.5588 -0.0001
                                            0.0053  0.0048 -0.0144  0.0072 -0.0022
|
| [P(CH3)4]+ | 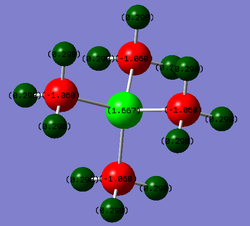 |
P: 1.667
C: -1.060 H:0.298 |
 4. (1.98031) BD ( 1) C   1 - P  17
                ( 59.57%)   0.7718* C   1 s( 25.24%)p 2.96( 74.67%)d 0.00(  0.08%)
                                            0.0002  0.5021  0.0171 -0.0020 -0.5630
                                            0.0103 -0.4633  0.0085  0.4635 -0.0085
                                            0.0176 -0.0176 -0.0145  0.0034 -0.0020
                ( 40.43%)   0.6358* P  17 s( 25.00%)p 2.97( 74.15%)d 0.03(  0.85%)
                                            0.0000  0.0001  0.5000 -0.0008  0.0000
                                            0.0000  0.5611 -0.0008  0.0000  0.4620
                                           -0.0007  0.0000 -0.4617  0.0006  0.0559
                                           -0.0559 -0.0460  0.0109 -0.0063
|
| [S(CH3)3]+ | 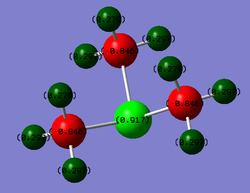 |
S:0.917
C:-0.846 H:0.279 |
4. (1.98631) BD ( 1) C   1 - S  13
                ( 48.67%)   0.6976* C   1 s( 19.71%)p 4.07( 80.16%)d 0.01(  0.14%)
                                           -0.0003 -0.4437 -0.0140  0.0033  0.2365
                                           -0.0018  0.7832 -0.0061  0.3635  0.0098
                                           -0.0147 -0.0069 -0.0230  0.0221  0.0096
                ( 51.33%)   0.7165* S  13 s( 16.95%)p 4.86( 82.42%)d 0.04(  0.63%)
                                            0.0000 -0.0001 -0.4117  0.0075 -0.0012
                                            0.0000 -0.2347  0.0103  0.0000 -0.7772
                                            0.0342  0.0000 -0.4039 -0.0260 -0.0274
                                           -0.0179 -0.0594  0.0412  0.0051
|
The cation data geometry data table below shows that despite a similar structure, the geometry of the cations can vary due to various electronic effects.
| [N(CH3)4]+ | [P(CH3)4]+ | [S(CH3)3]+ | |
|---|---|---|---|
| r(C-X) (Å) | 1.51 (lit. 1.50[8] ) | 1.82 (lit. 1.81[9]) | 1.82 |
| θ(C-X-C) (°) | 109 | 109 | 103 |
It can be seen that the C-X bond length in the nitronium ion (1.51 Å) is significantly shorter than that of the phosphonium and sulphonium (both 1.82 Å) ions. This is most likely due to the more complementary overlap of the carbon and nitrogen atomic orbitals in comparison to that of carbon and phosphorus or carbon and sulphur. Carbon and nitrogen are next to each other on the second row of the periodic table and hence their atomic orbitals are likely to be of a similar size and hence overlap well in bond formation. This is in contrast to phosphorus and sulphur, again next to each other, but this time on the 3rd row of the periodic table. These atoms are larger and hence their orbitals are likely to be more diffuse than those of nitrogen. As a result, the overlap between the carbon and phosphorus/sulphur atomic orbitals is not as strong as with nitrogen and hence these bonds are weaker and longer.
It can also be seen that the bond angle of the sulphonium ion is smaller (103°) than that of the nitronium and phosphonium ions (both 109°). This is due to the presence of a lone pair of electrons located on the sulphur atom in the cation. The repulsion between the lone pair and the bonding pairs of electrons (specifically the other S-C bonds) results in the the repulsion of the S-C bonds away from the lone pair and thus the compression of the C-S-C bond angle from 109° seen in the nitronium and phosphonium ions to 103°.
It is traditionally assumed that the positive charge of [N(CH3)4]+ is localised on the nitrogen atom. This is due to the hypothesis that the nitrogen donates an electron to form a covalent bond with the 4th methyl group. The use of this electron in the covalent bond is the origin of the positive charge on the nitrogen. This traditional description directly contradicts the results of the NBO charge analysis which dictates that the nitrogen has a negative, rather than positive, charge. The positive charge of the molecule is in fact delocalised across the methyl groups. The majority of this charge appears to be located on the (electropositive) hydrogen atoms (which have positive charges of 0.269) rather than the (electronegative) nitrogen. If the positive charges of 3 hydrogen atoms is combined with the negative charge of their parent carbon atom, each methyl group has an overall positive charge of 0.324 (-0.483 + (3*0.269) = 0.324) which when multiplied by 4 and added to the charge of the central atom gives an overall charge of +1 (-0.295 + (0.324*4) = 1.001).
The NBO charge analysis can also be use to compare the distribution of charges across the three cations. The nitrogen atom in the [N(CH3)4]+ cation has a negative charge (as discussed previously) due to its high electronegativity. However due to its donation of an electron to form a 4th bond, it is more electron deficient than it would be in its tri-coordinate (trimethylamine) state (N.B. The calculation of NBO data for trimethylamine in order to quantitatively compare the difference in charge magnitude on the central nitrogen could be an interesting extension to the investigation. However, unfortunately time constraints did not permit this extension in this case). This depletion of electron density results in the relative negative charge of the nitrogen being smaller in magnitude than the negative charge located on the surrounding carbons (-0.295 on N compared with -0.483 on the surrounding methyl carbons). The origin of the carbons' negative charge could be attributed to their role as the more electronegative species in the C-H bonds of the methyl groups, resulting in a localisation of electron density on the carbons and hence its negative charge. As mentioned previously the net positive charge of the molecule appears to be evenly distributed throughout the molecule. This is due to the strong overlap of the carbon and nitrogen atomic orbitals (same row, similar orbital shape and size) and subsequent widespread delocalisation of electron density. This distribution of charge across the molecule, and similar electronegativities, results in a relatively small difference in charge magnitude between the nitrogen atom and surrounding carbons (a difference of 0.188). This small difference is not reproduced for the two remaining cations (difference when X = P/S: 2.73/1.76).
The NBO results discussed thus far do not match up with the contributions data outlined below. The contributions data uses only electronegativity data in order to rationalise the results. Combining this NBO charge analysis with electronegativity information (and thus bond contribution data) provides a more accurate picture of the bonding and charge distribution present in the molecule. Simply analysing these two data sets in isolation will lead to NBO and contribution results that cannot be rationalised with one another; only once the various hypotheses discussed in this paragraph are combined and the magnitudes of their effects balanced against each other can the results be rationalised in the case of the nitronium ion.
In stark contrast with the nitronium ion, the phosphonium ion has a large positive charge (1.67) located on the central phosphorus atom. Phosphorus is a row lower than carbon on the periodic table and hence its atomic orbitals and significantly more diffuse than those of carbon (resulting in a weaker overlap in comparison to carbon/nitrogen (same row) overlap). This results in an uneven charge distribution throughout the molecule as it cannot be delocalised as well across the molecule. Phosphorus' larger size results in a low electronegativity value (2.19; electropositive) and therefore it is able to stabilise a positive charge. The surrounding carbons are more electronegative than the phosphorus and thus draw electron density in the C-P bonds away from the central atom. All these factors favour the localisation of the positive charge on the phosphorus. As the carbons are the most electronegative atoms in the molecule, they draw electron density away from both the C-H and C-P bonds resulting in the localisation of negative charge on themselves. This result can be rationalised with the contributions data below; an electropostive P atom and electronegative C atom.
The sulphonium ion picture is reasonably similar to that of nitrogen. The sulphur atom is donating electron density to form a third bond and become tri-coordinate resulting in the formation of a positive charge. The sulphur atom is able to localise this some of this positive charge as it is less electran nitonegative throgen. However it certainly cannot be considered an electropositive atom (it has a greater electronegativity than carbon (2.58 c.f. 2.55)). As a result the contributions data shows a balanced in contribution from both C and S in the C-S bonds.
| [N(CH3)4]+ | [P(CH3)4]+ | [S(CH3)3]+ | |
|---|---|---|---|
| C (%) | 34 | 60 | 49 |
| X (%) | 66 | 40 | 51 |
| Electronegativities [6] | N = 3.04
C = 2.55 |
P = 2.19 C = 2.55 |
S = 2.58 C = 2.55 |
The relative contributions to the C-X bonds can be rationalised by investigation of the differing electronegativities of the X atoms. Nitrogen is significantly more electronegative than carbon and thus draws the electron density of the covalent bond away from the bond and towards itself. This results in a much greater electron density present on the nitrogen atom than on the carbon and hence a much higher contribution result for nitrogen than for carbon. This trend of greater electron density located on the X atom is reversed for the phosphorus cation as it is more electronegative than carbon. In this case, it is the carbon atom that draws the electron density away from the bond resulting in a reversal of contribution result (higher contribution for the C than X (phosphorus) atom. Finally, the contribution results for C and S are very similar to each other due to their almost identical electronegativity values. Neither atom can draw electron density away from the centre of the bond, hence the equal contribution results.
Ionic Liquids - Influence of Functional Groups
[N(CH3)3(CH2OH)]+
The cation's geometry was optimised and the optimisation log file can be found here: DOI:10042/104005 . Following this optimisation, a frequency analysis was carried out, (using this optimised molecule) which returned 1 anomalous imaginary frequency. This was most likely due to a poorly orientated hydrogen atom on the -OH functional group. This hydrogen was displaced manually and the optimisation and frequency analyses were re-run resulting in the removal of the imaginary frequency. The geometry and frequency data displayed below is the data afforded after this re-optimisation, for which the log file can be found here
| Summary Data | Convergence Data | Jmol | |||
|---|---|---|---|---|---|
 |
Item               Value     Threshold  Converged?
 Maximum Force            0.000001     0.000015     YES
 RMS     Force            0.000000     0.000010     YES
 Maximum Displacement     0.000016     0.000060     YES
 RMS     Displacement     0.000004     0.000040     YES
 Predicted change in Energy=-1.219858D-11
 Optimization completed.
-- Stationary point found. |
|
The log file of the optimised structure was used to generate a frequency calculation of [N(CH3)3(CH2OH)]+.
The [N(CH3)3(CH2OH)]+ frequency analysis log can be found here
| Summary Data | Low Frequencies |
|---|---|

|
Low frequencies --- -8.4245 -5.0285 -1.0794 -0.0010 -0.0009 -0.0008 Low frequencies --- 131.1048 213.4613 255.7128 |
The [N(CH3)3(CH2OH)]+ frequency analysis file was used as a starting point to carry out a population analysis of the optimised [N(CH3)3(CH2OH)]+ structure. The population analysis log can be found here
The NBO data attained from this file is summarised below. The charge range was been fixed to -1.000 to 1.000 in order to ensure it is the same for the [N(CH3)3(CH2CN)]+.
| NBO Charge Distribution | Specific NBO Charges |
|---|---|
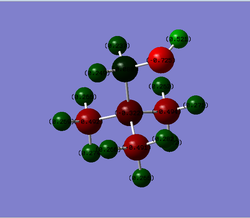 |
N:-0.322
O:-0.725 C(N-C-H):-0.491, -0.492 & -0.494 C(N-C-O):0.088 H(C-H):0.237, 0.249, 0.262, 0.266, 0.266, 0.266, 0.269, 0.271, 0.272, 0.274 & 0.282 H(O-H):0.521 |
[N(CH3)3(CH2CN)]+
The cation's geometry was optimised and the optimisation log file can be found here
| Summary Data | Convergence Data | Jmol | |||
|---|---|---|---|---|---|
 |
Item               Value     Threshold  Converged?
 Maximum Force            0.000001     0.000015     YES
 RMS     Force            0.000000     0.000010     YES
 Maximum Displacement     0.000032     0.000060     YES
 RMS     Displacement     0.000009     0.000040     YES
 Predicted change in Energy=-2.106245D-11
 Optimization completed.
-- Stationary point found. |
|
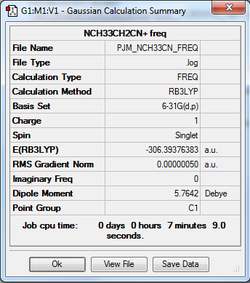
The log file of the optimised structure was used to generate a frequency calculation of [N(CH3)3(CH2CN)]+.
The [N(CH3)3(CH2CN)]+ frequency analysis log can be found here
| Summary Data | Low Frequencies |
|---|---|
|
Low frequencies --- -2.6312 -0.0005 0.0003 0.0008 7.1504 9.6855 Low frequencies --- 91.7745 154.0301 210.9306 |
The [N(CH3)3(CH2CN)]+ frequency analysis file was used as a starting point to carry out a population analysis of the optimised [N(CH3)3(CH2CN)]+ structure. The population analysis log can be found here
The NBO data attained from this file is summarised below.The charge range was been fixed to -1.000 to 1.000 in order to ensure it is the same for the [N(CH3)3(CH2OH)]+.
| NBO Charge Distribution | Specific NBO Charges |
|---|---|
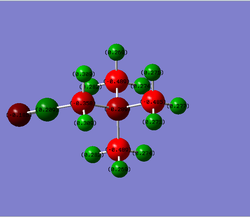 |
N:-0.289
N(CΞN):-0.186 C(N-C-H):-0.485, -0.489, -0.489 C(N-C-C):-0.358 C(CΞN):0.209 H:0.269, 0.269, 0.271, 0.271, 0.274, 0.274, 0.277, 0.282, 0.282, 0.309 & 0.309 |
The functional groups added to the tetraalkyl ammonium cation have different effects on the charge distribution of the molecule. The hydroxyl functional group is an electron donating group and the nitrile is an electron withdrawing group. As a result, we would qualitatively expect that the carbon to which the -OH is attached to have a greater electron density than the carbon to which the -CN is attached.
The charge on the carbons of the original tetraalkyl ammonium cation is -0.483 whereas the charge on the carbon attached to the -OH (electron donating) in [N(CH3)3(CH2OH)]+ is 0.088. However, this contradicts the hypothesis outlined above; the hypothesis would suggest that the charge should be lower (more negative). A potential reason for this deviation is the high Pauling electronegativity of oxygen (3.44 [6]) compared to that of carbon (2.55 [6]). This would counteract the electron donating effect of the -OH group by drawing electron density away from the surrounding atoms, which could result in a deficit of electron density on the carbon attach to the -OH group.
This is another example of the dangers of considering specific factors (in this case donating effects and electronegativity) in isolation in order to explain charge distribution(this idea was touched upon in the cation data comparison); it is not often a simple picture explained by a single factor, moreover a combination of supporting and competing factors that can skew the computed results away from the expected values.
Looking at the remaining atoms further away from the -OH group (and thus less susceptible to the electronegative effects of oxygen), these exhibit behaviour slightly more in line with the hypothesis above. For instance, the hydrogens on the tetraalkyl ammonium cation all have a charge of 0.269 whereas the H atoms attached to the carbon that holds the -OH group have a lower charge of 0.237 and 0.249. In addition the central nitrogen has a greater electron density in the -OH cation (-0.322) compared to that of the tetraalkyl ammonium cation (-0.295).
As mentioned previously, the charge on the carbons of the original tetraalkyl ammonium cation is -0.483 whereas the charge on the carbon (referred to henceforth as C*) attached to the -CN functional group is -0.358. This is in line with the hypothesis expressed above; the electron withdrawing effect of the -CN functional group draws electron density away from the attached carbon, reducing its negative charge. The electronegativity effects discussed above are less relevant in this case as C* is attached to the carbon of the nitrile group; both carbons have the same electronegativities. In terms of charge distribution, the carbon of the nitrile group has a relatively high positive charge (0.209) as it is directly bonded to the electronegative nitrogen. The central nitrogen also appears to be slightly affected by the electron withdrawing ability of the -CN group (it has a charge of -0.289 compared with a charge of -0.295 on the nitrogen of [N(CH3)4]+.
HOMO/LUMO Comparison of N+ cations
| MO | [N(CH3)4]+ | [N(CH3)3(CH2CN)]+ | [N(CH3)3(CH2OH)]+ |
|---|---|---|---|
| HOMO | |||
| LUMO |
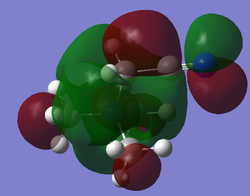
The tetraalkyl ammonium HOMO appears to show relatively equal contributions from both the methyl groups and the nitrogen atom and the MO is delocalised across the molecule. This delocalisation is symmetric which would be expected for a tetrahedral (Td) molecule. There appears to be a reasonably high incidence of nodes (created by the changing phase of the p-orbitals involved in the MO) which brings some antibonding character to the HOMO. Moving to the HOMO of the nitrile containing cation, it appears significantly less delocalised across the molecule with a majority contribution from the nitrile group. Additionally there is a lower incidence of nodes and through space antibonding interactions present in the molecule. Moving to the hydroxyl-containing cation we see slightly more delocalisation across the molecule than that of [N(CH3)3(CH2CN)]+ but still less than that of [N(CH3)4]+. Again there is a large contribution from the -OH functional group (as seen in the nitrile cation) however proportionally it appears to be slightly shmaller than tat from the nitrile functional group. There is an increase in the number of nodes present (compared with [N(CH3)3(CH2CN)]+) as well as increased through space antibonding interactions (derived from its slightly more delocalised structure) resulting in higher antibonding character than that seen in the nitrile cation. However the incidence of nodes and antibonding interactions is still lower than seen in the tetraakyl ammonium cation. The MOs of the latter two molecules show lower levels of symmetry than the tetraalkyl ammonium HOMO. This is as expected as the molecules themselves are not as symmetric as [N(CH3)4]+ due to the introduction of functional groups which results in the subsequent reduction of molecule symmetry. As a consequence, the HOMOs of these molecules are not as symmetric as [N(CH3)3(CH2CN)]+.
The LUMOs of these cations are slightly more challenging to discuss as they are not produced using the same type of calculation on Gaussian as they are unoccupied; they are contrasted with a corresponding occupied molecular orbital and subsequently calculated. However in general it can be seen that the LUMOs are strongly delocalised across the entire molecules and it is relatively difficult in a static picture to determine the origin of contributions to the large MOs. The incidence of nodes appears relatively high, particularly so in the -OH containing cation, resulting in increased antibonding interactions and hence is higher in energy; all 3 LUMOs would be categorised as overall antibonding. In terms of symmetry, it is a similar picture to that discussed with the molecules' HOMOs; the LUMO of [N(CH3)3(CH2CN)]+ is highly symmetric due to the high levels of symmetry present in the molecule, the LUMOs of the other two cations are less symmetric as the molecules themselves are less symmetic than N(CH3)3(CH2CN)]+ due to the introduction of functional groups.
| Molecule | HOMO Energy | LUMO Energy | HOMO-LUMO Gap |
|---|---|---|---|
| [N(CH3)4]+ |
-0.57934 au / -1521.06 kJmol-1 |
-0.13302 au / -349.24 kJmol-1 |
0.44632 au / 1171.81 kJmol-1 |
| [N(CH3)3(CH2CN)]+ |
-0.50047 au / -1313.98 kJmol-1 |
-0.18183 au / -477.39 kJmol-1 |
0.31864 au / 836.59 kJmol-1 |
| [N(CH3)3(CH2OH)]+ |
-0.48763 au / -1280.27 kJmol-1 |
-0.12459 au / -327.11 kJmol-1 |
0.36304 au / 953.16 kJmol-1 |
The energy of the HOMOs increases from left to right across the table by approximately 241 kJmol-1 with [N(CH3)4]+ having the lowest energy HOMO and [N(CH3)3(CH2OH)]+ having the highest energy HOMO. A different trend is shown in the LUMO energies whereby [N(CH3)3(CH2CN)]+ has the lowest energy LUMO and [N(CH3)3(CH2OH)]+ having the highest energy LUMO, across a range of approximately 150 kJmol-1. The difference in energies between the sets of HOMOs and LUMOs can be related to the nature and strength of interactions in the MO. For instance, the highest energy HOMO and LUMO (|[N(CH3)3(CH2OH)]+ in both cases) have both the highest number of nodes and high incidence of strongly antibonding, through space, interactions, resulting in a high energy HOMO and LUMO. Conversely, the incidence of nodes and antibonding interactions appears lower in the lowest energy HOMO ([N(CH3)4]+) and LUMO ([N(CH3)3(CH2CN)]+).
As a result of the changing HOMO and LUMO energies across the molecules, the HOMO-LUMO gaps have also changed. The trend shown for the HOMO and LUMO increases is no reproduced in the HOMO-LUMO gap changes. The smallest gap belongs to [N(CH3)3(CH2CN)]+, followed by [N(CH3)3(CH2OH)]+ and then [N(CH3)4]+ with the largest gap. It is not within the scope of this investigation to dicuss specific reasons for the changing magnitude of the the HOMO-LUMO gaps. However it does enable a qualitative discussion on the chemical impact of these magnitude changes.
It would be expected that molecules that have low energy LUMOs would be better electrophiles (Lewis acids) than molecules with higher energy LUMOs. This is because their ability to accept electrons into the LUMO is greater, as donating electrons into a lower energy level is a more stabilising reaction than donating into a higher energy level. Using this hypothesis and the data listed above, [N(CH3)3(CH2CN)+ would be expected to be the strongest Lewis acid and [N(CH3)3(CH2OH)+. Conversely, molecules with a high energy HOMOs would be better nucleophiles (Lewis bases) than molecules with a lower energy HOMO. This is because their ability to donate electrons is greater as they would not be held as tightly as those held in molecules with a lower HOMO energy. Thus, it would be expected that [N(CH3)3(CH2OH)]+ would be the strongest Lewis base and [N(CH3)4]+ the worst. These varying abilities enable the cations to make excellent ionic liquids. Additionally, the variance in HOMO-LUMO energy gap would also result in different photochemical properties (strongly associated with the size of the HOMO-LUMO (or band) gap). However, it is not within the remit of this discussion to further investigate these.
References
- ↑ Kuchitsu, K. (1998). Structure of Free Polyatomic Molecules - Basic Data (1st ed.). Berlin: Springer. doi:10.1007/978-3-642-45748-7
- ↑ Santiso-Quiñones, G., & Krossing, I. (2008). Reference Values for the B-X Bond Lengths of BI3 and BBr3. Zeitschrift Für Anorganische Und Allgemeine Chemie, 634(4), 704–707. doi:10.1002/zaac.200700510
- ↑ 3.0 3.1 3.2 3.3 3.4 Haynes, W. M., Lide, D. R. & Bruno, T. J. (2012). CRC Handbook of Chemistry and Physics (93rd ed.). Boca Raton: CRC Press
- ↑ DeKock, R. L. (1989). Chemical Structure and Bonding (1st ed.). California: University Science Books
- ↑ Verma, N. K., Dr. N . K. Verma, S. K. K. D. B. K., Khanna, S. K., & Kapila, B. (2010). Comprehensive Chemistry XI. Laxmi Publications Pvt Limited.
- ↑ 6.0 6.1 6.2 6.3 6.4 6.5 6.6 Atkins, P. W., & De Paula, J. (2009). Physical Chemistry (9th ed.). Oxford: Oxford University Press.
- ↑ 7.0 7.1 Mitoraj, M. (2011). Bonding in Ammonia Borane: An Analysis Based on the Natural Orbitals for Chemical Valence and the Extended Transition State Method (ETS-NOCV). The Journal of Physical Chemistry A, 115(51), 14708–14716. doi:10.1021/jp209712s
- ↑ Ok, K. M., Doran, M. B., & O’Hare, D. (2006). [N(CH3)4][(UO2)2F5]: A new organically templated open-framework uranium oxide fluoride (MUF-2). Journal of Materials Chemistry, 16(33), 3366. doi:10.1039/b609525a
- ↑ Madariaga, G., Alberdi, M. M., & Zúñiga, F. J. (1990). Structure of [P(CH3)4]2CuBr4 at 293 K. Acta Crystallographica Section C Crystal Structure Communications, 46(12), 2363–2366. doi:10.1107/S010827019000470X


