Rep:Mod:pitsnake
This computational experiment aims to investigate thermodynamic properties of the MgO crystal lattice, described as either a rhombohedron primitive unit cell with a 60˚ internal angle, or a conventional face-centred cubic cell with a 90˚ internal angle. Different approaches to computational simulation are employed, and a summary of the thermodynamic properties and a comparison across the two different approaches are provided.
Initial Calculation on MgO
An initial calculation on a single unit cell of MgO at absolute zero yields a Helmholtz free energy of –41.07531835 eV, or the equivalent of -3957.689074 kJ mol-1. The lattice parameter, a = b = c, of a primitive rhombohedric cell is 2.9783 Å, or the equivalent of 2.5792 Å in a conventional face-centred cubic cell (NaCl structure). The lattice parameter is in good agreeement with the LCAO-HF calculation (linear combination of atomic orbitals at the Hatree-Fock level) found in literature (2.573 Å [1]), suggesting that the GULP shell-model simulation is in good agreement with quantum mechanical calculations.
The Phonon Dispersion Relation In MgO
Phonons
A phonon is an excitation of a group of atoms in an elastic arrangement in a crystal lattice. While seen as a quasiparticle, a phonon represents an excited state in a quantised quantum mechanical mode of vibration. Understanding the behavioral changes of phonons at different temperatures is crucial in the study of thermal expansion, thermal conductivity and electrical conductivity of crystals.
The displacement of one atom in a crystal lattice leads to a propagating wave of the lattice, where the amplitude of the wave is the displacement of the atom from its equilibrium position, and the wavelength (λ) is the distance between consecutive points of the same amplitude (phase). The wavenumber is more useful in lattice representations, with .
Results and Analysis
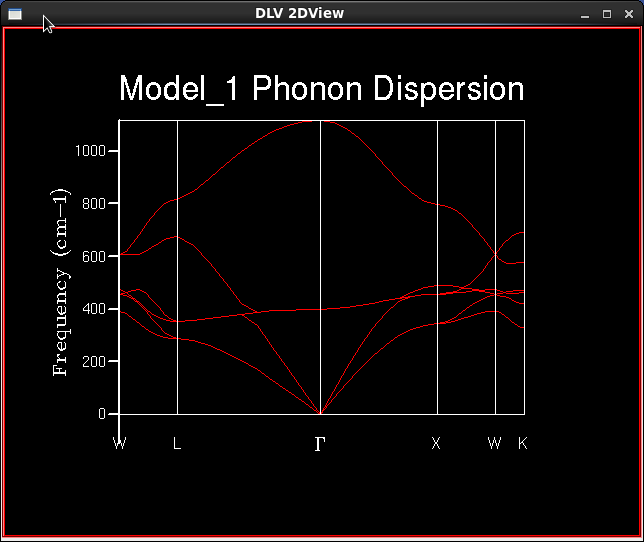
Using GULP, phonon frequencies were calculated at various k-points along the paths Γ→X→W→K and Γ→L→W within the first Brillouin zone. A total of 50 k-points were sampled to give Figure 1.
The shape of the computed phonon dispersion relation is in good agreement with experimental dispersion relations [2].
By visualising the vibrational modes with the DLVisualize Animate feature, it is understood that the lowest two branches at Γ are overlapping acoustic transverse vibrations, and the second-lowest branch is the longitudinal vibration. Close to the Γ-symmetry k-point, the energy of acoustic phonons is approximately proportional to the wavenumber, . The acoustic transverse vibrations in two perpendicular planes overlap to a greater degree in this calculation than that in experimental literature. Degree-of-freedom arguments suggest that 3N-3 optical vibrations exist above the acoustic modes (N = number of atoms in a unit cell), which holds true since there are 3 optical branches in the phonon dispersion relation graph.
Phonon Density-of-States Functions In MgO
Phonon Density of States
The Phonon density of states function outlines the number of vibrational states available at each frequency. For a unisolated system, the density distribution of states is continuous.
Analytically the density of states can be obtained by integrating the phonon energy dispersion at an infinitesimally small increment of k. When the branch is flat at the point of interest, there is a high density of vibrational state for the particular k-point, or for the particular energy since energy is a function of the wavenumber k.
When full analytical integration is not available, a numerical integration can be performed by GULP by calculating the vibrational modes at each k-point and summing all densities multiplied by the weight of the k-point. The weighting factor, for a regular grid, is the inverse of the number of grid points. As the number of points approach infinity, the summation resembles the true value.
In practical calculations, a finite number of k-points is sampled over the first Brillouin zone. A Monkhorst-Pack mesh is an unbiased method of choosing a set of k-points uniformly spread over the first Brillouin zone. The uniform mesh is suitable for a regular grid such as MgO, where there are points of special interest are spread evenly. The number of points is defined by shrinking factors in three dimensions and the larger the shrinking factors, the finer and more accurate the DOS function.
Results
The numbers of k points given in the table do not account for intrinsic symmetry of phonon modes in the Brillouin zone. Hence, the actual number of sampling points performed by GULP may be lower than those given in the table.
Analysis
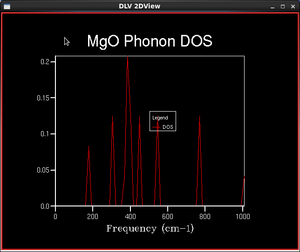
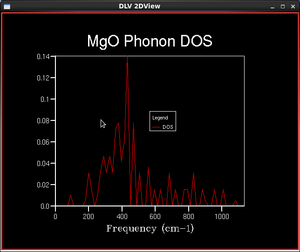
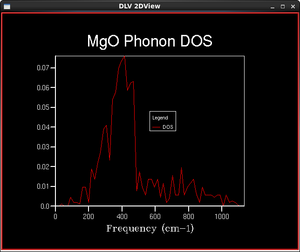
As the shrinking factor increases, the DOS functions become more and more continuous. This is natural since the vibrational states should become more continuous for increasing size of the system. The shape of the DOS function finer than the 16x16x16 system agrees with calculations found in literature and experimental data[3]. Systems with smaller grids display abrupt changes at peaks and troughs, while experimental studies suggest a smooth transition of densities between different energies. As the grid size increases, the DOS becomes closer to experimental values as the function is smoother and representative of more k-points, not just the ones sampled. Maximum occurs around the 400 cm-1 frequency as expected because the phonon dispersion curves are the most 'crowded' at that particular frequency.
We can essentially observe the process of summation of the numerical integration as we increase the shrinking factor. For the 1x1x1 grid, only the L symmetry point is sampled, and the four peaks correspond to the frequencies at which the phonon dispersion branches intersect the L symmetry label. The two high-frequency peaks at 688 and 805 cm-1 correspond to the two points of intersection with the optical branches, and the lower-frequency peaks correspond to that with the acoustic branches. At L, the acoustic branches are flatter, giving a larger number of vibrational energies. As the number of sampling points increase, more and more points of intersection and frequencies are added to the DOS curve, giving a much smoother and more continuous curve.
The illustration below outlines the relationship between the phonon dispersion curve and the density-of-states curve:
Applicability To Other Crystal Lattices
MgO is a II-VI ionic crystal with a face-centred cubic cell structure (a=b=c=4.211 Å). To ensure that we calculate the same number of vibrational states, the reciprocal space separation between sampled k-points must be similar to obtain the same resolution. Theoretically, the same grid size can be applied to lattices of similar cell parameters and the same ionic charges, such as CaO (a=b=c= 4.8Å) and such computational exercise has been carried out in literature with success [4]. For lattices with different ions, however, the grid size must be changed depending on the nature of the ion. In the MgO lattice, the high polarisability of the oxide anion is suitable for the computational model. While, for example in metallic lithium (a=b=c=3.521 Å), the more delocalised nature of the valence electrons imply large energy variation in a given vibrational state, and a larger grid size may be necessary to obtain the same resolution, in addition to the cell parameter effects. The smaller size of the cell parameter also requires a larger grid in the reciprocal space. However, computations have been carried out with limited success [5]. For crystals with a larger, a smaller grid size is required to sample all points of interest within the symmetry of the unit cell. Computational calculations for such complex lattices, such as a zeolite, will be very costly.
The Helmholtz Free Energy of MgO
Quasi-Harmonic Approximation
Even at low vibrational states, the energy of a vibrational state deviates from perfect harmonic behaviour. To introduce anharmonicity to the simulation, the quasi-harmonic approximation computes the positions and the bond lengths of individual atoms for vibrations corresponding to different wavenumbers. As the lattice compresses or expands, the zero-point energy (electrostatic) and the force constants vary. A new lattice is then computed at various k-points using the new force constant to minimise the overall free energy. The force constant calculation requires an accurate phonon frequency, hence a thorough sampling of k-points is required.
, where A is the Helmholtz energy, U is the internal energy, kT is the Boltzmann constant, h-bar is the reduced Plank constant, ω is the vibrational frequency, T is the temperature.
Since the optimisation of the new force constant are independent of other vibrations, the quasi-harmonic approximation breaks down at the high-temperature range because of significant phonon–phonon interactions. Another shortcoming of the quasi-harmonic approximation, due to its intrinsic harmonic nature even with different force constants, is the failure to model dissociation of the bonds at high internuclear distances and strong repulsions at high compressions, further invalidating this approach for high-temperature conditions.
Results and Analysis
| Shrinking
Factor |
Number of
Sampled k Points |
Zero-Point Energy
(eV) |
Helmholtz Free Energy
(eV) |
Heat Capacity At Constant Volume
(eV/K) |
|---|---|---|---|---|
| 1x1x1 | 1 | 0.172063 | -40.930301 | 0.000350 |
| 2x2x2 | 4 | 0.174209 | -40.926609 | 0.000347 |
| 4x4x4 | 32 | 0.174339 | -40.926450 | 0.000347 |
| 8x8x8 | 256 | 0.174340 | -40.926478 | 0.000347 |
| 16x16x16 | 2048 | 0.174340 | -40.926482 | 0.000347 |
| 32x32x32 | 16,384 | 0.174340 | -40.926484 | 0.000347 |
Overall the Helmholtz free energy is more positive as the shrinking factor is increased, which is also the trend of the zero-point energy. However a noticeable maxima occurs at the 2x2x2 system, where the energy peaks before dropping off to convergence. Because the zero-point energy trend lacks this feature, it is speculated that the peak in Helmholtz free energy is due to entropic contributions. As spatial sampling becomes finer, the TS term in Helmholtz free energy becomes increasingly negative (and more accurate). This is intuitive since a small shrinking factor does not account for the many modes of vibrations that contribute to overall entropy.
The 2x2x2 grid is suitable for calculations accurate to 0.5 meV per cell, which implies that it is also suitable for calculations accurate to 1 meV. For 0.1 meV accurate calculations, a 4x4x4 grid size is required.
Applicability To Other Crystal Lattices
Because zero-point internal energy calculations will be identical regardless of the sampling, we should focus on the entropic term when discussing the accuracy in calculating the free energy for different crystal lattices. The entropic term is dependent on accurate energy calculations when occupying the vibrational states. The accuracy of the entropic term, and therefore of the whole Helmholtz free energy is reliant on the accuracy of the density of states. The arguments written in the previous section can be applied here. In short, the same grid size can be applied to a CaO calculation, a larger grid size must be used for metallic lithium, and a smaller grid size is required for zeolites to obtain the same resolution.
Thermal Expansion of MgO: Quasi-Harmonic Approximation
The coefficient of thermal expansion is a description of the change of an object's size with a change in temperature. More specifically, the expansion is described as a fractional change in size per increment of temperature. In this computational experiment, we are considered with the volume expansion. For a isotropic material such as the MgO crystal lattice, the thermal expansion coefficient of the object in 3D is three times the linear thermal expansion coefficient in 1D. Mathematically the volume thermal expansion coefficient is defined as , where αV is the volume thermal expansion coefficient, V is the total volume of the system, T is the temperature of the system.
The physical nature of a crystal expanding upon heat is the promotion of electrons onto higher-energy vibrational states with more anti-bonding character. The anti-bonding nature of the state increases the bond length, leading to the expansion of the whole lattice. For a lattice system with large energy variation between Γ and K, a large amount of thermal energy is required for the same change in volume than a system with vibrational states that are closely packed and similar in energy. If a lattice has large separations between its vibrational states then nature of the bonding in the lattice can be understood as structurally rigid, which fits with our chemical intuition that molecules with strong and rigid bonds are less prone to thermal expansion.
Computational Methodology
At each given temperature, an optimal configuration of the system is simulated by the method described in the previous section. The Helmholtz free energy is the system is minimised to a pre-set tolerance with respect to the cell volume. According to the variational principle, thermodynamic properties of a system is closest to the true value when the derivative of cell parameters with respect to temperature is zero.
Results and Analysis
The 8x8x8 lattice grid was used for thermal optimisations for free energy values that are accurate to 0.01 meV.
| Temperature
(K) |
Helmholtz Free Energy
(eV) |
Lattice Constant
(a=b=c, Angstroms) |
Angle
(α=β=γ, Degrees) |
Cell Parameter
Derivatives |
|---|---|---|---|---|
| 0 | -40.901906 | 2.986565 | 59.999934 | 0 |
| 100 | -40.902418 | 2.986564 | 59.999937 | 0 |
| 200 | -40.909374 | 2.987613 | 59.999639 | 0 |
| 300 | -40.928119 | 2.989403 | 59.999461 | -0.000002 |
| 400 | -40.958587 | 2.989403 | 59.992790 | 0 |
| 500 | -40.999427 | 2.994156 | 59.999094 | 0 |
| 600 | -41.049305 | 2.996846 | 59.998906 | 0 |
| 700 | -41.049305 | 2.996846 | 59.998906 | 0 |
| 800 | -41.107108 | 2.999674 | 59.998715 | 0 |
| 900 | -41.171879 | 3.002623 | 59.998520 | 0 |
| 1000 | -41.243004 | 3.005674 | 59.998323 | 0 |
| 1200 | -41.488740 | 3.015394 | 59.997763 | 0 |
| 1400 | -41.675515 | 3.022433 | 59.997451 | 0.000001 |
| 1600 | -41.877981 | 3.029988 | 59.996775 | 0 |
| 1800 | -42.094435 | 3.038336 | 59.995015 | 0.000001 |
| 2000 | -42.323668 | 3.046923 | 59.994762 | -0.000002 |
| 2200 | -42.564747 | 3.056841 | 59.994783 | 0 |
| 2400 | -42.817003 | 3.068085 | 59.992390 | -0.00002 |
| 2600 | -43.079967 | 3.081449 | 59.993314 | 0.000002 |
| 2752 | -43.28700906 | 3.094344 | 59.994204 | 0.000002 |
| 2852 | -43.42654086 | 3.105499 | 59.994105 | -0.000001 |
| 2952 | -43.56951767 | 3.124113 | 59.994437 | -0.000002 |
The lattice constant increases linearly only in the range 300 - 1000 K.
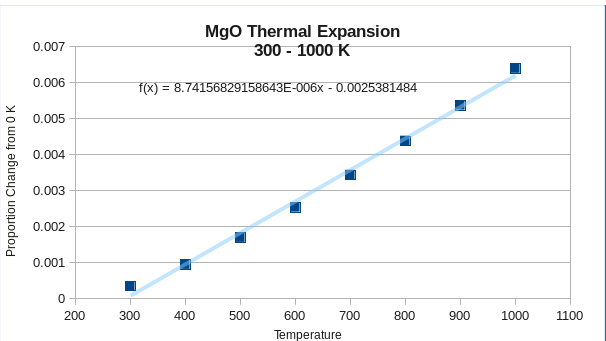
The thermal expansion constant of MgO in this temperature range, assuming temperature independence, is equal to with .

If the whole temperature range 0K to 2952K was to be included, the thermal expansion of MgO is non-linear with respect to temperature. A polynomial fit to the fourth order has been determined with such that , where is the fractional change in the cell parameter relative to the cell parameter at T = 0 and is the temperature in Kelvins. As the coefficient of thermal expansion is defined as the partial derivative of the fractional change with respect to temperature, the coefficient of thermal expansion can be expressed as .
Thermal Expansion of MgO: Molecular Dynamics
Computational Methodology
The molecular dynamics technique studies the trajectories of individual atoms by numerically solving Newton's equations of motion for an N-body system of interacting particles, where the forces of the particles are calculated by molecular mechanical force fields such as the Lennard-Jones or the Buckingham potential. It is an ab initio method of simulation applied to a large number of unit cells in order to obtain an accurate picture of the complex system in which analytical solutions are either inhibitively time-consuming or simply unavailable.
Thermodynamic properties of the isothermal-isobaric (NPT) ensemble are time-averaged over the entire space. For ergodic systems, the time averages should be identical to spatial averages provided by the quasi-harmonic approach. Due to the computational expense of this method, the system must be designed to account for available computational power by tailoring the simulation to a suitable timestep, time duration and scale. The scale of such a system must be large enough to eliminate periodic boundary condition artifacts, which in this case is suitable at the femtoseconds timestep with a lattice containing 32 MgO unit cells. This number of cells in the real space is equivalent to the 8x8x8 shrinking factor in the Helmholtz free energy simulation, as both methods give a total of 64 vibrational bands. This shrinking factor was found to give an accurate Helmholtz free energy correct to 0.1 meV.
Results and Analysis
| Temperature
(K) |
Averaged Final Volume
(Cubic Angstroms) |
Volume Per Unit Cell
(Cubic Angstroms) |
|---|---|---|
| 300 | 602.917248 | 18.8411640 |
| 400 | 604.188880 | 18.8809025 |
| 500 | 605.968126 | 18.9365039 |
| 600 | 608.794097 | 19.0248155 |
| 700 | 608.745756 | 19.0233049 |
| 800 | 611.617711 | 19.1130535 |
| 900 | 611.936388 | 19.1230121 |
| 1000 | 615.044932 | 19.2347085 |
| 1100 | 619.298570 | 19.3530803 |
| 1200 | 620.020014 | 19.3756254 |
| 1300 | 621.486358 | 19.4214487 |
| 1400 | 622.667288 | 19.4583528 |
| 1600 | 626.172143 | 19.5678795 |
| 1800 | 630.981409 | 19.7181690 |
| 2000 | 632.410325 | 19.7628227 |
| 2400 | 642.622061 | 20.0819394 |
| 2600 | 648.508557 | 20.2658924 |
| 2800 | 655.021305 | 20.6318792 |
| 3000 | 660.220134 | 20.6318792 |
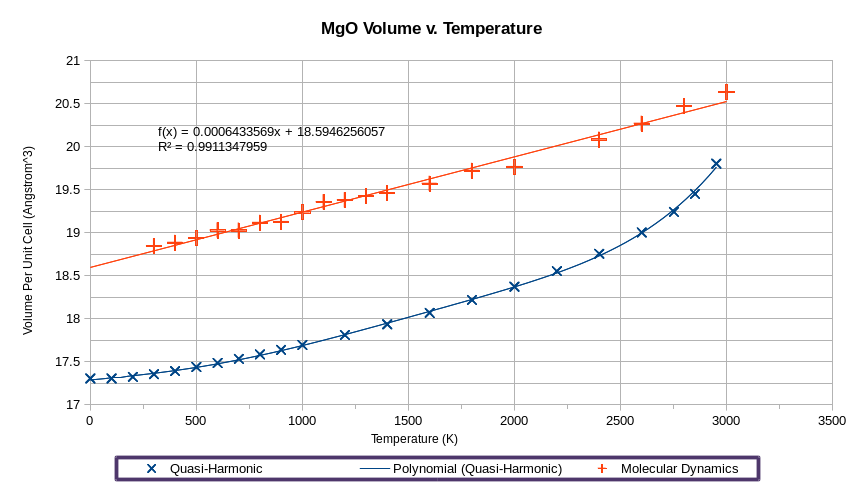
The molecular dynamics data suggest a linear relationship between unit cell volume and temperature, and the thermal expansion coefficient, assuming its temperature independence is
.
Due to time constraints, I was unable to perform a molecular dynamics simulation at 0K. Extrapolating from obtained data, the volume per unit cell at absolute zero is 18.594625 Å3, whereas with quasi-harmonic approximation the 0 K volume is 17.302424 Å3. It is evident that the quasi-harmonic approximation, with its inaccurate parabolic potential curve and boundary condition artifacts, significantly underestimate the magnitude of repulsive forces in a crystal lattice, giving rise to largely inaccurate high-temperature properties.
Conclusion
The experimental thermal coefficient of MgO varies from at 300 K to at 2000 K, steadily increasing with increasing temperature.[6][7]
Both molecular dynamics and quasi-harmonic simulations display a linear thermal expansion in the temperature range 0 K – 1200 K. The quasi-harmonic method is in better agreement with experimental data in the linear range, after which the thermal expansion diverges. In the high-temperature range, thermal expansion no longer obeys linearity according to quasi-harmonic simulations as molecules are no longer bound to harmonic force fields due to increased energies. The quasi-harmonic calculation does not simulate bond dissociation as a result of large energies in the high-temperature range, and fails to account for anharmonicity experienced at high bond distances.
On the other hand, molecular dynamics indicates linearity over a much larger range of temperature. At lower temperatures where periodic condition artifacts are more prominent, molecular dynamics simulations contain some inaccuracies within its somewhat simplistic classical force models. At high temperatures, molecular dyanmics is more reliable in calculating phonon interactions, and therefore more suited to high-temperature simulations.
For both methods, the calculations break down at and near the melting point of MgO. In an NPT system, the thermal expansion coefficient and the constant-pressure heat capacity are both proportional to the rate of change in vibrational energy with respect to temperature. We expect the heat capacity to instantaneously become infinite at the transition temperature. However it is not the case as both models predict constantly rising thermal expansion coefficients beyond the transition temperature. It is suspected that the long-range atomic forces are not well employed in both methods of simulation, and further studies with more descriptive potential fields are needed to investigate the thermal behavior of the MgO lattice.
References
- ↑ II-VI and I-VII Compounds; Semimagnetic Compounds, Springer Berlin Heidelberg, Berlin, 1999, 41B, pp. 1-6, doi: 10.1007/10681719_206
- ↑ G. Peckham, Proc. Phys. Soc. 1967, 90, 657, doi: 10.1088/0370-1328/90/3/312
- ↑ A. R. Oganov, M. J. Gillan, G. D. Price, J. Chem. Phys. 2003, 118 (22), pp. 10174, doi: 10.1063/1.1570394
- ↑ B. B. Karki, R.M. Wentzcovitch, Phys. Rev. B, 2003, 68 (22), pp. 224304, doi: 10.1103/PhysRevB.68.224304
- ↑ S. Pal, Phys. Rev. B, 1970, 2 (12), pp. 4741, doi: 10.1103/PhysRevB.2.4741
- ↑ C. J. Engberg, E. H. Zehms, J. Am. Ceram. Soc., 1959, 42 (6), pp. 300, doi: 10.1111/j.1151-2916.1959.tb12958.x
- ↑ O.L. Anderson, K. Zou, J. Phys. Chem. Ref. Data, 1990, 19 (1), pp. 70


