Rep:Mod:physical Gabby
Introduction
The aim of the first two sections of this lab is to investigate the reactants and products involved in the sigmatropic pericycli reaction shown below, also known as the cope rearrangement. The transtion states of the reactant will be studied indepth.Any energies quoted without units are in Hartrees (a.u) and lengths are in Angstroms.
Optimising the reactants and products
Using GaussView the antiperiplanar conformer of 1,5 hexadiene was drawn and then the structure was cleaned.
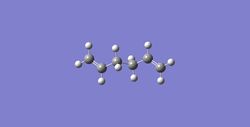
This structure was then optimised using the HF/3-21G method and basis set. The %mem was changed to 250MB and the job was submitted. Once the job was run using Gaussian, the checkpoint file was opened and the results summary was obtained. The energy was noted to be -231.6925328. Finally this structure was symmetrised and its point group was found to be Ci .
The structure obtained was then compared to those in the table labelled Appendix 1 on the Mod:phys3 wiki page. The structure that was draw was found to be anti 2, as the energy and point group from this optimised structure matched that in the table.
Next another structure of 1,5 hexadiene was drawn out, but this time as the gauche conformer. This was drawn by taking the antiperiplanar molecule drawn in the first step, using the un-optimised structure, and changing the dihedral angle from 180 to 120. This made the process faster. Again it was optimised in the exact same way as above. Once the optimisation had run the energy and point group were noted. These were -231.69166701 and C2 respectively. Again the appendix table was consulted and the structure was found to be gauche 2.

The energy difference between these two conformers was found to be 2.279kJ/mol with the anti conformation at a lower energy (a larger negative energy). However this is not what would be expected. The gauche conformer should be the lowest in energy and this is due to the gauche effect. The gauche effect characterises a rotamer where the gauche version is actually more stable than the anti one.
The reason for this stability is because of the σC-H/π* on the C=C which causes the central carbon chain with gauche conformation to push the C=C groups into a certain conformation which results in a stabilising interaction as the groups are eclipsed. C=C are in an eclipsed conformation to each other and an A1,3, interaction is seen. It can be predicted that the conformer with the largest A1,3 interaction would be the most stable, ie the conformer with the largest σ/π* overlap.
From the table it can be seen that the gauche 1 conformation is the most stable and by looking at the geometry of the bonds it is clear that these would have the largest A1,3 interaction.
The anti 2 structure was needed for the next section, but as this was the original structure that was obtained it was unnecessary to re draw the structure. It was then re-optimised using a different method. This time it was re-optimised at the B3LYP/6-31G* level. He energy of the structure at this optimisation at a higher level of theory is -234.61170277, which is actually now higer in energy and shows that the anti structure is less stable than first thought.
The dihedral angle was checked and both structures were still at 180 after the two different optimisation methods. However the bond lengths were different. These are displayed in the table below.
It can be seen that the structure that has been optimised at a higher level of theory has a hlonger C=C bond but the sinle bonds are shorter. These are much closer to the literature values for the bond length of a C=C bond and of a C-C bond, so shows that the geometry of the structure is now much more accurate.
| Type of bond | HF/3-21G bond length | B3LYP/6-31G* bond length | Literature value |
|---|---|---|---|
| C=C | 1.316 | 1.336 | 1.33 |
| =C-C | 1.509 | 1.504 | |
| -C-C | 1.553 | 1.548 | 1.54 |
Next a frequency calculation was run, and all of the frequencies obtained were positive, so it is clear that the structure is at a minimum. The IR spectrum is shown below and all of the peaks that would be expected can be seen at 3080-3020cm-1 for C-H, 1460cm-1 for C-C and 1680-1640cm-1 for C=C.
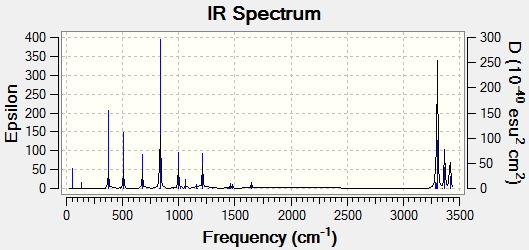
The output file was opened and the thermal chemical data for this structure was obtained. It is displayed in the table below.
| Type | Energy (Hartrees) |
|---|---|
| Sum of electronic and thermal energy | -234.462 |
| Sum of electronic and zero point energy | -234.469 |
| Sum of electronic and thermal enthalpies | -234.461 |
| Sum of electronic and thermal free energies | -234.501 |
Optimising the Chair and Boat Transition States
An allyl fragment of CH2CHCH2 was drawn into GaussView, so that it looked like half of the structure drawn in the previous steps. It was then optimised using the HF/3-21G level of theory.
Once this was done the structure was cut and pasted into a new molecule window, and manipulate until they looked like the chair transition state. The distance between the two allyl fragments were to be as close to 2.2Å as possible. The distances that were achieved were 1.975Å and 2.017Å.
This transition state was then manually optimised in two different ways. First it was optimised using the Opt+Freq method and was optimised to T.S(bernary). The force constants were calculated once and opt=NoEigen was added to the additional keywords. The job was submitted and was run successfully. The IR vibrations were then looked at and there was a negative frequency at -818cm-1 as expected. The vibration was studied and it can be seen that it is indeed the one that corresponds to the cope rearrangement.

The reason that these negative frequencies are used to show that the structure is in the transition state is because the frequency is the second derivative of the energy. If:
ν=1/2 kx2
the derivative in respect to x is ν=kx
the second derivative is therefore ν=k
Therefore if the second derivative is at a negative value we are at a maximum and not at the minimum required for the product. This shown that we are in the transition state.
Also the energy can correspond to ν=1/2π(√k/m). If k is negative then the square of a negative number is a function of i and is therefore imaginary. This is why if there are no imaginary frequencies we know that we have reached the minimum, and an imaginary frequency shows that we are somewhere in the transition state.
Next the structure was optimised using the frozen coordinate’s method. However the bond distances were not set to 2.2Å as mentioned in the text. This was done so that this transition structure could be compared to the previous optimisation if needs be, so the bond distances were frozen at the values mentioned above. This frozen geometry was then optimised (the keyword Opt=NoEigen were already included) . To make sure of this the checkpoint file was opened and the bond distances checked. They were, as expected the same, 1.975Å and 2.017Å. What was unexpected is that the frequency changed for the imaginary vibration of the transition state. This time it was -804.86cm-1 The energy for this transition state optimisation was -231.61950439 a.u.
These fixed bond distances were then optimised using the normal guess hessian mode. This time “Bond” and “derivative” were chosen from the frozen coordinate menu. The checkpoint file was again opened and the bond distances were found to be 2.021Å and this time the frequency was back to -818cm-1 and the energy was -231.61932229 a.u.
Once the optimisation of the chair transition state was done, the boat conformer was set up to be optimised. The optimised Ci anti 2 product was opened and copied into a new molecule group window in Gauss view. The display was then set so that both molecule could be seen side by side in accordance to the instructions given on the wiki page. The atoms were then numbered using the labels option in the View dropdown menu. They were then orientated as shown below, and using the Edit menu and atom list, they atoms on the reactants and products menu were changed so that they corresponded to one another.
The first QST2 calculation was then set up, however with the starting geometry being what it was the boat transition structure would never be obtained. The diheadral angles of the reactant and product was set to 0° and the inside C-C-C was set to 100°. This was then run again using the QST2(TS) method. The optimised structure had an energy of -231.60280239 and a negative frequency at -839.82cm-1.
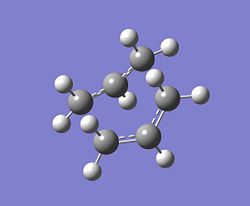
By looking at the energies, the product that the boat and chair transition structures corresponds to will attempt to be guessed at. However the energies of the transition state are much higher than any of the structures in the appendix. This shows that it is impossible to tell which structure a transition state corresponds to. At the transition state the energy is at a maximum. It has many different routes that it can take to get it to a minimum, and each one of these routes corresponds to a different product. It is impossible to tell, from this data what path the transition state will take. The Chair and Boat transition state are shown below.
 |
 |
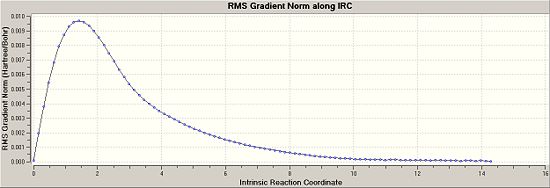
The IRC for the chair conformation was then set up. The instructions were followed on wiki but the link was always terminated as it said that Gaussian could not find the checkpoint file. So the checkpoint file was copied and the new gif was given the exact same name as the checkpoint, but this still did not work. There was something wrong with this method and so it was changed. Instead of using the checkpoint file, the log file of the originally optimised anti 2 structure was used to obtain the IRC. The “force constants” were selected as” calculate once”, the number of points were changed to 50 and in the additional keywords irc=stepwise=5 was added. The calculation ran this time and 51 points were achieved. The energy of this point was -231.68866909. It was clear to see from the gradient graph that the transition state had not yet reached a minimum, so three method were used to try and reach the product.
First, the lowest energy point from the IRC was optimised and a frequency calculation carried out. The energy obtained from this was -231.69166702 and this corresponds to the gauche 2 structure.
As the number of step from the first IRC was set at 50, yet 51 points were calculated and the structure still had not yet reached a minimum, the number of steps was increased to 100. 73 points were obtained from this calculation and the energy of the minimum point was -321.6901086. This was not as at low an energy as the previous opt+freq output, so a third method is to be used in an attempt to reach the minimum for the anti 2 transition structure.
The final IRC was run and the force constants were calculated at every step, but the number of steps were kept at 100. The energy that was obtained from the output was -231.69165796, which is very close to the energy of the gauche 2 structure. A final opt+freq was run on the lowest energy point, to see if that would allow the transition state to come down to a minimum.
Once this was done the energy was looked at and it could be seen that the energy had decreased down to -231.69166702, the same energy of the gauche 2 conformer. Also the vibrations were checked and there were no imaginary frequencies so it can be assumed that the transition state has reached a minimum. The grapgs from the Irc for the final and most expensive, yet accurate method are shown below:

|
|
It is impossible to guess at the final structure of the conformer just by looking at the transition state. This is a good method to discover the structure of the product as you are reducing the structure to a minimum. In the transition state there are many options for the molecule to take, which path it follows will decide on the final product. By using computational chemistry find the lowest energy minimum, the structure of the product can be found.
The boat and chair transition states were then optimised to a higher level of theory, using the B3LYP/6-31G* method. The structures that were optimised to a lower level of theory were used for this. The energies for these structures were different and they are shown in the table below, along with activation energy in kcal/mol.
The results obtained for the activation energy is very close to the literature value. The appendix quotes the experimentally obtained activation energy to reach the chair transition state to be 33.5±0.5kcal/mol, the value obtained using this method of computational chemistry was 33.7kcal/mol. This is very close to the expected value. The activation energy for the boat was 44.7±2kcal/mol and the value obtained from this calculation was 42.41kcal/mol which is again very close to the experimental value.
| Structure | Final Optimised Energy(a.u) | Literature Vaule | Activation Energy (kcal/mol) |
|---|---|---|---|
| Reactant | -234.61068498 | -234.611710 | - |
| Boat Transition State | -234.54309327 | -234.543093 | 42.41 |
| Chair Transition State | -234.55698293 | -234.556983 | 33.70 |
The thermal energies of the boat and chair transition states were taken from the log file and compared to that of anti 2 in the section above. The activation energies were caclulated from these values.
| Energy Type | Chair | Boat | anti 2 | activation energy of chair (kcal/mol) | activation energy of boat (kcal/mol) |
|---|---|---|---|---|---|
| Sum of electronic and zeropoint energy | -234.414932 | -234.402339 | -234.469212 | 34.06 | 45.94 |
| Sum of electronic and thermal energy | -234.409011 | -234.396005 | -234.461856 | 33.16 | 41.33 |
| Sum of electronic and thermal enthalpies | -234.408067 | -234.395061 | -234.460912 | 33.16 | 41.32 |
| Sum of electronic and thermal free energies | -234.443817 | -234.431748 | -234.500821 | 35.77 | 43.34 |
The energies obtained from the computational methods are very similar to the one in the appendix and so this shows that the correct transition structures, reactants and products were obtained. After comparing all of the energies of the two transition states and the reactants, it can be seen that as the activation energy to get to the chair transition state is much lower the reaction will proceed through the chair transition state.
Diels Alder Study
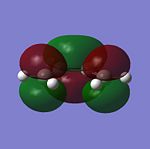
In the first part of this section cis-butadiene was drawn out in Gauss View, cleaned and the structure was optimised to a minimum. The HOMO and LUMO were obtained for this structure and the symmetry of them was determined. The HOMO and LUMO are shown below. The HOMO of cis-butadiene is antisymmetric and the LUMO is symmetric. This can be confirmed by looking at the lobes of the MO’s with respect to the plane.
 |
 |
Next we are to form the cis-butadiene and ethylene transition structure for the Diels Alder cycloaddition that will take place. The method that will be used to do these calculations will be the frozen coordinate one. The reason for this is that you have to optimise the structure several times; also an educated guess at the initial geometry can be done. This method also allows you to set bond lengths, so that you can compare the final geometries with the chosen ones.Also other methods are too expensive, so this is a good balance of time and theory.
 |
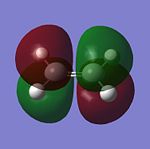 |
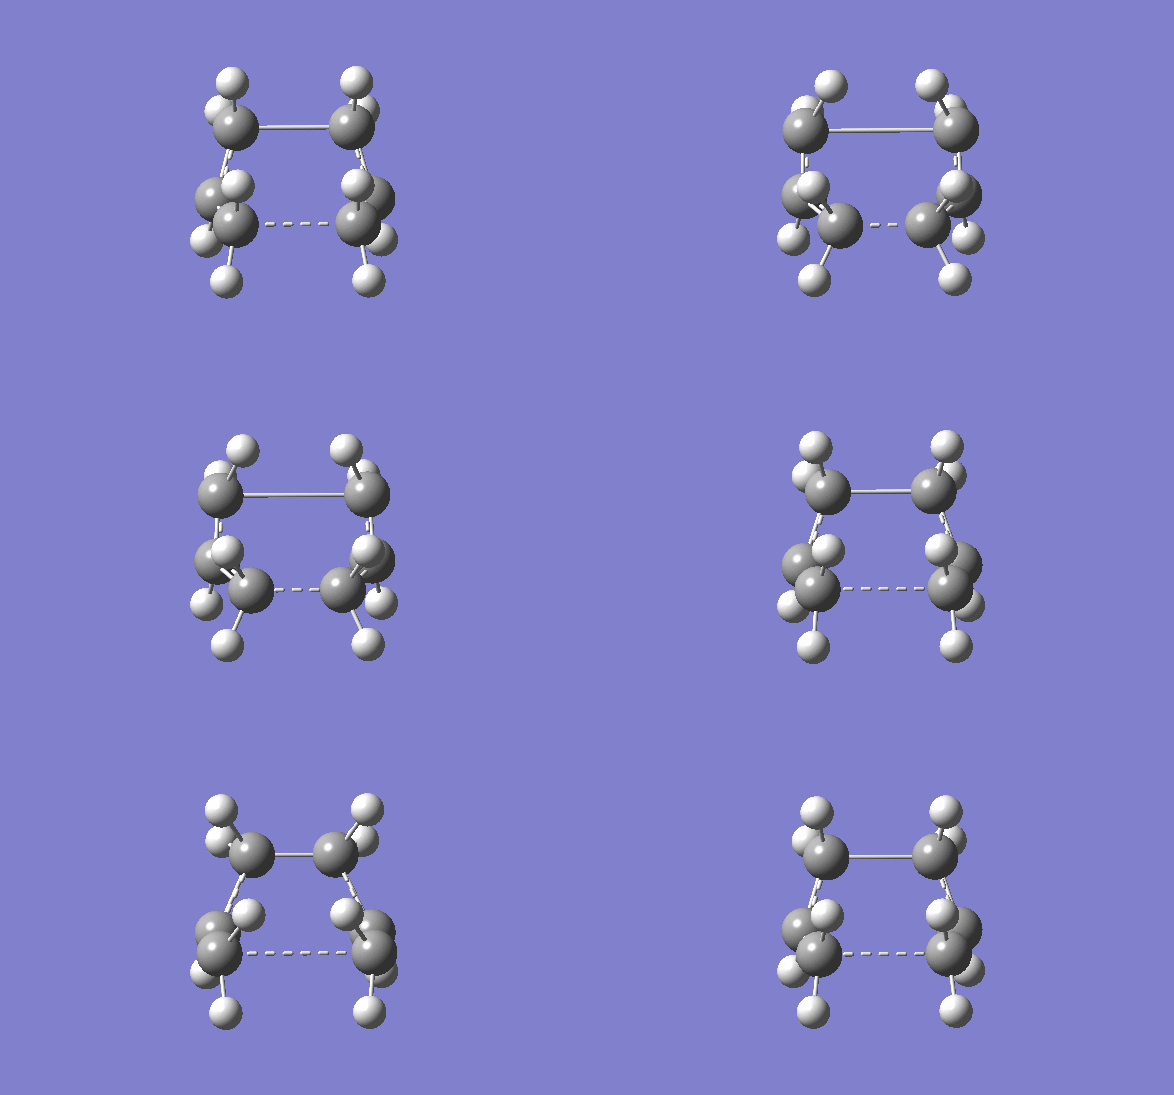
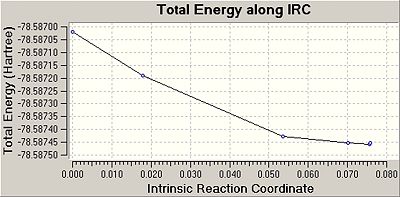
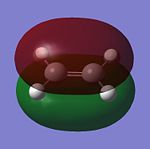
The HOMO of ethylene is symmetric and the LUMO is antisymmetric. Butadiene has been discussed above. To ensure that the lowest energy conformer was being used, an IRC was run of cis-butadiene and ethylene. It was found that the lowest energy conformers were used. The IRC graph of ethylene is shown below.The lowest energy conformer of ethylene was -78.5874a.u
These two products wll now take part in a cycloaddidtion reaction to form a diels alder[1] product via the mechanism outlined below:[2]
The method out lined in the previous section was followed to obtain this transition state. The optimisation method and basis set used was the semi –empirical AM1 method. The energy obtained for this structure, from the final optimisation and frequency calculation was 0.1165490 a.u. A negative frequency was noted for this structure at 956.95cm-1. This is to be expected as it is a transition structure and has not yet reached a minimum. This vibration is illustrated below:
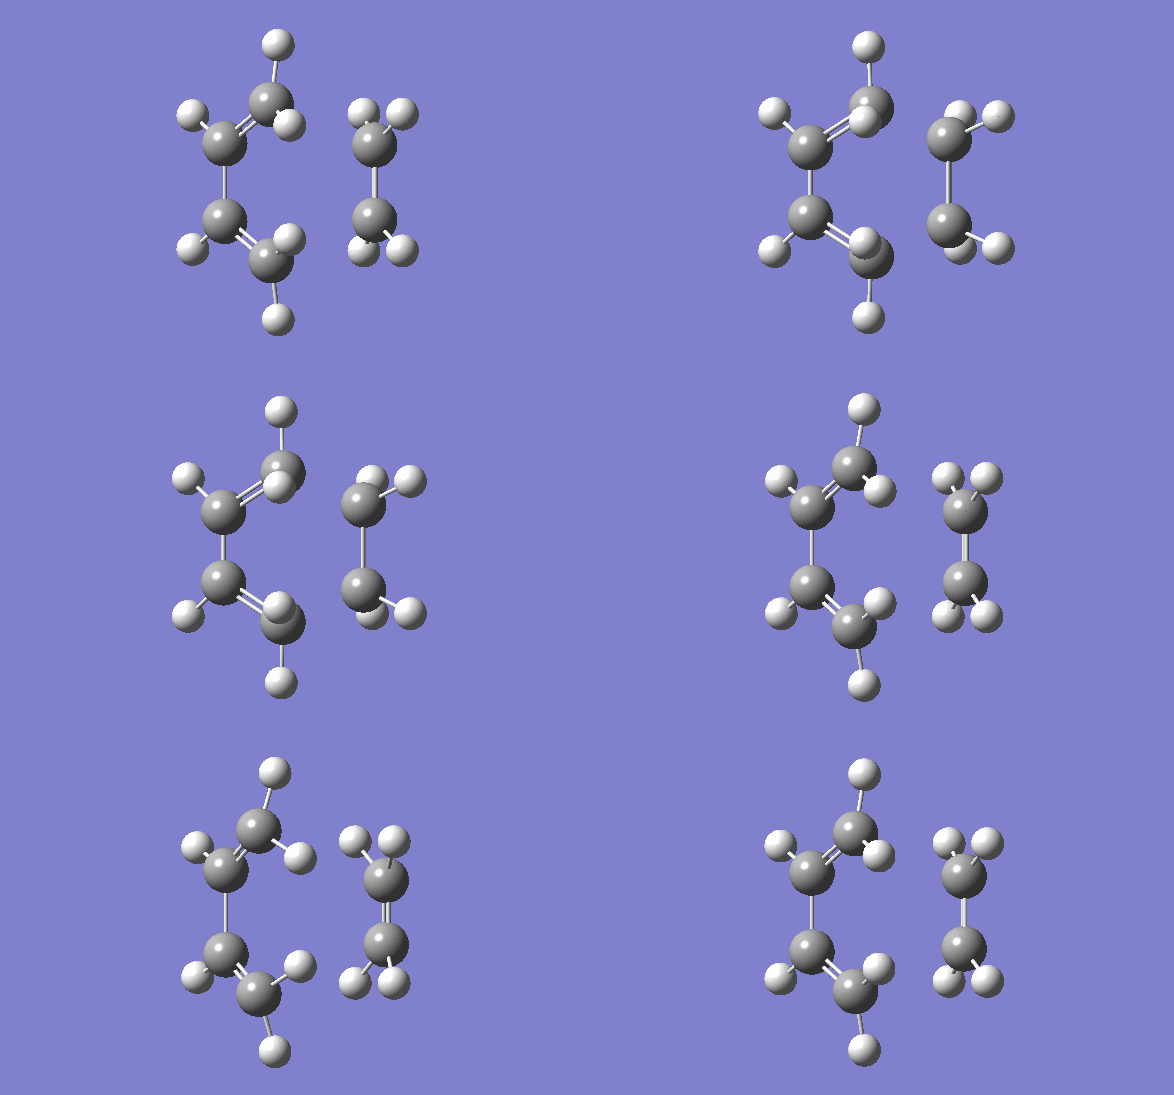
Typical sp3-sp3 carbon bond lengths are 154pm and sp2-sp2 are 150pm. A typical alkene double bond is 134pm. The geometry of the transition structure was found to be 1.38Å for the C=C, 1.39 for the C-C and the ethylene fragment had a bond length of 1.38Å. The van der waals radius of carbon is 1.7Å.[3] The bonds of the newly forming C-C bonds in the transition state are 2.119Å. The newly forming C-Cσ bond is less than double the van der waals radius of the carbon atom and is shorter than double an sp3 single bond. This shows that the bond is longer in the transition state than what is expected in the final product.
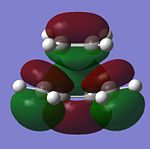
The MO,s of cis-butadiene and ethylene that form the HOMO in the transition state are the HOMO of cis-butadiene and the LUMO of the ethylene fragment. The reason that these two MO’s are used is because they conserve orbital symmetry. Both of these MO’s are antisymmetric so no symmetry is broken when they form the HOMO of the transition state. The conservation of orbital symmetry is respected and the reaction goes via the Woodward Hoffmann rule which states “a reaction is allowed only when all the reactant bonding electrons are transferred without a symmetry imposed barrier, into bonding orbitals of the product” The HOMO and LUMO of the diels alder transition state are shown below. The HOMO is antisymmetric and the LUMO is symmetric. This antisymmetric symmetry of the homo agrees with the above statement. Symmetry has been obtain when the two antisymmetric MO's of cis butadiene and ethylene formed the MO in the transition state.
 |
 |
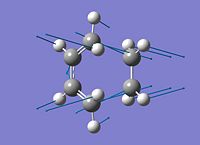
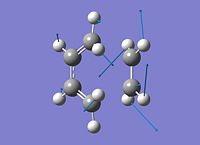
By looking at the negative vibration we can see that the bond is forming in a synchronous fashion. That is to mean that the changes, in this case the formation of the C-C bond have progressed to the same extent at the transition state. Comparing this to the lowest positive frequency, when this vibration was animated, it did not seem to correspond to any bond forming or bond breaking processes. This shows that the bond forming of the final product happens in the transition state. These two vibrations are illustrated below:
| Synchronous | Lowest positive frequency |
|---|---|
 |
|
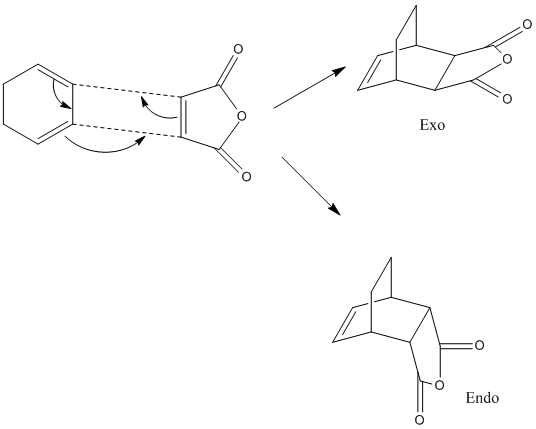
The endo and exo products of the diels alder cycloaddition between cyclohexadiene and maelic anhydride will be studied. This goes via a 4n+2 pericyclic reaction (if it goes via huckel or mobius depends on if the reaction goes via a thermal or light driven reaction)
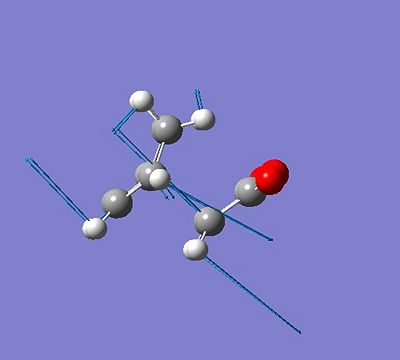
The endo and exo transition states of cyclohexadiene and maelic anhydride were formed. This was done in the same way as above, the two molecules wre drawn out and optimised, then cut and pasted into the same window. The coordinates were frozen at 2.2 using the frozen coordinates method, then optimised using the semi emperical AM1 method.
The endo transition state had an imaginary frequency of -806.57cm-1 and the exo transition state had an imaginary frequency at -812.19cm-1.
| Endo | Exo |
|---|---|
 |
|
The bond lengths of the endo product are shown below, the lengths on the picture are in angstrom. The bond length for the bond forming and breaking is 2.1620Å. The exo bond lengths are also shown below. For the exo product the bond length for the C-C bond forming is 2.170Å. The bonds are shown on the diagram below and they are all in angstroms.
 |
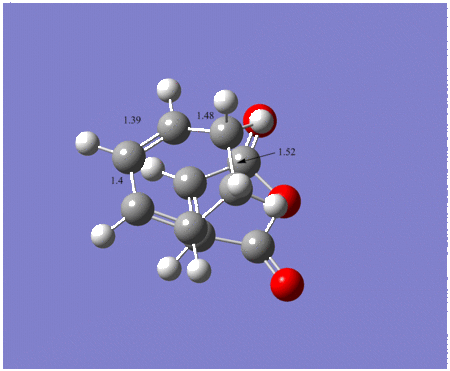 |
The bond lengths of the sp3 hybridised carbons are the same as the literature values optained, that are mentioned in the text above and also in the table in the first section. This shows how in the transition state the bonds are fully formed, and that the new bonds forming are longer than expected. To continue with this study the final product could be looked at and compared to the transition state, that way the bonding and geometry could be properly examined. Both endo and exo bond length are similar.
The energy of the exo transition state is -0.05041982 a.u and for the endo transition state the energy is -0.05150479a.u.This was then optimised to a higher level of theory, using the TS(berny) 631Gd method. The energies obtained were different. The endo product had an energy of -612.68339703a.u DOI:10042/to-2901 and the exo had an energy of -612.67931095 a.uDOI:10042/to-2900 . This gave a difference in energy of 2.564kcal/mol [4] with the endo transition being more stable again. This value agrees with the literture. The endo product is lower in energy and it therefore the more stable product. Normally with diels alder cycloadditions the endo product is the least stable, but still is the most favoured product. Thsis hows that in the transition state the endo is the most stable, and this could suggest at the reason for the endo product being the most favoured. The reason for this endo stability is due to the maximum accumulation of double bonds. The endo product shows plane to plane orientation of diene with dienophile.
The structural differences between the endo and the exo form is that in the endo product the R groups on the cyclohexadine and malelic anhydride are orientated on opposite sides of the newly formed ring. The exo form is more strained due to steric effects.This can be see in the diagram. The H's are facing the O atoms on the dienophile ring. This destabilises the exo form.In the endo product the electron withdrawing carbonyl group is situated nearer to the electrophillic C=C bond. This adds an extra stabilising factor to the endo product. In the endo product the C=O groups are situnated below the double bonds in the diene,an in the exo products they are as far away from the double bonds as they could be.
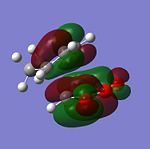
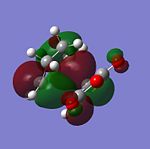
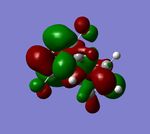
The MOs of the endo and exo product are shown below, along witht the endo Secondary Orbital Overlap MO. This is the 22 MO, ie the HOMO-12 . The energies of the HOMO and LUMO MO's are displayed below. The MO's appear to be antisymmetric.
| Endo HOMO | Endo LUMO | Exo HOMO | Endo LUMO | S.O.O Endo |
|---|---|---|---|---|
 |
 |
 |
 |

|
| -0.34506 | -0.03570 | -0.32399 | 0.02320 |
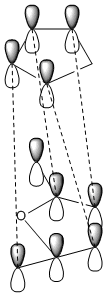
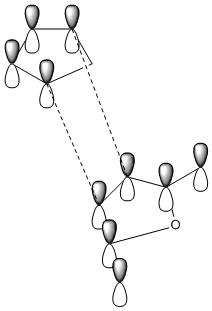
The secondary orbital overlap effect is only observed in the endo product. Looking at the nodes on the HOMO of the exo and endo product is not enough to try and see the effects of the secondary orbital overlap by looking at other HOMO of the endo and finding one that shows there is an overlap not only with the two orbitals that are forming the new bond, but also with the orbitals of the atoms behind this. Therefore there is a secondary orbital overlap and this can be seen in the MO. The secondary orbital overlap effect is crudely shown in the diagrams below. This daigram shows the overlap between cyclopentadiene and maleic anhydride.
|
|
The image on the left shows the S.O.O.E in the endo product. The secondary orbital overlap effect is defined as "the positive overlap of a nonactive frame in the frontier molecular orbitals of a pericyclic reaction" [4]. This effect is seen in endo rather than exo because in the exo form there is no orbital phasing at the primary and secondary centres, so no stabilisation is seen. However the orbital overlap effect fails to recognise that there may be other intermolecular interactions present in the transition state, so the endo product being preffered may have nothing to do with S.O.O, but instead with unfavourable steric interactions.So this is not the only effect that needs to be looked at when determining stability.
Conclusion
It has been discussed how to model the transition state of a concerted pericyclic reaction using many different methods, some that are at a higher level of theory than others and also some that are more expensive. The trasnition state was modelled and forced into a minima using the IRC method, which is a good technique as it is impsooible to know what the porduct outcome is from the transition state. The activation energies were tested and it was found that the reaction studied goes by the chair transition state.
These new skills were then applied to the study of the Diels Alder reacion. It was found that this reaction goes in a synchronous process. Then the exo and endo transitions states were investigated and it was found that the endo transition state is more stable, even though the endo product is the less stable, kinetic product.
References
- ↑ www.chemtube3d.com
- ↑ Transition Structures of the Diels-Alder Reaction of Butadiene with Acrolein 1129 Richard J. Loncharich, Frank K. Brown, and K. N. Houk*
- ↑ www.science.uwaterloo.ca
- ↑ 4.0 4.1 Steric effects vs Secondary Orbital Overlap in Diels Alder Reactions. MNDO and AM1 Studies. A.Fos, R.Cardona, N.J.Kiwiet"


