Rep:Mod:phys3RG1712
Introduction
Preface
A transition structure or state represents the molecular geometry that lies at the point of highest energy along the reaction pathway linking reactants to products in a chemical reaction. Through the acquisition of a transition structure one may elucidate a wide range of aspects of the chemistry underpinning a reaction and as a consequence much work in computational chemistry is associated with locating these points on a potential energy surface (PES). Typically, both qualitative and quantitative features of reactivity are included in the output of a computational experiment, examples of each being reaction mechanisms and activation energies respectively. It is often the case that qualitative insights take precedence over quantitative data in computational chemistry. This arises from the fact that computational techniques are built on different levels of approximations and so quantitative results often display vast discrepancies from one method to the next. This means that such data are invalid standards against which to judge the data of classical experiments. The true value of computational chemistry however, resides with the ability to yield understanding of the aspect of chemical reactivity under examination. In this experiment the Cope Rearrangement of 1,5-Hexadiene as well as various forms of the Diels-Alder Reaction are considered using the Gaussian program.
Computational Techniques I - Electronic Structure Methodology
In practice, the exact mathematical solutions and associated analytical functions characteristic of two body systems are unattainable in the treatment of large molecules. In this instance difficulty arises in the separation of variables required in order to solve the dynamical equation for the ensemble of particles comprising one's molecule 1. The distinguishing attribute of computational methods is that they operate such as to provide approximate solutions to the dynamical equation. Such simplifications are often made through the implementation of an approximate separation of variables derived from the physical characteristics of the system. One important example of such a simplification is the Born-Oppenheimer Approximation in which the motions of nuclei and electrons are decoupled. Through the parameterisation of the electronic wave function in terms of nuclear positions it is possible to generate a PES for the nuclei and hence solve for the nuclear positions 2. With respect to transition structures, significant difficulty is experienced in locating them using a force field or molecular mechanics methodology 1. These complications arise from the fact that reactions in which bonds break or form may not be described by a single force field energy function. Other aspects that are not well-accounted for in force field procedures are changing bond types over the course of a reaction. For this reason electronic structure methods and more precisely independent particle models are the techniques of choice in the investigation of the Cope Rearrangement and the Diels-Alder reaction.
Computational Techniques II - Independent Particle Models
The salient feature of an independent particle model is that any single electron is assumed to be unaffected by the motion of other electrons. Electron-electron interactions are accounted for most efficiently in such a model through regarding them as an average property of the system 1. A large number of electronic structure methods take their roots in this framework, known as Hartree-Fock theory. Indeed, most methodologies under the Hartree-Fock umbrella consist of either enhancing the accuracy of calculations by increasing the number of orbital determinants or decreasing required computational time through parameterising the technique with experimental data. The former set of methods are classed as ab initio due to their derivation from the first principles of quantum mechanics while the latter are known as semi-empirical methods. Examples from both categories will be seen below. Aside from the method, the basis set to accompany it is another important consideration when performing a calculation 3.
Computational Techniques III - Basis Sets
The choice of basis set will depend on the size of the basis set and on the type of basis function required to approximate the molecular orbitals to the desired level of accuracy in the reaction being investigated. It should be noted that there are a plethora of basis set options available in the Gaussian program 4 with more besides readily available on websites 5. The more functions a particular basis set compromises, the greater the tendency towards a mathematically complete set and hence the more accurate an individual calculation will be. However, as the computational expense of a calculation scales with the 4th power of the size of the basis set it is often beneficial to strike a balance between accuracy and computational cost 1. Fortunately however, a good choice of basis function, which represents the molecular orbital well, may alleviate the necessity for a large basis set. The two main types of basis function associated with electronic structure methods are Slater basis functions (STOs) and Gaussian basis functions (GTOs) 3. Predictably, in the Gaussian program the latter basis function is preferred for calculations. Indeed most electronic structure methods rely solely on Gaussian functions for their calculations. Although less accurate when taken in isolation, a GTO has the advantage that its associated integrals may be solved by analytical means 3. One key application of the facile solution of such integrals is that linear combinations of GTOs may be utilised as representations of STOs. This has the effect such as to reduce CPU time, the increasing number of GTOs being more than counterbalanced by the ease with which analytical integration can be carried out. Further reference will be made to the choice of method and basis sets during the examination of the reactions below.
Results and Discussion
Prelude to The Cope Rearrangement Tutorial
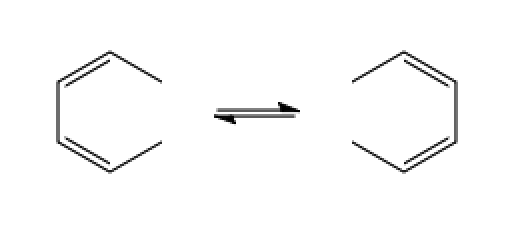
The Cope Rearrangement, discovered by Arthur Cope in 1940 and depicted in figure 1, is a thermoneutral, [3,3]-sigmatropic reaction 6. In the context of the Woodward-Hoffmann rules, a qualitative theory introduced as a means of determining the likelihood of a given pericyclic reaction occurring, the Cope Rearrangement is a 4n + 2 electron thermally allowed reaction proceeding via a Huckel topology 7. The mechanism of the Cope Rearrangement has been scrutinised extensively in the literature in both experimental 8,9 and computational 10 studies. Modern opinion on the issue of whether the Cope Rearrangement corresponds to a model of concert or non-concert would seem to be decided in line with the theory of the former 11. The transition states of the concerted reaction pathway resemble boat and chair conformations respectively. Experimentally the chair transition structure has been found to be lower in energy 9. In this part of the experiment the local minima as well as the saddle points of the PES associated with the Cope Rearrangement were located and characterised at the Hartree-Fock (HF) and Density Function Theory (DFT) levels of theory. The activation energies of the Cope Rearrangement were calculated and compared to experimental values 11.
Optimisation of Reactants and Products
The 3-21G Basis Set
The first optimisation was performed on an anti conformer of 1,5-hexadiene using the HF level of theory and a 3-21G basis set. 3-21G is an example of a Pople type basis set 12 which may in turn be classified more generally as a contracted basis set. The advantage of using a contracted basis set lies in its ability to reduce computational expense by focussing less on core orbitals which although dominant with respect to energy calculations, contribute little to chemically important processes 1. In the overwhelming majority of cases in chemistry, it is the valence orbitals which dictate reactivity as well as other properties such as polarisability and in a non-contracted basis set these will represent only a small fraction of the computed functions. The priority of the core orbitals is diminished through isolating them from the set of orbitals to be determined by the variational principle and instead, a specified linear combination of functions is used to represent them. Thus in the rate-limiting step of the computation, the number of orbitals to be explicitly determined by the variational principle has been scaled down. The notation of the 3-21G basis set may be described by the k-nlmG basis set formalism 1. The k in this case denotes the number of primitive Gaussian type orbitals (PGTOs), the entire ensemble of basis orbitals, that are linearly combined to form the core orbitals. The nlm is indicative of the fact that Pople type orbitals are characterised by either split valence (SV) or triply split valence depending on whether or not the m is included. In the case of the 3-21G basis set one can see that only two numbers precede the capitalised 'G' and so it is an example of a split valence basis set. The numbers 2 and 1 in this case act as a statement specifying that the core atomic orbitals are described by two basis functions whereas the valence orbitals are described by one basis function 3. On a more detailed level the capitalised 'G' standing for 'Gaussian' acts as a divider between basis function, which appear before the 'G', and polarisation functions which appear after. There are no polarisation functions incorporated into the 3-21G basis set. However examples of basis sets with polarisation functions will arise at a later stage in the experiment.
Gaussian Error
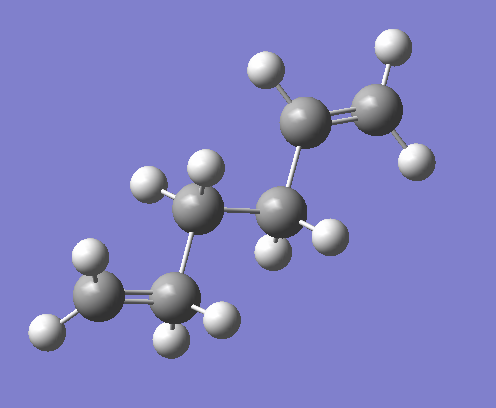
The job type and method inputs to the Gaussian calculation setup are provided in figures 2 and 3. On performing the calculation the error message shown in figure 3 was received, the output file making reference to the fact that an incorrect structure had been submitted for calculation. On inspection of the 1,5-hexadiene input structure it was noted that a pentavalent carbon was present as can be seen in figure 4.

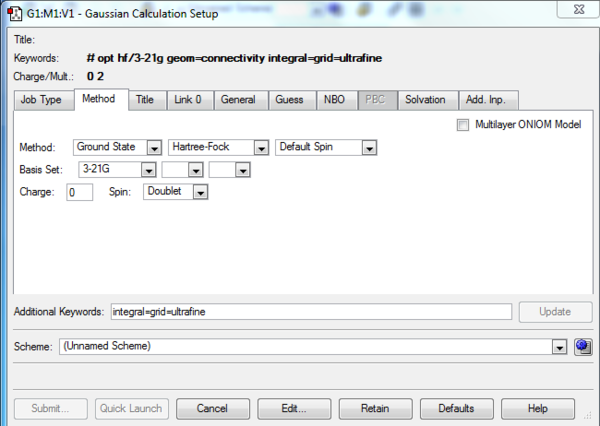

In hindsight one may anticipate the occurrence of such an error by reviewing the spin setting under the method tab of the Gaussian Calculation Setup. As can be seen in figure 3, the spin is given to be a doublet when a singlet is to be expected.
Successful Calculation
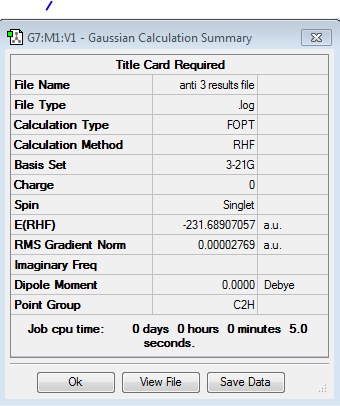
The calculation was repeated with the corrected input structure and a molecule with an energy of -231.689071 Hartrees was obtained. The results file for this calculation may be observed in figure 6. Energies in Hartrees are given to six decimal places here as a means of demonstrating the authenticity of the results. The conversion factor in kcal/mol is taken to be 627.509 and will be used in determining the activation energies through the various transition states of the Cope Rearrangement in order to provide a direct comparison to experimental results given in the same units. The symmetrise function under the edit menu was enabled and the point group of the anti conformer was found to be C2h and is given as anti 3 in table 1. It should be noted that good practice would dictate that the result of an optimisation should not be symmetrised subsequently. It is done here in order to illustrate the function. The next conformer of 1,5-hexadiene to undergo optimisation was one with a gauche linkage. Elementary organic chemistry would predict the anti conformation to be lower in energy relative to gauche due to the existence of a 180 degree dihedral angle between the carbon atoms along the hydrocarbon chain. The optimisation and subsequent symmetrisation of the gauche conformer in fact yielded an energy of -231.692661 Hartrees and a point group of C1 corresponding to gauche 3 in table 1 or equivalently figure 9 below. It should be noted that the conformer was re-optimised following symmetrisation. Contrary to the first principles of organic chemistry, the gauche 3 conformation retrieved possesses a more negative energy and hence, according to the calculations, exhibits higher stability with respect to the anti 3 conformation.

A Global Minimum for 1,5-Hexadiene?
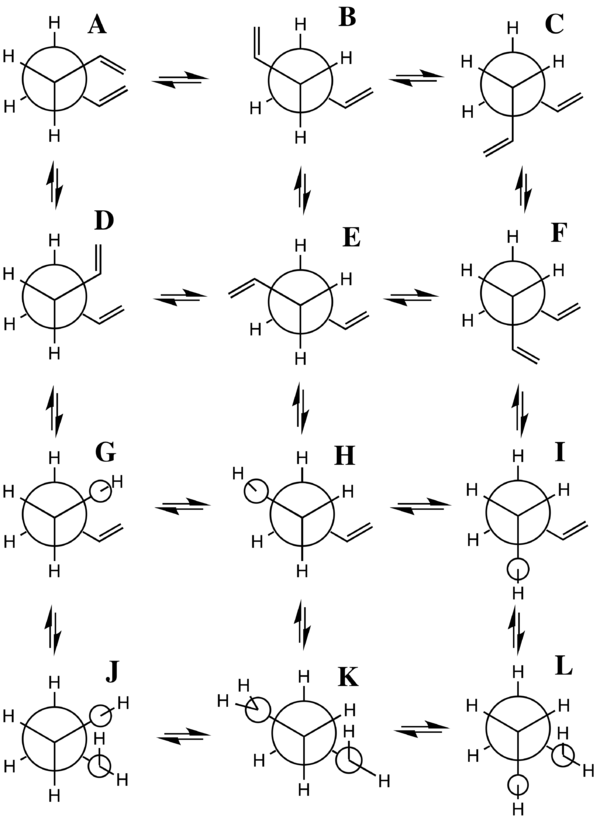
One may observe from the data in table 1 that the gauche 3 conformation is in point of fact 2.253 kcal/mol lower in energy. This apparent anomaly has been rationalised by Rocque et al 13 as being an effect born out of stabilising hydrogen bonding between the vinyl hydrogens and the pi electron clouds of the hydrocarbon chain. Indeed such hydrogen bonds have been postulated in a wide variety of organic systems 14. The energy difference between the anti and gauche conformations in the saturated hydrocarbon n-butane has been demonstrated by Widberg and Murcko to lie 0.8-1.0 kJ/mol per C-C linkage in favour of anti stabilisation 15. Thus one would have to remain sceptical as to the purported degree of stability imparted to the gauche conformer by a computational calculation especially in light of the estimated weakness of these C-H to pi interactions 14. The question of which conformation represents the global minimum for 1,5-hexadiene is one that is complicated by virtue of the fact that they all possess roughly the same energy 13. Experimental studies by electron diffraction have shown the anti conformer of 1,5-hexadiene to be the lower energy conformer 16 although as of yet there does not seem to be conclusive evidence to settle the argument in favour of one or the other. When compared to conjugated dienes, 1,5-hexadiene displays a much greater degree of conformational flexibility due to the fact that its sp2 carbons are separated by three sigma C-C bonds. 10 of the possible 27 conformers are non-degenerate 13. A Newman projection diagram adapted from Gung et al 17 aims to illustrate the torsional angles of the various conformers along the central C-C bond.
Further Confusion and Movement Towards a Resolution
It should be pointed out that the D, F, J and L conformers in figure 8 comprise two pairs of enantiomers, D partnering with F and J with L 13. From the relatively sparse experimental data available on the global minimum conformation for 1,5-hexadiene there would seem to be much confusion as to whether it is in general an anti or a gauche conformation that lies lower in energy. Predictably the results of computational experiments have been even more inconsistent. The prediction of the lowest energy conformer by Rocque et al is in contrast with that predicted by the calculation carried out here despite the fact that the computations were performed at the same level of theory 13. Gung alludes to the fact that 1,5-hexadiene represents something of an enigma in terms of its global minimum, posing new challenges and opportunities for the calibration of new computational methods 17. The key aspect of the inconclusivity would seem to rely on the fact that the energies of the conformers, be they anti or gauche are very similar and hence have the potential to defy characterisation. Possibly the most truthful interpretation is that the decision is too close to the wire. One could certainly argue that a Hartree Fock calculation, given the neglect of electron correlation effects, is too blunt a tool to access the global minimum of 1,5-hexadiene. In terms of chemical theory it is very possible that the aforementioned stabilising C-H pi interactions are the origin of both experimental and computational inconsistencies. The ability to stabilise the gauche conformations via these interactions is a strong suggestion for the difficulty inherent in differentiating between the energies of these conformers.
8 or 9 Local Minima for 1,5-Hexadiene?
Based on the discussion above, if one was to hold the idea of the C-H pi stabilising interaction in high regard, the gauche 3 conformation corresponding to Newman projection D in figure 8 would be the likely guess as to the lowest energy conformer. Following the optimisation of the conformer matching Newman projection D an energy and structure corresponding to gauche 3 was indeed obtained. In the next stage of the experiment, the conformation corresponding to anti 2 in table 1 was optimised at the HF/3-21G level of theory with an energy of -231.692535 Hartrees obtained. The ensuing symmetrisation yielded a Ci point group for the conformer. In total 8 local minima were located on the PES for 1,5-hexadiene. One intriguing result is displayed as the final entry in table 1. One may observe that this 'conformer', returned on an optimisation calculation has a significantly higher energy than that of the others. It transpires that this structure is not a true minimum. A frequency analysis determined the structure to possess 3 imaginary frequencies. As will be seen later, the presence of solely positive frequencies is a criterion which needs to be fulfilled in order to classify a structure as a true minimum on the PES. This is always something which must be looked for whether one is searching for a minimum or a transition structure. The exclusion of an imaginary frequency following optimisation is a requirement for classification of a minimum and correspondingly the inclusion of one is the minimum requirement in order to classify a transition structure.
Figure 9. 1,5-Hexadiene Anti 3 |
Figure 10. 1,5-Hexadiene Gauche 3 |
| Conformer | Structure | Point Group | Energy/Hartrees HF/3-21G | Relative Energy/kcal/mol | ||
|---|---|---|---|---|---|---|
| Gauche 1 | C2 | -231.687716 | 3.103 | |||
| Gauche 2 | C2 | -231.6916670 | 0.624 | |||
| Gauche 3 | C1 | -231.692661 | 0.000 | |||
| Gauche 4 | C2 | -231.691530 | 0.710 | |||
| Gauche 5 | C1 | -231.689616 | 1.911 | |||
| Gauche 6 | C1 | -231.689160 | 2.197 | |||
| Anti 1 | C2 | -231.692602 | 0.037 | |||
| Anti 2 | Ci | -231.692535 | 0.079 | |||
| Anti 3 | C2h | -231.689071 | 2.253 | |||
| Anti 4 | C1 | -231.690971 | 1.060 | |||
| Strange | C2v | -231.672383 | 12.725 |
Introduction to Density Functional Theory
In the next stage of the experiment the anti 2 conformer is optimised at a higher level of theory. This reactant energy is necessary in order to calculate the activation energy of the Cope Rearrangement. Computing the energy of the anti 2 conformer will allow for a comparison of the activation energies predicted at the HF/3-21G and the B3LYP/6-31* levels of theory. Density functional theory (DFT) avoids many of the shortcomings of HF methods at the cost of incurring a larger amount of CPU time for its calculations. Of the various branches of DFT, the semi-empirical B3LYP method is widely regarded as being the most successful 1. The primary disadvantage of using DFT is the unavailability of an approach which can be used to systematically improve the convergence of calculations towards an exact solution 1. However, in practice the B3LYP method usually only exhibits errors in computed properties that arise as a result of the inherent error contained in the choice of exchange correlation functional. The basis set used, 6-31G* is very similar to the 3-21G basis set used in the HF calculations save for the fact that it better represents the core orbitals through the use of 6 PGTOs as opposed to 3. The energy of the anti 2 conformer, as may be seen in table 4, is determined to be -234.61171167 Hartrees.
Comparison of Geometries - HF/3-21G vs. B3LYP/6-31G

The geometries of the anti 2 structure calculated via HF/3-21G and B3LYP/6-31G are compared in table 2 with an extra column providing an experimental standard against which to judge the results for the carbon carbon bond lengths. In a general sense, HF theory has a tendency to underestimate bond lengths 1. This can be seen for the sp2 C-C bonds where B3LYP does a much better job of reproducing the results of electron diffraction experiments. Elsewhere however, there does not seem to be much of a trend present. Perhaps the only point of note is that B3LYP produces a dihedral angle between carbon substituents on the sp2-sp3 C-C linkage closer to 120 degrees. In conclusion B3LYP produces results that are in better agreement with the admittedly sparse experimental data available for the structural parameters of 1,5-hexadiene 16. A labelled diagram for use in conjunction with table 2 is given in figure 11.
| Atom Labels | HF Bond Lengths (Å) | B3LYP Bond Lengths (Å) | Electron Diffraction Bond Lengths (Å) 16 | Dihedral Angle | HF(degrees) | B3LYP(degrees) |
|---|---|---|---|---|---|---|
| C1-C4 | 1.316 | 1.334 | 1.340 | C1-C4-C6-C9 | 114.654 | 118.708 |
| C4-C6 | 1.509 | 1.504 | 1.508 | C4-C6-C9-C12 | -180.000 | -180.000 |
| C6-C9 | 1.553 | 1.548 | 1.538 | C6-C9-C12-C14 | -114.654 | -118.708 |
A Frequency Calculation and Thermochemical Properties
A frequency calculation on the B3LYP optimised anti 2 conformer was carried out. This is obligatory if one wants to confirm the identification of a local minimum. A true minimum, as discussed in brief above, will have no imaginary frequencies. An imaginary frequency will be found when the second derivative of the energy on the PES, the force constant, is negative. If one considers the PES, a negative second derivative of the energy will mean that the energy function is decreasing in some direction away from the point of interest and so acts to dispel the notion that the point being examined is a minimum. Figure 17 shows the vibrational spectrum. The frequency data in table 3 consists solely of positive frequencies, indicating that a true minimum has been found in the form of the anti 2 conformer on the PES of 1,5-hexadiene. Non-zero values under the Infrared heading indicate that the vibrational stretch involves a change in the dipole moment of the molecule. The thermochemical properties output from the frequency calculation are given in table 4. Of these parameters, the sum of electronic and thermal energies will be used in order to obtain the activation energy of the Cope Rearrangement later. When the frequency calculation was repeated at 0.01 K, by altering the keyword in the calculation setup, the thermal contribution predictably fell to zero and the calculated thermochemical parameters became equivalent to the sum of electronic and zero-point energies. It should be pointed out that it was not possible to perform a calculation at exactly 0 K in the Gaussian program. The value of 0.01 K was used as a compromise.

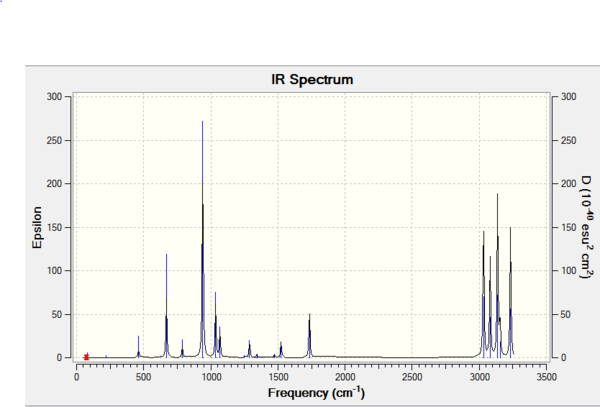
| Parameter | Standard Calculation(Hartrees) | Calculation at 0.01 K (Hartrees) |
|---|---|---|
| Sum of Electronic + Zero-point Energies | -234.469215 | -234.469215 |
| Sum of Electronic and Thermal Energies | -234.461866 | -234.469215 |
| Sum of Electronic and Thermal Enthalpies | -234.460922 | -234.469215 |
| Sum of Electronic and Thermal Free Energies | -234.500800 | -234.469215 |
Optimisation of the Chair and Boat Transition Structures
Methodology
In this part of the experiment 4 techniques were used to optimise to a transition state. In the case of the chair, the Berny and redundant coordinate methods were used. The geometries of the resulting transition structures were compared. In a similar fashion the QST2 and QST3 methods were utilised to optimise to a boat transition structure and again the resultant geometries were compared.
Optimising to the Chair Transition Structure (Berny)
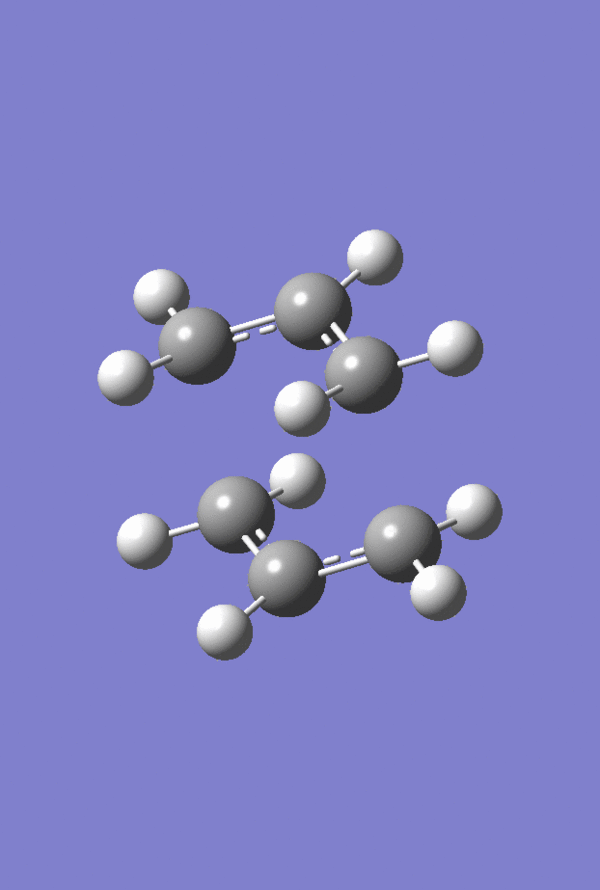
An allyl fragment was optimised at the HF/3-21G level of theory and duplicated in order to set up an estimated structure for the chair transition state. Force constants were computed once using the Berny optimisation, named in honour of the eminent computational chemist Berny Schlegel 18. The chair structure was obtained, its geometric details noted in table 5. Following a frequency calculation a single imaginary frequency was located at 818 cm -1. This frequency is animated in figure 13.
Figure 18. Chair Transition Structure. |
Optimising to the Chair Transition Structure - Frozen Coordinate Method
In the frozen coordinate method, constraints are applied to the input structure undergoing optimisation. In this case the interatomic distance between the allyl fragments representing the forming/breaking bonds was fixed to 2.2 Å. This distance is a sensible guess for the transition state bond length based on the bond lengths of the Berny transition structure. Once the initial optimisation has taken place, the forming/breaking bonds may be optimised separately. A successful calculation led once again to the chair structure. A comparison of the forming/breaking bond lengths computed by the two methods is given in table 5. One can see that the frozen coordinate optimisation bond lengths are slightly longer compared to the Berny optimised bond lengths. A labelled diagram to accompany table 5 is given in figure 14. Hydrogens 8 and 9 are included in order to give some indication of 1,3 diaxial interactions which may raise or lower the energy of the transition state depending on the distance at which van der Waals attractive forces may or may not begin to manifest themselves. The frozen coordinate method produces longer interatomic distances between these hydrogens than it does for the remaining hydrogens on the allyl fragments. Indeed both of these interatomic distances are shorter relative to their lengths in the Berny-optimised chair.

| Atom Labels | Berny Optimisation (Å) | Frozen Coordinate Optimisation (Å) |
|---|---|---|
| C3-C4 | 2.02043 | 2.02071 |
| H8-H9 | 2.92172 | 2.92226 |
| H-H | 2.54566 | 2.54535 |
| H-H | 2.63169 | 2.63163 |
Optimising to the Boat Transition Structure - QST2
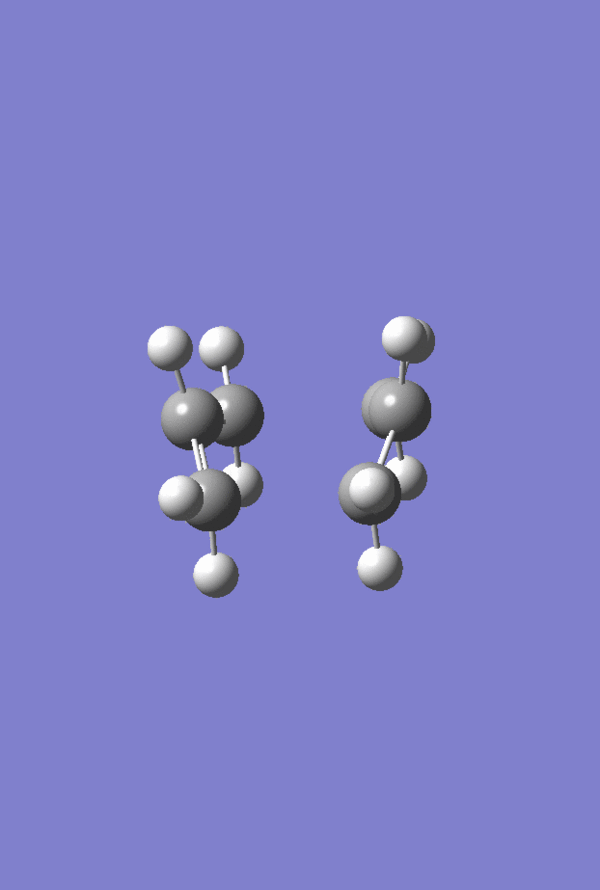
Locating transition structures is a difficult task. Finding minima on the PES is often a facile process as continually minimising the energy function via steepest descent will eventually provide a local minimum even if not the global minimum. QST or quadratic synchronous transit 1 is a technique which attempts to interpolate between two input reactant and product structures in the hopes of finding an energy maxima between them on the PES. QST functions by taking the point of maximum energy from a linear synchronous transit method and performing energy minimisations orthogonal to this point to generate a QST path 1. This path is subsequently examined for the presence of a transition structure. The coordinates of the reactant and product may be described as being linked 19. QST may be described as a one-structure interpolation method. In essence, this means that a single set of characteristics or coordinates is chosen to be the overarching difference between a reactant and a product molecule. Once this distinguishing feature is known, it is kept fixed and an optimisation is undertaken with respect to all other features of the reactant/product system. The success of the method hinges on how well one is able to determine the key distinction between reactants and products. The more pronounced the differences, the less fruitful the results are likely to be 1. Figure 15 displays the failed QST2 calculation (The calculation "failed" in the sense that it did not produce the transitions state you were looking for, otherwise the result should be a valid chair transition state. João (talk) 15:08, 23 December 2014 (UTC)). In this instance the reactant and products possessed anti conformations. Clearly, in QST2 calculations in order to have a reasonable chance of success the reactants and products must bear some structural resemblance to the transition state. The boat transition state featured in figure 16 was obtained when the reactant and product were modified such that the carbon-carbon dihedral angles bore a greater resemblance to those of the boat. Figure 17 shows an animation of the imaginary frequency corresponding to the Cope Rearrangement proceeding via the boat transition state.
Figure 15. Failed QST2 Optimisation - Dissociated Chair Structure. |
Figure 16. QST2 Optimisation - Boat Transition Structure. |
Optimising to the Boat Transition Structure - QST3
A logical extension to the QST2 calculation is a QST3 where the transition structure is also defined. One can imagine that such a technique would allow for a greater margin of error in the choice of the fixed coordinates described above. The computation yielded a boat transition structure with a slightly different geometry relative to that obtained from the QST2 calculation as can be seen from the data in table 6. The accompanying labelled diagram is provided in figure 18.
(Nice that you tried QST3. Did you start from the anti conformers or the eclipsed ones? What would it take to persuade you that QST2 and QST3 yielded the same transition state structure? João (talk) 15:08, 23 December 2014 (UTC))
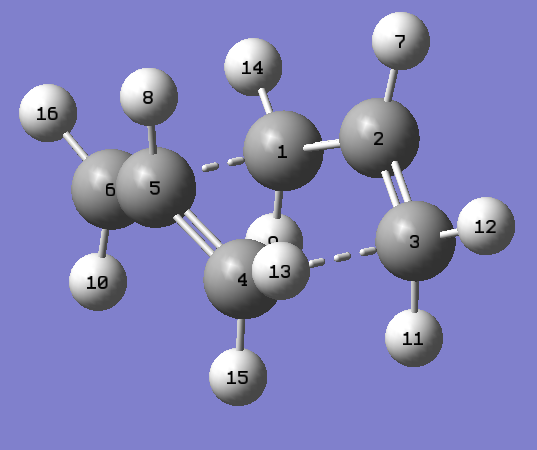
| Atom Labels | QST2 bond length (Å) | QST3 bond length (Å) |
|---|---|---|
| C3-C4 | 2.14020 | 2.13980 |
| C2-C5 | 2.77960 | 2.77960 |
| H8-H9 | 3.13460 | 3.13420 |
Connecting Geometries - The Intrinsic Reaction Coordinate (IRC)
The method of steepest descent may be used to determine local minima in the PES when given a transition state. The series of points at which the energy gradient is largest are taken sequentially using this approach until a local minimum is reached. IRC calculations were performed on both the optimised boat and the optimised chair transition states. The IRC calculation converged after sampling had occurred at 44 points along the IRC in spite of the fact that 50 points were specified in the calculation setup. Force constants were calculated always in this calculation. The gauche 2 conformer featured in table 1 was obtained following an optimisation of the 44th and final point along the reaction coordinate. The same conformer was obtained for the IRC calculation using the boat transition state. Figure 21 shows the convergence of the RMS gradient to a value very close to 0 as the final point in the calculation is reached. It was found that when the IRC calculation was performed on the chair transition state, the gauche 2 conformer of 1,5-hexadiene was obtained. Although the IRC was only run in one direction, because the Cope Rearrangement is thermoneutral, the PES will be symmetrical around the transition state. This has the consequence such that the same conformer should be obtained on running either a forwards or a backwards IRC calculation. Hence the chair transition state in this case connects the gauche 2 conformations of 1,5-hexadiene. Another point that has to be mentioned is that IRC calculations must be run at the same level of theory at which the transition state was found in order to maintain consistency. The IRC is means of honing in on the chemically important region of the PES. The intrinsic reaction coordinate is synonymous with the minimum energy pathway connecting reactants and products. The sole difference being that the IRC is in mass-weighted coordinates 1. In general it is a very useful and efficient method for exploring the PES of the system under investigation.


Activation Energy of the Cope Rearrangement
Activation energies were calculated for the Cope Rearrangement using the anti 2 conformer as the reference reactant. One may observe from the calculated values in table 8 that the B3LYP/6-31G* level of theory is a much better match to literature values (Did you check if an imaginary frequency was still obtained at the higher level of theory? João (talk) 15:08, 23 December 2014 (UTC)). The bracketed number following the experimental value denotes the error in the measurement in units of kcal/mol. As mentioned previously in great depth, B3LYP is generally one of the most accurate computational methods available for such calculations (It is not one of the most accurate, but has a remarkable accuracy/computational cost ratio João (talk) 15:08, 23 December 2014 (UTC)). Predictably, activation energies were higher when the calculation was performed at 0.01 K owing to the absence of any thermal energy (The conclusion is not completely straight forward: why are thermal corrections more important in the reactants than in the transition state? João (talk) 15:08, 23 December 2014 (UTC)). The presence of thermal energy would aid the surmounting of an energy barrier thus reducing the excess energy required.
| Structure | HF/3-21G Electronic Energy (Hartrees) | HF/3-21G Sum of Electronic and Thermal Energies at 0.01 K (Hartrees) | HF/3-21G Sum of Electronic and Thermal Energies at 298.15 K (Hartrees) | B3LYP/6-31G* Electronic Energy (Hartrees) | B3LYP/6-31G* Sum of Electronic and Thermal Energies at 0.01 K (Hartrees) | B3LYP/6-31G* Sum of Electronic and Thermal Energies at 298.15 K (Hartrees) |
|---|---|---|---|---|---|---|
| Chair | -231.6193225 | -231.466700 | -231.461340 | -234.556931 | -234.414910 | -234.408982 |
| Boat | -231.6028024 | -231.450924 | -231.445294 | -234.5430788 | -234.402356 | -234.396012 |
| Anti 2 Reactant | -231.6925350 | -231.539539 | -231.532566 | -234.6117117 | -234.469215 | -234.461866 |
| Pathway | HF/3-21G at 0.01 K (kcal/mol) | HF/3-21G at 298.15 K (kcal/mol) | B3LYP/6-31G* at 0.01 K (kcal/mol) | B3LYP/6-31G* at 298.15 K | Experimental at 0 K (kcal/mol) 8 |
|---|---|---|---|---|---|
| Chair | 45.70712805 | 44.69495603 | 34.07687625 | 33.18518596 | 33.5 (0.5) |
| Boat | 55.60671004 | 54.76396545 | 41.95462423 | 41.32397769 | 44.7 (2) |
Prelude to The Diels-Alder Cycloaddition
Considering The Reactants
Cis-Butadiene
As a starting point the HOMO and LUMO of the reactant cis-butadiene were plotted following optimisation at the AM1 semi-empirical level of theory. As can be seen from the orbitals in figures 22 through 25 the HOMO is antisymmetric with respect to the plane of symmetry bisecting the C-C single bond whereas the LUMO is symmetric with respect to the same plane.


Figure 26. cis butadiene |
The Prototype Diels-Alder Reaction
The prototype Diels-Alder reaciton involves the reaction of ethylene with cis-butadiene to form cyclohexene as the Diels-Alder adduct.
An Analysis of The Transition Structure
The HOMO and LUMO of the Prototype Diels-Alder adduct calculated at the AM1 semi-empirical level of theory are given in figures 28 through 31. The HOMO is determined to be antisymmetric with respect to the plane whereas the LUMO is symmetric with respect to the same plane. Information regarding the geometry of the transition structure may be found in table 9. The accompanying labelled diagram to be used in conjunction with this table is given in figure 27. Typical sp3-sp3 carbon-carbon bond lengths are approximately 1.54 Å. Typical sp2-sp2 carbon carbon bond lengths are approximately 1.34 Å. Many examples of typical C-C bond lengths determined by x-ray crystallographic methods have been tabulated 20. The van der Waals radius of the carbon atom is given to be 1.70 Å in many sources, cf. Rowland and Taylor for one example of such 21. Given that the lengths of the forming/breaking bonds in the prototype transition structure are 2.12 Å it can be concluded that this value lies within twice the van der Waals radius of carbon. Consequently the carbons lie within a distance where they feel an attraction towards each other favouring the formation of bonds. Figure 32 displays the imaginary frequency corresponding to the bond forming/breaking of the Diels-Alder reaction. Synchronous bond formation is exhibited. When compared to the lowest positive frequency, which may be described as an orthogonal frequency, the imaginary frequency shows movement of the carbons that are involved in bond formation. In contrast the lowest positive frequency, seen in figure 33, shows no movement of the carbons involved in bond formation/bond breakage and so is not of any significance when considering the reaction coordinate.
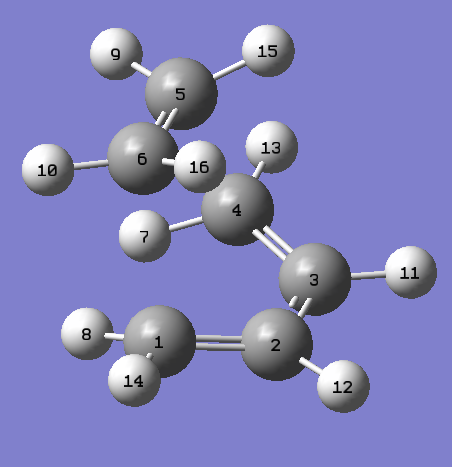

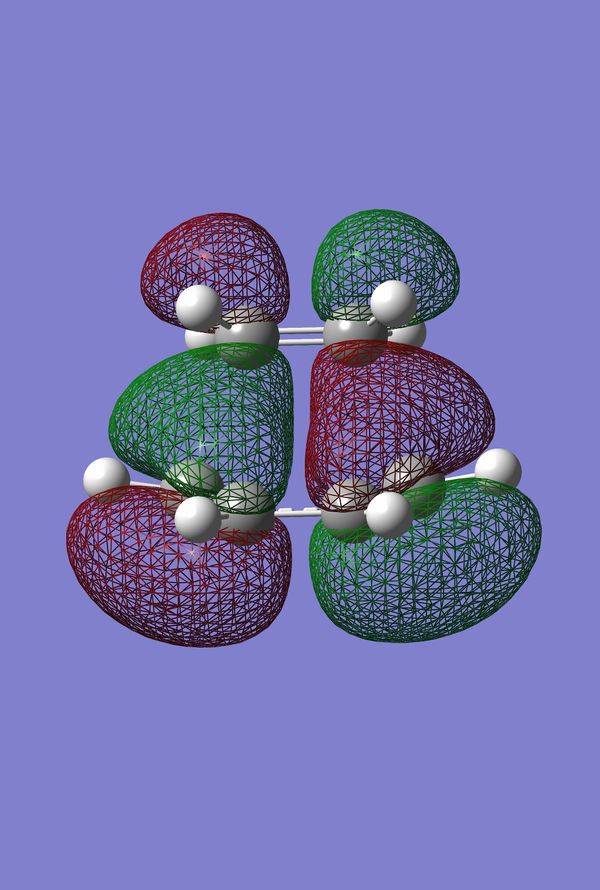

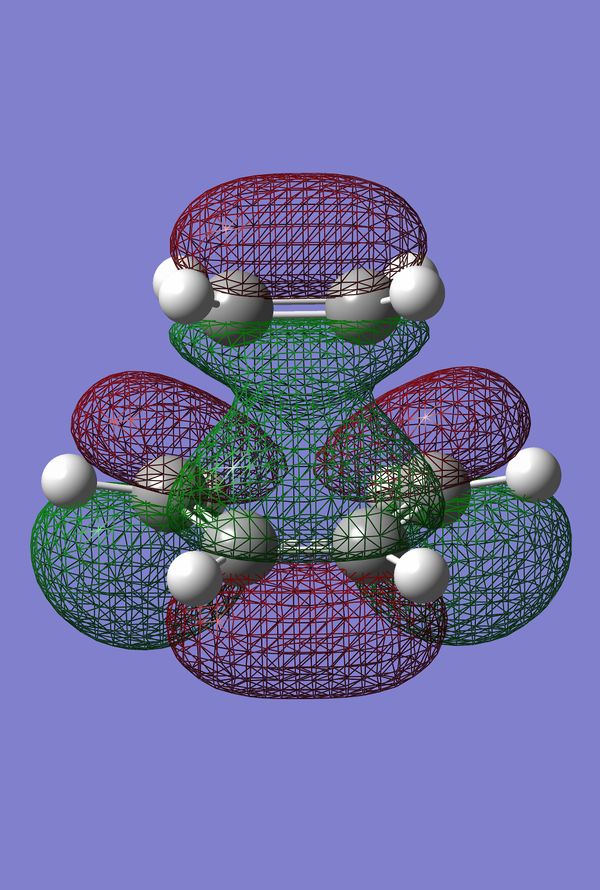

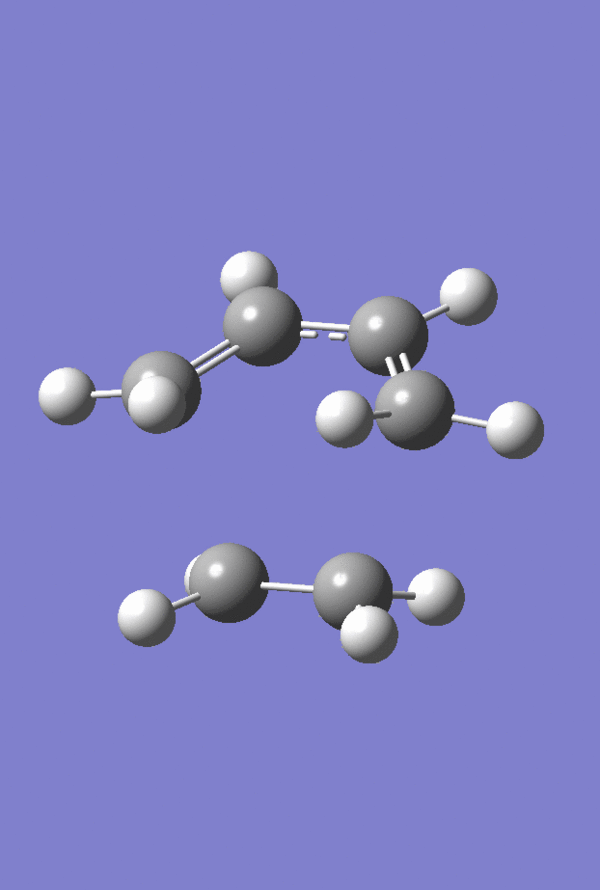
Figure 34. Prototype Diels-Alder TS |
| Atom Labels | Bond Lengths(Å) |
|---|---|
| C1-C6 | 2.12 |
| C5-C6 | 1.38 |
| C3-C4 | 1.38 |
| C2-C3 | 1.40 |
| H7-H9 | 2.31 |
| H11-H15 | 3.15 |
| H9-H13 | 2.60 |
| H13-H15 | 2.55 |
Treatment with FMO and Qualitative MO Theories
In general, computational techniques are fairly well able to accurately gauge the structural output of a given chemical reaction. However, it is often the case that no insight is provided as to the reason why such a reaction might occur. Frontier Molecular Orbital Theory (FMO Theory) represents an attempt to get a handle on qualitative aspects of chemical reactivity which may be used to predict the results of unexplored reactions. The mechanics of FMO theory rely on a consideration of the interaction between the orbitals of the reactants. The distinguishing feature of FMO theory is the priority lent to the interactions of the HOMO and LUMO orbitals. In a normal electron demand cycloaddition, the HOMO of the diene will interact with the LUMO of the dienophile. One may observe from the schematic in figure 35 that both the HOMO of cis-butadiene and the LUMO of ethylene are anti-symmetric with respect to a plane of symmetry bisecting the central bond of the cis-butadiene. In qualitative MO theory it is predicted that favourable interactions will occur between orbitals that are primarily in phase with each other and secondly are close to each other in energy. The former factor is invoked when considering the success of the prototype reaction. Symmetry considerations will determine phase matching which in turn will dictate the extent to which an orbital interaction is favourable.

The HOMO of the Diels-Alder adduct given in figure 36 results from a combination of the HOMO of cis-butadiene and the LUMO of ethylene.
Figure 36. HOMO of DA Adduct |
Allowed or Disallowed - The Woodward-Hoffmann Rules
The qualitative set of rules formulated by Woodward and Hoffmann may be used to predict whether a given pericylic reaction is allowed or disallowed. The rules follow from a consideration of conservation of orbital symmetry. Using these rules, the prototype Diels-Alder reaction could be classified as a thermally allowed 4n + 2 electron cycloaddition proceeding suprafacially. Forming two sigma bonds in this case requires a HOMO-LUMO interaction and the suprafacial classifier denotes the fact that the orbital lobes of the HOMO and the lobes of the LUMO for cis-butadiene and ethylene respectively lie on the same side of their fragments 1. As the phases of the lobes on the HOMO of cis-butadiene and the LUMO of ethylene correlate, there is no significant barrier to reaction and so it is Woodward-Hoffmann allowed.
Activation Energy
The activation energies of the prototype reaction were calculated at 298.15 K. It is interesting to note from table 10 that the AM1 semi-emprical level of theory fits the experimental data better than the B3LYP/6-31G* level. It should be noted that this comparison was made by using each level of theory consistently throughout all calculations. Structures optimised using one level of theory were not used as inputs for calculations at a different level of theory at any point during this experiment. Doing so would have the effect such as to render erroneous any results obtained. One point of note is that the experimental value of Rowlands from 1951 is quoted by Houk 23 in 1996. It is Houk's value, including the error given in brackets, that is provided as this accounts for the fact that the experimental value was taken at a different temperature to the temperature inputted when computing it in this experiment. One possible reason why AM1 fits experimental data better despite being a lower level theory lies in the fact that it is parameterised against experimental data. If empirical results from similar reactions are included in the parameterisation set then it is likely that AM1 will have some bias towards reproducing these values and hence will show improved results when compared to the higher level B3LYP/6-31G*.
| Structure | AM1 Sum of Electronic and Thermal Energies at 298.15 K (Hartrees) | AM1 Activation Energy (kcal/mol) | B3LYP/6-31G* Sum of Electronic and Thermal Energies at 298.15 K (Hartrees) | B3LYP/6-31G* Activation Energy (kcal/mol) | Experimental (kcal/mol) 22 |
| Cis Butadiene | 0.138574 | 25.49380814 | -155.896795 | 20.7498401 | 27.5 (2) |
| Ethylene | 0.080252 | 25.49380814 | -78.533181 | 20.7498401 | 27.5 (2) |
| DA Transition State | 0.259453 | 25.49380814 | -234.396909 | 20.7498401 | 27.5 (2) |
Analysis of the Regioselectivity of the Diels-Alder Reaction
The reaction of maleic anhydride with cyclohexa-1,3-diene to form bicyclo[2.2.2]oct-5-ene-2,3-dicarboxylic anhydride is examined here. In terms of the Woodward-Hoffmann rules it is also a thermally allowed suprafacial process.
Endo and Exo Transition Structures
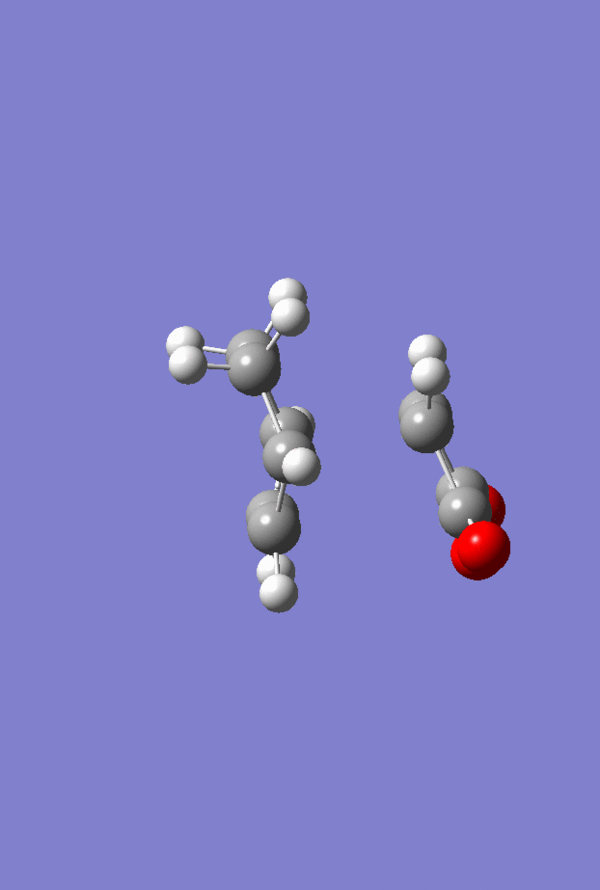
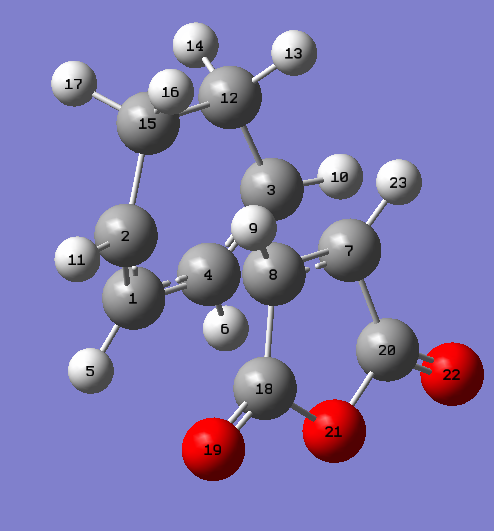
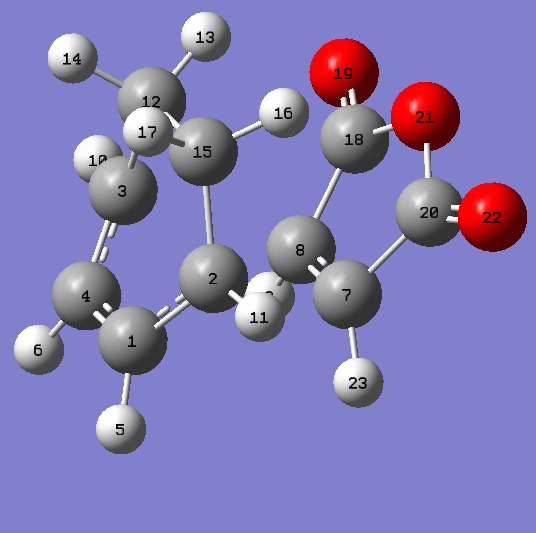
The endo and exo transition structures were located and optimised at the AM1 level. The presence of an imaginary frequency confirmed that a transition state had been obtained. These frequencies are animated in figures 40,41 and 42. All imaginary frequencies located are illustrative of synchronous bond formation. The Endo TS was found to be lower in energy relative to the exo TS by a value of approximately 0.75 kcal/mol. The full energy data may be found in table 10. Structural data for the transition states may be found in table 12 accompanied by labelled diagrams in figures 43 and 44. It can be seen that the length of the forming/breaking bonds in the exo transition state is larger than the equivalent distance in the endo structure. One of the most important factors in determining the relative energies of the exo and endo transition states is the interplay between steric repulsions in the exo structure and secondary orbital effects in the endo. The latter is clearly the more favourable pathway according to modern theory. One may observe from the structural data given in table 12 that the distance between the carbonyl-oxygen-carbonyl fragment and the sp3-sp3 carbon-carbon linkage in the exo transition state is roughly comparable to that between the carbonyl-oxgyen-carbonyl fragment and the sp2-sp2 carbon-carbon linkage in the endo transition structure. Hence this is likely to be the primary reason why the exo is the more strained transition structure. In place of a stabilising secondary orbital effect, there is a form of steric repulsion. Although this secondary orbital effect has long been the suggested reason as to why the endo transition structure is lower in energy than the exo transition state, it has also been proposed that attractive van der Waals interactions play a part in determining Diels-Alder stereoselectivity 24. It is precisely because of this secondary orbital effect that the endo is often the kinetic product observed from such a Diels-Alder reaction. It has a lower energy transition state and thus is formed first in a reaction. In contrast, despite the fact that the exo product is lower in energy due to having less unfavourable steric repulsive interactions, its transition state lies higher in energy and it will not be observed in reactions which proceed under kinetic control. Instead the exo product is the thermodynamic product in the case of the reaction between maleic anhydride and cyclohexa-1,3-diene.
Figure 37. Maleic Anhydride |
Figure 38. cyclohexa-1,3-diene |
Figure 39. Endo Transition Structure |


| Exo Absolute Energy on PES AM1 (Hartrees) | Endo Absolute Energy on PES AM1 (Hartrees) | Relative Energy on PES (Hartrees) | Relative Energy on PES (kcal/mol) |
| -0.05041985 | -0.05150471 | 0.10192456 | 63.95857872 |
| Electronic Energy + Thermal Energy Exo AM1 (Hartees) | Electronic Energy + Thermal Energy Endo AM1 (Hartees) | Relative Electronic Energy + Thermal Energy (Hartrees) | Relative Electronic Energy + Thermal Energy (kcal/mol) |
| 0.144882 | 0.143685 | 0.001197 | 0.751128278 |
| Atom Labels Exo | Bond Lengths (Å) | Atom Labels Endo | Bond Lengths (Å) |
| C2-C15 | 1.48976 | C3-C12 | 1.49053 |
| C1-C2 | 1.39438 | C3-C4 | 1.39305 |
| C1-C4 | 1.39674 | C1-C4 | 1.39724 |
| C12-C15 | 1.52206 | C12-C15 | 1.52295 |
| C7-C8 | 1.41007 | C7-C8 | 1.40846 |
| C2-C7 | 2.17048 | C2-C8 | 2.16238 |
| C12-C18 | 2.94493 | C1-C18 | 2.89208 |
In Search of the Secondary Overlap Effect
The HOMO of the Diels-Alder Adduct for the exo and endo transition structures are plotted in figures 45-47 for the exo and figures 50-53 for the endo. The secondary orbital effect, in line with conventional theory, should be observed in the HOMO of the endo transition structure. On examination of the orbitals however, it does not appear to be the case that there is a secondary effect in operation. There is no in-phase overlap between the carbonyl-based orbitals and the orbitals of the nascent double bond on the cyclohexadiene fragment. It is possible that the absence of such interactions is an artefact of the level of theory used for the calculation. Figures 45-54 include examples of the orbitals plotted at the B3LYP/6-31G* level of theory in order to ascertain whether or not the AM1 level of theory is responsible for the absence of the secondary orbital effect. Although the orbitals calculated at B3LYP/6-31G* level have differing coefficients, the symmetry of the HOMOs remains unchanged and thus there is still no secondary effect observed. Similar to the example of the prototype Diels-Alder reaction it is possible to construct the HOMO and LUMOs of the respective transition states by examining the frontier orbitals of the cyclohexadiene and maleic anhydride reactants. This has been omitted here as the principle has already been demonstrated in relation to the prototype reaction. The point should be stressed once again that all calculations were performed consistently. Calculations involving the AM1 or B3LYP/6-31G* levels of theory were performed at this level of theory for all stages culminating in the location of transition states.
(How about possible secondary orbital effects in orbitals bellow the HOMO? João (talk) 15:08, 23 December 2014 (UTC))
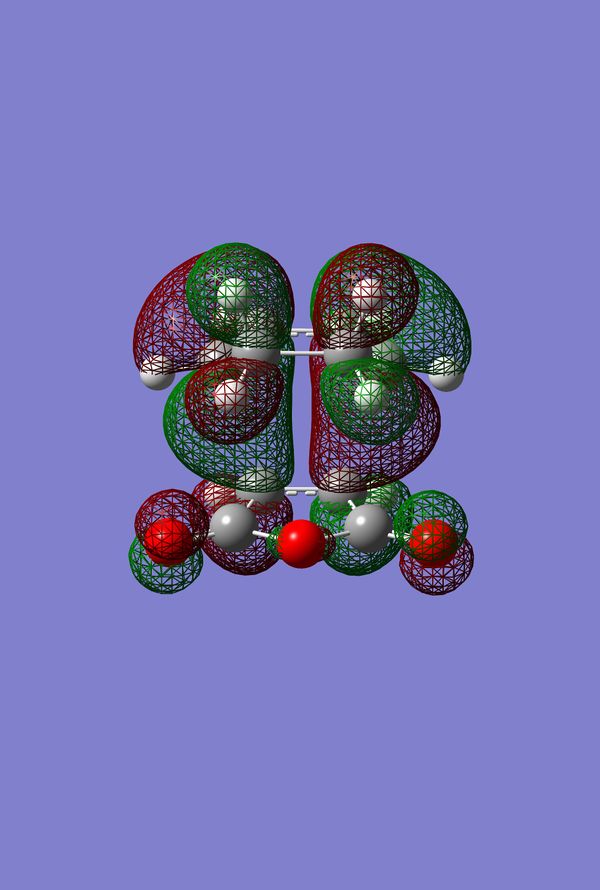
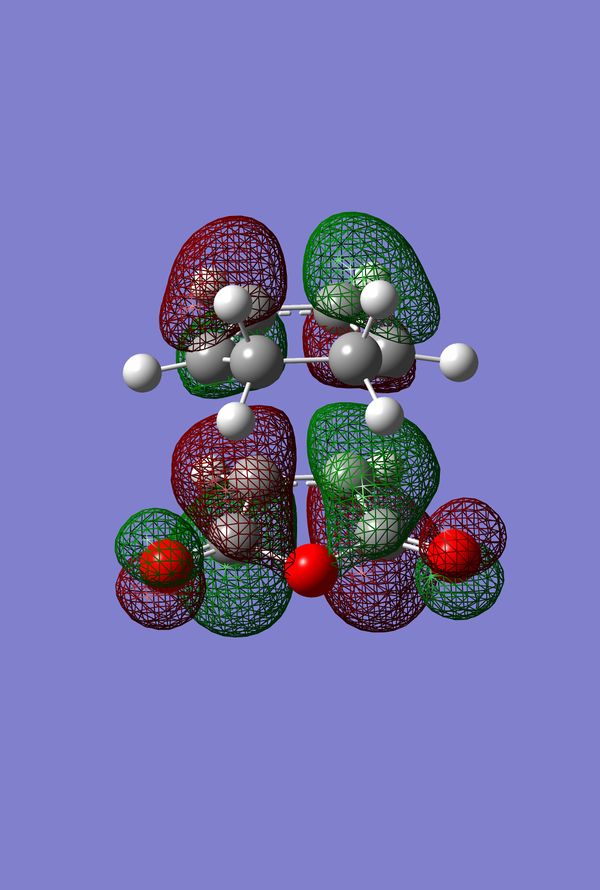
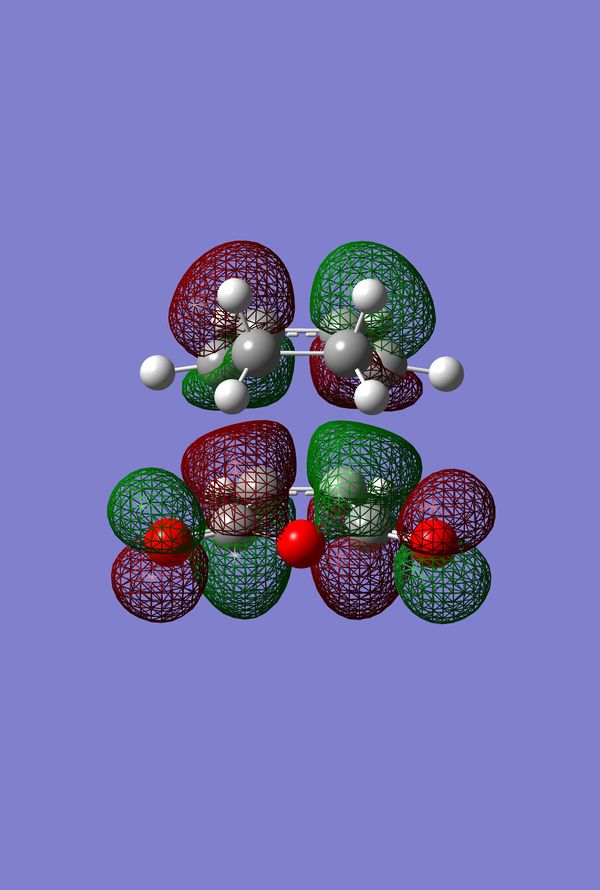


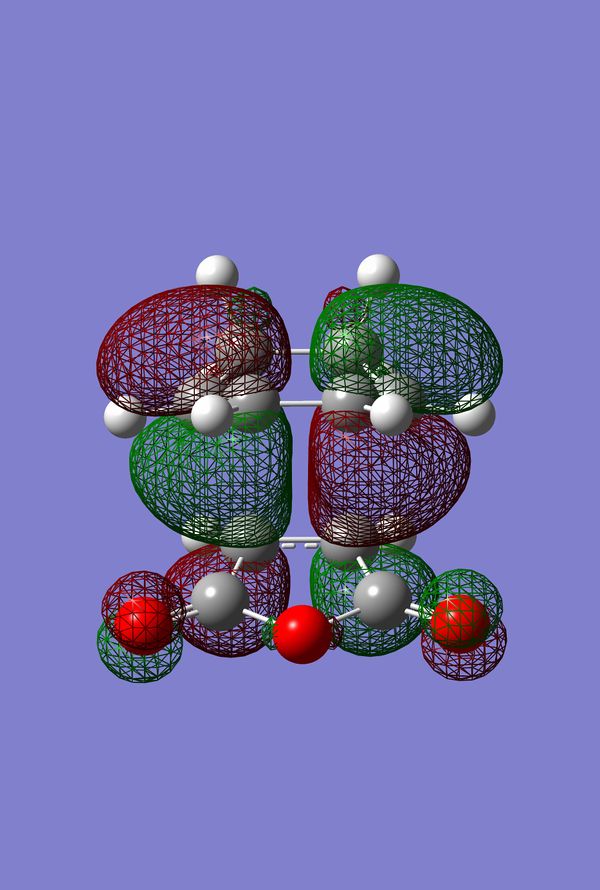
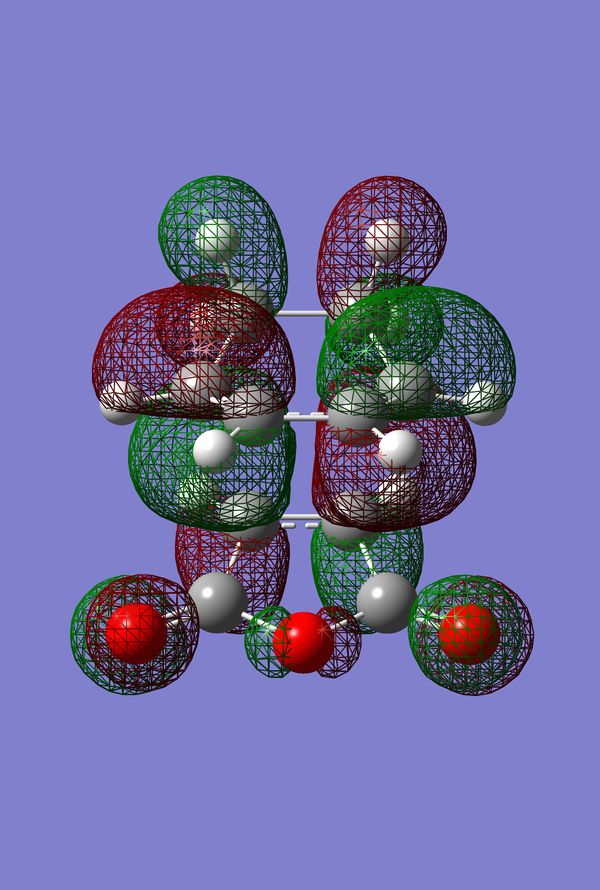
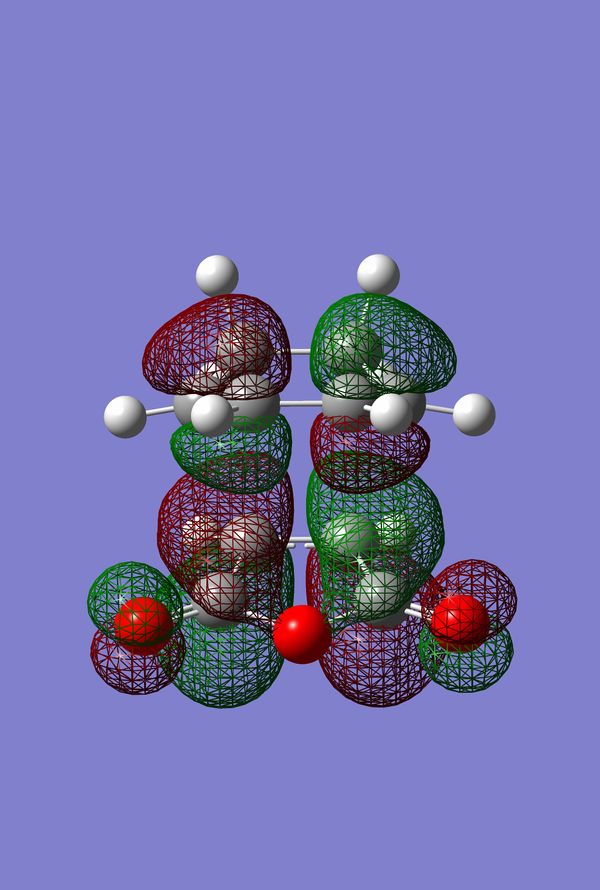
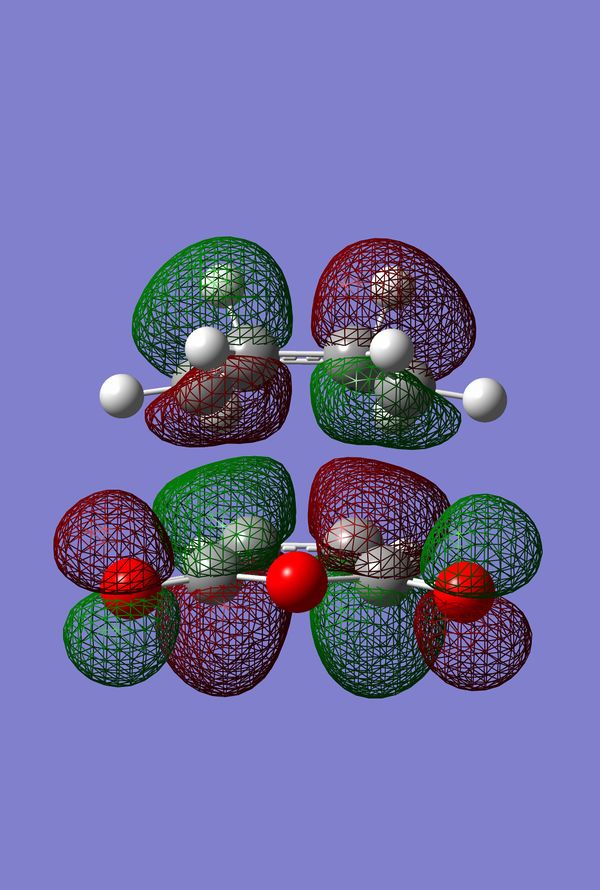
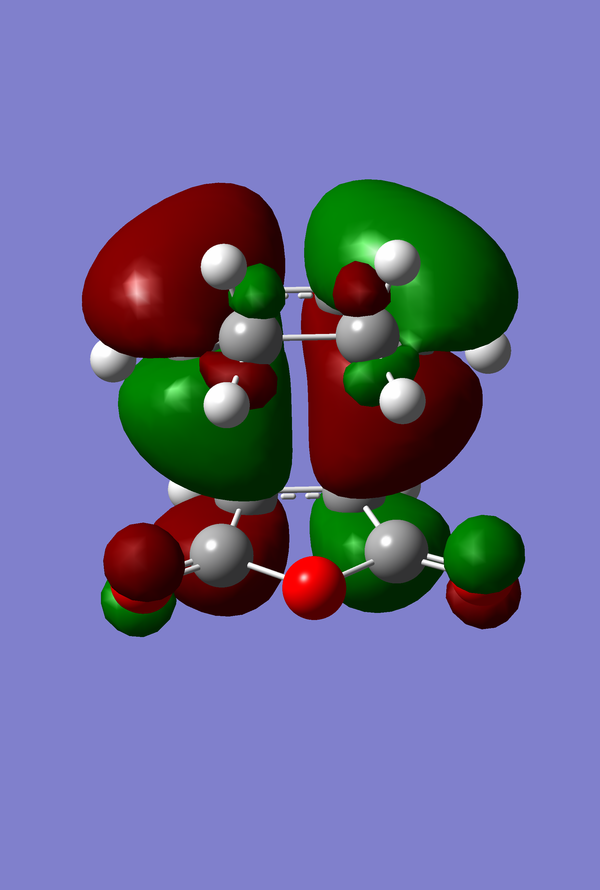
IRC of Exo and Endo Transition States
On performing IRC calculations on both the exo and endo transition states and optimisation of the final step in the IRC the energies of the endo and exo products were compared. It was observed that the exo product was lower in energy by 1.62235 kcal/mol. Thus another feature of the PES for the reaction has been elucidated. The exo product lies lower in energy on the PES relative to the endo product. This confirms the statement above that the endo product is the product observed for reaction conditions corresponding to kinetic control and that the exo product corresponds to the product observed when the reaction is under thermodynamic control.
| Structure | Energy following B3LYP/6-31G* optimisation (Hartrees) | Relative Energy (kcal/mol) |
| Endo | -605.71873547 | 1.62235 |
| Exo | -605.72132085 | 1.62235 |
Activation Energies
The activation energies of the Diels-Alder reaction between maleic anhydride and cyclohexa-1,3-diene were calculated at the AM1 and B3LYP/6-31G* levels of theory and the results compared against experiment 25. It may be observed that the B3LYP/6-31G* calculations yield much better agreement with the experimental literature values. Once again this observation can be attributed to the higher accuracy displayed by methods which rely on a smaller set of approximations.
| Structure | AM1 Sum of Electronic and Thermal Energies at 298.15 K (Hartrees) | Activation Energy (kcal/mol) | B3LYP/6-31G* Sum of Electronic and Thermal Energies at 298.15 K | Activation Energy (kcal/mol) | Experimental Activation Energy (kcal/mol) |
| Maleic Anhydride | -0.058192 | - | -379.228471 | - | 11.4 |
| 1,3-cyclohexadiene | 0.157034 | - | -233.288623 | - | 11.4 |
| Endo Transition Structure | 0.143685 | 28.13938609 | -612.491836 | 15.84962232 | 11.4 |
| Exo Transition Structure | 0.144882 | 28.89051436 | -612.487664 | 18.46758987 | 11.4 |
AM1 - Neglected Factors?
Before concluding with an analysis of the results obtained by calculations using the AM1 semi-empirical method it should be stated that this level of theory suffers from a series of drawbacks. AM1 is known to predict alkyl groups to be too stable. It is also known to vastly underestimate the rotational barriers for bonds which possess some double bond character. A prime example of this type of neglect being in the butadiene molecule where the barrier is misrepresented by a value of approximately 20 kJ/mol 1. Van der Waals interactions are often poorly predicted and although hydrogen bonds have strengths that are often comparable to experimental results, the geometry is often represented incorrectly. It is possible that one of these limitations was responsible for the failure to procure a secondary orbital effect in the HOMO of the endo transition structure for the final Diels-Alder adduct. On examining the literature however, there would seem to be some dispute as to whether or not secondary orbital effects are indeed responsible for the preference of the endo transition state 24 . It could very well be the case that van der Waals forces are instead responsible for the relative energies and that in fact the computations are consistent with this theory. The topic remains an open-ended discussion.
Conclusions
The mechanisms of the Cope Rearrangement as well as various forms of Diels-Alder reaction were investigated using the Gaussian program. Various levels of theory were implemented throughout the experiment with the results predicted by each often showing pointed differences. In general the B3LYP/6-31G* level of theory was most accurate at reproducing experimental values such as activation energies. Minima and Transition structures were identified on the PES of the Cope Rearrangement and were characterised by the presence of solely positive frequencies in the case of minima and the presence of an imaginary frequency in the case of a transition structure. In the case of the latter the imaginary frequency obtained was animated in each case in order to ensure that the structure found did indeed correspond to a transition structure. Challenges were encountered in the attempts to find the secondary orbital effect in the final Diels-Alder reaction. Such a failure on the part of both the AM1 and B3LYP/6-31G* levels of theory makes a strong case for the use of qualitative MO methods in explaining chemical reactivity. Although these computational techniques are very good at calculating numerical parameters, it is often difficult when using them to gain insight into facets of chemical reactivity that can be readily applied in a principled manner to similar reactions. It is with respect to such a reaction that a qualitative approach may thrive. Future work could include the examination of Diels-Alder reactions with a wider variety of diene and dienophile compounds 26. Such a survey could potentially show up areas of improvement for the theories used in this experiment with regard to the treatment of molecular orbitals.
References
1. F. Jensen, Introduction to Computational Chemistry, Wiley, Chichester, United Kingdom, 2nd edn., 2007.
2. M. J. Bearpark, A. Simperler, 'Lecture 1: Calculating Molecular Geometries', QM3 Quantum Mechanics 3/Core 3rd Year Computational Chemistry Laboratory, 14/10/2014, Imperial College London, 2014.
3. M. J. Bearpark, A. Simperler, 'Lecture 3: Calculating Energies: Methods/Basis Sets/Spin States', QM3 Quantum Mechanics 3/Core 3rd Year Computational Chemistry Laboratory, 21/10/2014, Imperial College London, 2014.
4. Gaussian 09 User's Reference, http://www.gaussian.com/g_tech/g_ur/m_basis_sets.htm, (accessed November 2014).
5. Basis Set Exchange, https://bse.pnl.gov/bse/portal, (accessed December 2014).
6. A. C. Cope, E. M. Hardy, J. Am. Chem. Soc, 1940, 62(2), 441-444.
7. R. B. Woodward, R. Hoffmann, Angew. Chem. Int. Ed., 1969, 8(11), 781-932.
8. W. von Doering, V. G. Toscano, G. H. Beasley, Tetrahedron, 1971, 27, 5299-5306.
9. W. von Doering, W. R. Roth, Tetrahedron, 1962, 18, 67-74.
10. O. Wiest, K. A. Black, K. N. Houk, J. Am. Chem. Soc., 1994, 116, 10336-10337.
11. W. von Doering, Proc. Natl. Acad. Sci. USA., 1981, 78, 5279-5283.
12. J. S. Binkley, J. A. Pople, W. J. Hehre, J. Am. Chem. Soc., 1980, 102, 939-947.
13. B. G. Rocque, J. M. Gonzales, H. F. Schaeffer III, Mol. Phys., 2002, 100(4), 441-446.
14. Y. Umezawa, S. Tsuboyama, H. Takahashi, J. Uzawa, M. Nishio, Tetrahedron, 1999, 55, 10047-10056S.
15. K. B. Widberg, M. A. Murcko, J. Am. Chem. Soc., 1988, 110, 8029-8038.
16. G. Schultz, I. Hargittai, J. Mol. Struct., 1995, 346, 63-69.
17. B. W. Gung, Z. H. Zhu, R. A. Fouch, J. Am. Chem. Soc., 1995, 117(6), 1783-1788.
18. H. P. Hratchian, X. Li, J. Chem. Theory. Comput., 2012, 8(12), 4853-4855.
19. M. J. Bearpark, A. Simperler, 'Lecture 2: Reaction Mechanisms and Barriers', QM3 Quantum Mechanics 3/Core 3rd Year Computational Chemistry Laboratory, 16/10/2014, Imperial College London, 2014.
20. F. H. Allen, O. Kennard, D. G. Watson, L. Brammer, A. G. Orpen, R. Taylor, J. Chem. Soc., Perkin Trans. 2, 1987, S1-S19.
21. R. S. Rowland, R. Taylor, J. Phys. Chem., 1996, 100(18), 7384-7391.
22. D. Rowley, H. Steiner, Discuss. Faraday Soc. 1951, 10, 198-213.
23. E. Goldstein, B. Beno, K. N. Houk, J. Am. Chem. Soc., 1996, 118, 6036-6043.
24. Y. Kobuke, T. Sugimoto, J. Furukawa, T. Fueno, J. Am. Chem. Soc., 1972, 94(10) 3633-3635.
25. R. A. Grieger, C. A. Eckert, J. Am. Chem. Soc., 1970, 92(24), 7149-7153.
26. K. Afarinkia, M. J. Bearpark, A. Ndibwami, J. Org. Chem., 2003, 68, 7158-7166.
27. Gaussian 09 User's Reference, http://www.gaussian.com/g_tech/g_ur/m_modelchem.htm, (accessed November 2014).
28. M. Bearpark, F. Bernardi, M. Olivucci, M. A. Robb, J. Am. Chem. Soc., 1990, 112, 1732-1739.
29. Gaussian 09 User's Reference, http://www.gaussian.com/g_tech/g_ur/k_dft.htm, (accessed November 2014).
30. M. J. Bearpark, A. Simperler, 'Lecture 4: Orbitals and Bonding', QM3 Quantum Mechanics 3/Core 3rd Year Computational Chemistry Laboratory, 24/10/2014, Imperial College London, 2014.
31. F. Sousa, P. A. Fernandes, M. J. Ramos, J. Phys. Chem. A., 2007, 111, 10439-10452.
32. M. J. S. Dewar, S. Olivella, J. J. P. Stewart, J. Am. Chem. Soc., 1986, 108, 5771-5779.
33. M. J. S. Dewar, E. G. Zoebisch, E. F. Healy, J. J. P. Stewart, J. Am. Chem. Soc. 1985, 107, 3902-3909.
