Rep:Mod:pag1234
NH3 molecule
Optimisation Results
Calculation Method: RB3LYP
Basis Set: 6-31G(d.p)
Final Energy: -56.55776873 a.u.
RMS Gradient: 0.00000485
Point Group: C3v
Bond Angle: 109.471o
Optimized N-H bond length 1.01798 Å
         Item               Value     Threshold  Converged?
 Maximum Force            0.000004     0.000450     YES
 RMS     Force            0.000004     0.000300     YES
 Maximum Displacement     0.000072     0.001800     YES
 RMS     Displacement     0.000035     0.001200     YES
Ammonia |
The optimisation file is liked to here
Frequency Analysis
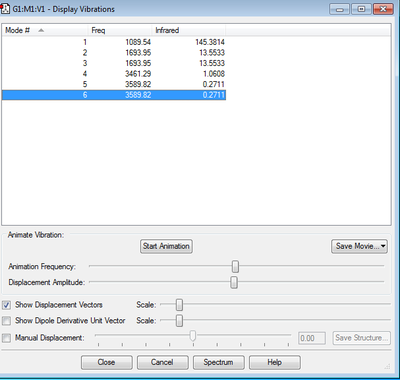
How many modes do you expect from the 3N-6 rule? Expect 6 Vibrational Modes from the 3N-6 rule.
Which modes are degenerate (ie have the same energy)? Modes 2,3 and 5,6 are degenerate
Which modes are "bending" vibrations and which are "bond stretch" vibrations? Bending Vibrations: 1, 2, 3 Stretching Vibrations: 4, 5, 6
Which mode is highly symmetric? 4 is highly symmetric
One mode is known as the "umbrella" mode, which one is this? 1 is the umbrella mode. It causes the greatest change in dipole moment and hence has the strongest peak.
How many bands would you expect to see in an experimental spectrum of gaseous ammonia? 2 bands expected in an experimental spectrum as the last three modes have very low intensities. This is because the change in dipole moment caused by these modes is very little.
Charge Distribution
Charge on N: -1.125e
Charge on H: 0.375e
This is expected due to the difference in electronegativity of N and H, N being more electronegative.
N2 molecule
Optimisation Results
Calculation Method RB3LYP
Basis Set 6-31G(d.p)
Final Energy -109.52412868
RMS Gradient 0.00000134
Point Group Dh
Bond length: 1.10550 Å
         Item               Value     Threshold  Converged?
 Maximum Force            0.000002     0.000450     YES
 RMS     Force            0.000002     0.000300     YES
 Maximum Displacement     0.000001     0.001800     YES
 RMS     Displacement     0.000001     0.001200     YES
Nitrogen |
The optimisation file is liked to here
Frequency Analysis
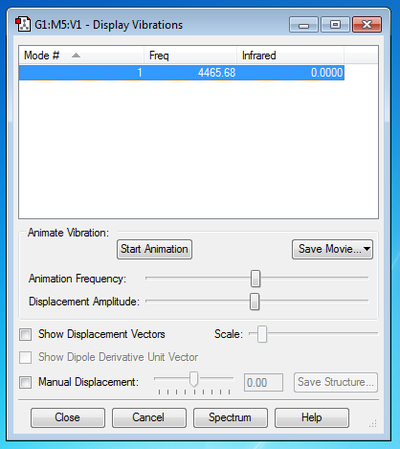
How many modes do you expect from the 3N-5 rule? Expect 1 Vibrational Mode from the 3N-5 rule
Which modes are degenerate (ie have the same energy)? Only 1 mode present.
Which modes are "bending" vibrations and which are "bond stretch" vibrations? Bending Vibrations: None Stretching Vibrations: 1
Which mode is highly symmetric? 1
One mode is known as the "umbrella" mode, which one is this? None
How many bands would you expect to see in an experimental spectrum of gaseous Nitrogen? 0
Charge Distribution
Charge on N: 0e
No difference in electronegativity and hence 0 charge.
H2 molecule
Optimisation Results
Calculation Method RB3LYP
Basis Set 6-31G(d.p)
Final Energy -1.17853936
RMS Gradient 0.00000017
Point Group Dh
Bond Length: 7.4279 Å
 Item               Value     Threshold  Converged?
 Maximum Force            0.000000     0.000450     YES
 RMS     Force            0.000000     0.000300     YES
 Maximum Displacement     0.000000     0.001800     YES
 RMS     Displacement     0.000001     0.001200     YES
Hydrogen |
The optimisation file is liked to here
Frequency Analysis
How many modes do you expect from the 3N-5 rule? Expect 1 Vibrational Mode from the 3N-5 rule
Which modes are degenerate (ie have the same energy)? Only 1 mode present.
Which modes are "bending" vibrations and which are "bond stretch" vibrations? Bending Vibrations: None Stretching Vibrations: 1
Which mode is highly symmetric? 1
One mode is known as the "umbrella" mode, which one is this? None
How many bands would you expect to see in an experimental spectrum of gaseous hydrogen? 0
Charge Distribution
Charge on H: 0e
No difference in electronegativity and hence 0 charge.
Reaction Energies
   E(NH3)= -56.55776873 a.u
   2*E(NH3)= -113.1155375 a.u
   E(N2)=  -109.52412868 a.u
   E(H2)= -1.17853936 a.u
   3*E(H2)= -3.53561808 a.u
   ΔE=2*E(NH3)-[E(N2)+3*E(H2)]= -10.05579074 a.u= -146.4785879 kJ mol -1
Ammonia is more stable than the reactants due to the negative total energy of the reaction (exothermic).
Literature Value Comparison
The found energy corresponds to 2 moles of ammonia and so the energy for 1 is -73.24 kJmol-1. This is significantly larger then the literature value of -45.95 kJmol-1 [1]. This discrepancy is due to the difference in the method utilized to calculate these values. Whilst one method (computational) makes use of quantum theory and is purely mathematically based, the literature value is an experimental one and is the physically observed value.
Molecule of Choice: CN-
Optimisation
Calculation Method: RB3LYP
Basis Set: 6-31G(d.p)
Final Energy: -92.82453153 a.u.
RMS Gradient: 0.00000704
Point Group: Cinfv
Dipole moment: 0.5236 Debye
Bond Length: 1.18409 Å
        Item               Value     Threshold  Converged?
 Maximum Force            0.000012     0.000450     YES
 RMS     Force            0.000012     0.000300     YES
 Maximum Displacement     0.000005     0.001800     YES
 RMS     Displacement     0.000008     0.001200     YES
Cyanide |
The optimisation file is liked to here
Frequency analysis
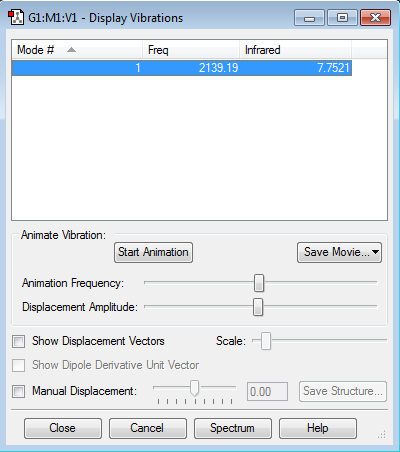
How many modes do you expect from the 3N-5 rule? Expect 1 Vibrational Mode from the 3N-5 rule
Which modes are degenerate (ie have the same energy)? Only 1 mode present.
Which modes are "bending" vibrations and which are "bond stretch" vibrations? Bending Vibrations: None Stretching Vibrations: 1
Which mode is highly symmetric? 1
One mode is known as the "umbrella" mode, which one is this? None
How many bands would you expect to see in an experimental spectrum of Cyanide ion? 1
Charge
C: -0.246 e
N: -0.754 e
This is expected as the electronegativity of Nitrogen (3.04) is more than that of Carbon (2.55).
Orbital Diagram Flow Chart
 This shows the energy levels of the MO and also the electron occupancy.
1s Orbitals
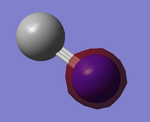
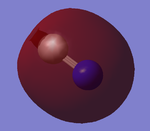
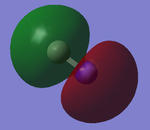
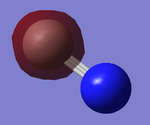 The images to the left correspond to 1 and 2 respectively as per the above flow chart. The AO contributing to make the MO are the 1s from C and N. MO on the left shows electron density close to Nitrogen while the MO on the right shows electron density close to Carbon hence both show no interaction between the AOs and are therefore non-bonding. 1 is deeper in energy than 2 as Nitrogen is more electronegative than Carbon. Both the MOs are occupied and completely filled.
2s Orbitals
The images above correspond to 3 and 4 on the Orbital Diagram respectively. The image on the left is the bonding 2sσg while the image on the right is antibonding 2sσ*g. The contributing AO to both are the 2s orbitals on Carbon and Nitrogen and the produced MO are occupied.
2p Orbitals
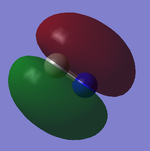
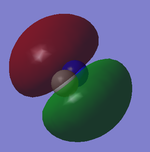 The two images correspond to 5 and 6 on the orbital diagram and are degenerate. The contributing AOs to the produced MOs are the 2py and 2pz of both Nitrogen and Carbon. The produced MOs have the same symmetry labels and are bonding 1πu. Both MOs are occupied.
3s Orbital
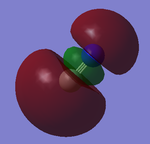 The image shows the bonding 3sσg MO composed of the 2px AO of Carbon and Nitrogen. It is an occupied MO and corresponds to 7 in the orbital flow chart. This MO is higher in energy than 5 and 6 despite being a sigma bond. This is because the MO corresponding to 5 and 6 are the result of mixing and hence are lower in energy. This MO is also the HOMO.
References
- ↑ Cox, J.D.; Wagman, D.D.; Medvedev, V.A., CODATA Key Values for Thermodynamics, Hemisphere Publishing Corp., New York, 1984, 1.

