Rep:Mod:pHenOM
Module 2: Bonding (Ab Initio and Density Functional Molecular Orbital)
All calculations are carried using the Gaussian 9.0/Gaussview 5.0 Suite, whether on laptop or submitted to the Imperial SuperComputerAtNight (SCAN). Absolute energies are reported in atomic units (a.u.) to 4d.p., and relative energies in kJ mol-1 to the nearest whole integer. The conversion factor used to calculate relative energies is 1a.u. = 2625.50kJ mol-1. Bond lengths are reported in Angstroms (Å) to 2d.p., and bond angles in degrees to 1d.p. Vibration frequencies are reported in wavenumbers (cm-1) to the nearest whole integer, and intensities of IR peaks in arbitrary units to the nearest whole number.
BH3 and TlBr3: Optimisation, Analysis and Interpretation
BH3
The trigonal planar BH3 molecule was created in Gaussview, and in creating a pre-optimised structure, the B-H bonds were set to 1.50Å. The optimisation was carried out on the laptop, using the following key commands for the calculation:
| Method: DFT-B3LYP |
| Basis Set: 3-21G |
| Type: OPT (optimisation) |
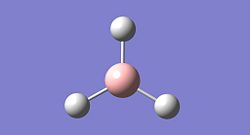
It should be noted that 3-21G as a basis set has a very low accuracy, however it will result in a quick calculation, making it an ideal choice of basis set for laptop calculations. The optimised structure, as a JPEG and JMol file, is shown below:

|
Analysing the optimised structure, it is found that the the optimised B-H bond length is 1.19Å, and the optimised H-B-H bond angle is 120.0°.
A Summary of important information concerning the calculation can be obtained following the calculation:
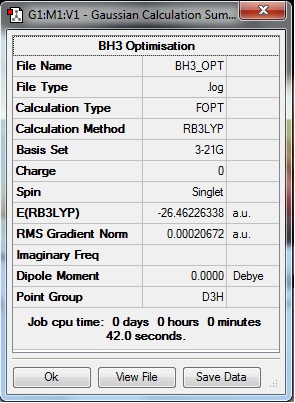
One key piece of information pertaining to a successful optimisation is the value of the RMS Gradient Norm; if the value is <0.001, then the optimisation can be confirmed as successful. Here it can be seen that with a value of 0.00020672a.u., the optimisation of BH3 was a success. However, looking at the Summary only give specific pieces of information, and there are many pieces of data resulting from the calculation that Gaussview cannot display; these are found in the output text-based .log file (also .chk file). (The input file in this case is the .gjf file created before submission for calculation.) In particular, it can be confirmed whether the optimisation 'job' has really converged to an optimised structure, by checking the Maximum/RMS Force and Maximum/RMS Displacement Items in the .log file. If these all have 'YES' in response to the 'Converged?' column, then the optimisation has converged. This can be confirmed to be true for the BH3 molecule that has been optimised by viewing the above URL link to the .log file, and will be confirmed for all future molecules that are optimised.
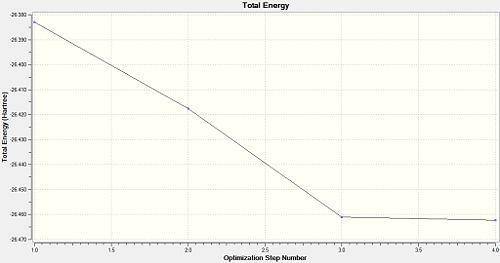
The optimisation of any molecule by Gaussian proceeds as a series of steps, which change the atom co-ordinates and then solve the Schrödinger equation to find the energy of the molecule; this is then repeated for different atom co-ordinates, and this proceeds in a direction towards the lowest energy, or optimised structure. This can be seen by viewing a profile of the energy and gradient of the energy as the optimisation proceeds. Below are those graphs for BH3:
 |
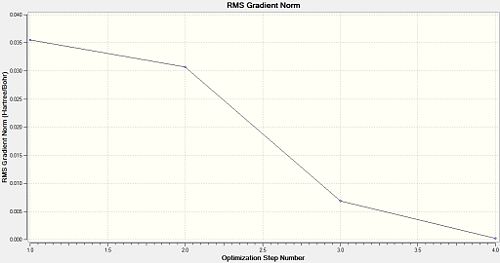 |
It can be seen that after 4.0 steps does the optimisation reach completion; the energy is at a minimum, and the gradient of the energy is zero. When discussing the gradient, the slope of the total energy profile of the molecule as the atom co-ordinates are changed, is being considered. If the slope is zero, it means a stationary point in the energy profile has been found; this can be a minimum or a maximum in energy, and which one it is is confirmed by Frequency Analysis (see later). The structures of the BH3 molecule as it undergoes each step in its optimisation can be viewed as well:
 |
 |
 |
 |
| 1.0 | 2.0 | 3.0 | 4.0 |
Notice that the B-H 'bond' lengths get shorter as the optimisation proceeds, showing the well-placed usage of 1.50Å as a starting point for convergence. More importantly, for steps 1.0 and 2.0, there are no B-H bonds! (hence 'bond' used hitherto) This is only due to the fact that Gaussview has a pre-defined set of bond lengths for specific atoms, and if these aren't met, it doesn't draw in the bonds. This is typically a problem for inorganics and TM compounds than organics. However, it is known that the bonds exist, so these errors are ignored here. A bond can be defined as a type of attraction between atoms. It can have strong or weak bonds. The graphical representation of bonds is used for the convenience of ‘strong’ bonds, but is not always used, e.g.dipole-dipole interactions.
Now that the optimised structure has been obtained, the quantitative/computed MO's can be viewed. This is done by submitting the following calculation with key commands, created from the .chk file output from the optimisation of BH3:
| Method: DFT-B3LYP |
| Basis Set: 3-21G |
| Type: Energy |
| Additional keywords: pop=full |
| NBO Tab: Full NBO |
Here is the calculation computing the MO's and producing a completed population analysis for allowing a Natural Bond Orbital Analysis (NBO) (see below): DOI:10042/to-6602
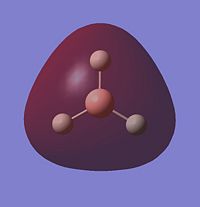
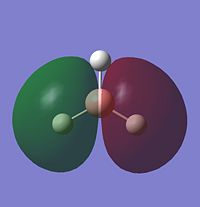
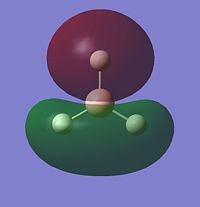
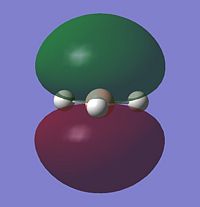
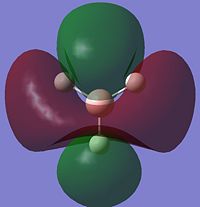
Looking at the occupied and lowest energy unoccupied orbitals (inc. HOMO and LUMO), the following MO's are visualised:
 |
 |
 |
 |
 |
 |
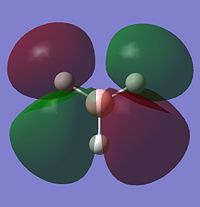 |
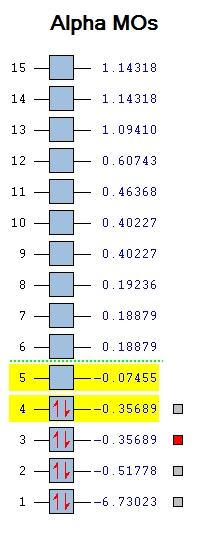
Most of the MO's are symmetrical, indicating that the computed MO analysis has worked. As can be seen from the MO energy level diagram, MO's 1-4 are all occupied, and 5-7 are unoccupied. The lowest energy unoccupied MO's only are visualised as they can get very complex at higher energies, and in general the unoccupied MO's are more diffuse than the occupied ones.
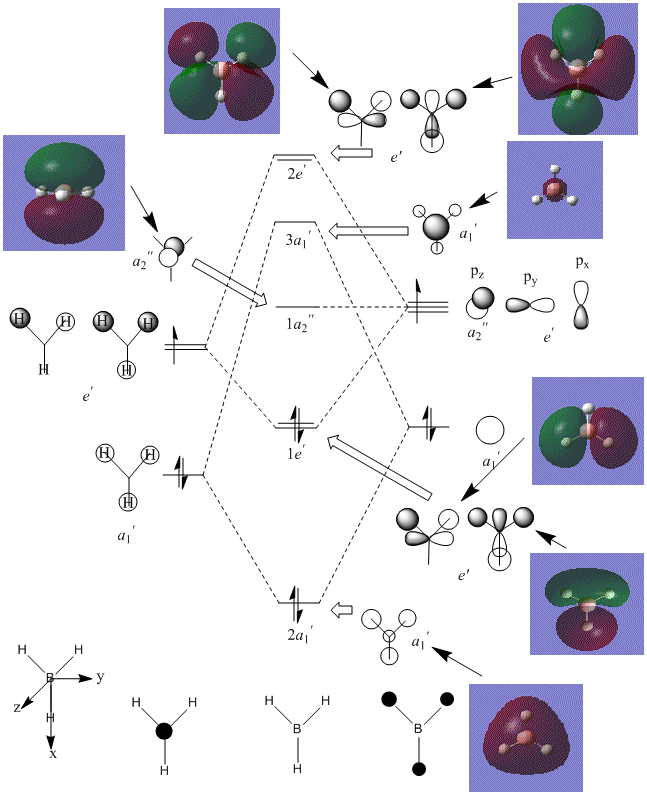
The above diagram shows that the LCAO MO's are localised to the atoms, and still retain the atomic orbital representations, without showing the effect of combining the AO's. The "real" MO's are delocalised over the whole molecule, and fully show the "mixing" of the AO's to form the MO's. This tells us that the qualitative LCAO method doesn't accurately show the distribution of electron density over the whole molecule, however shows a pathway to generating them by visualising what needs to be combined to generate the MO's, and provides a useful simplified approximation.
In analysing the optimised structure, an NBO analysis can also be carried out. This involves taking the delocalised MO picture and turning it back into the 2e-2c bonding type. The NBO analysis can be viewed in a few ways; one is by looking at the distribution of electron density among the bonds by the resultant atomic charges.
 |
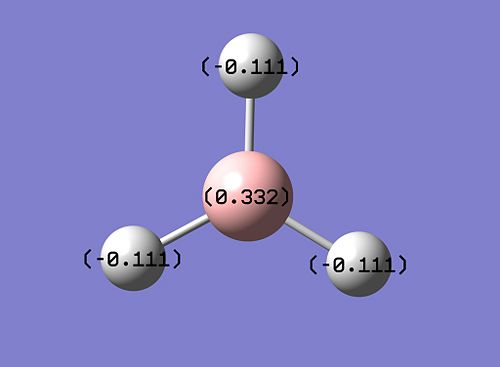 |
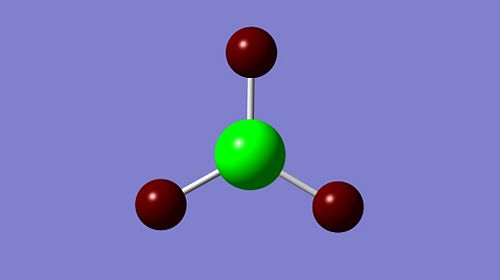
As can be seen above, the bright green B centre indicates highly positive charge, and the deep red H atoms indicate highly negative charge; this is well in accordance with the Lewis deficiency of the central B. This charge distribution is proved quantitatively by the atomic charge values above as well.
Another way of viewing the NBO analysis involves viewing the .log output file of the population analysis to see the bonding contributions in more detail. The .log file also contains the full atomic charge values, interactions between bonding MO's and non-bonding/antibonding MO's, and a summary of the energy/population of the bonds and any lone pairs (which are starred '*'); however we are interested in the following section:
(Occupancy) Bond orbital/ Coefficients/ Hybrids
---------------------------------------------------------------------------------
    1. (1.99853) BD ( 1) B   1 - H   2
               ( 44.48%)   0.6669* B   1 s( 33.33%)p 2.00( 66.67%)
                                           0.0000  0.5774  0.0000  0.0000  0.0000
                                           0.8165  0.0000  0.0000  0.0000
               ( 55.52%)   0.7451* H   2 s(100.00%)
                                           1.0000  0.0000
    2. (1.99853) BD ( 1) B   1 - H   3
               ( 44.48%)   0.6669* B   1 s( 33.33%)p 2.00( 66.67%)
                                           0.0000  0.5774  0.0000  0.7071  0.0000
                                          -0.4082  0.0000  0.0000  0.0000
               ( 55.52%)   0.7451* H   3 s(100.00%)
                                           1.0000  0.0000
    3. (1.99853) BD ( 1) B   1 - H   4
               ( 44.48%)   0.6669* B   1 s( 33.33%)p 2.00( 66.67%)
                                           0.0000  0.5774  0.0000 -0.7071  0.0000
                                          -0.4082  0.0000  0.0000  0.0000
               ( 55.52%)   0.7451* H   4 s(100.00%)
                                           1.0000  0.0000
    4. (1.99903) CR ( 1) B   1           s(100.00%)
                                           1.0000  0.0000  0.0000  0.0000  0.0000
                                           0.0000  0.0000  0.0000  0.0000
    5. (0.00000) LP*( 1) B   1           s(100.00%)
What this in effect shows is the contributions by each atom to the Bonds (BD), Core (CR), and Lone Pair (LP) electrons. From the above text, it can be derived that for the three B-H bonds, 44.48% of the electron density comes from the B atom, and 55.52% comes from the H atom. The B atom's contribution to each B-H bond has sp2 hybridisation (33.33%s & 66.67%p), while the H's contribution is 100.00%s. This means the B has three sp2 hybrid orbitals involved in bonding with the three H sAO. The LP is starred because it formally occupies 100.00% an sAO on the B atom.
Another important analysis that can be carried out on a fully optimised structure is a Frequency Analysis. This shows whether or not the stationary point found on the energy profile (where the Gradient = 0) is a minimum or a maximum. If all the frequencies are positive, a minimum has been obtained, which is what is wanted. It also shows the IR spectrum and vibrational modes of the molecule. The frequency analysis was carried out using the following key commands within the input .gjf file:
| Method: DFT-B3LYP |
| Basis Set: 3-21G |
| Type: Frequency |
| Additional keywords: pop=(full,nbo) |
Here is the frequency analysis calculation: DOI:10042/to-6626
The Summary file of this frequency analysis shows the same absolute energy as that of the optimisation Summary of BH3, -26.46226338a.u. Thus the frequency analysis is on the same optimised molecule.
Below are the "real" normal modes of vibration; the "low" or "zero" frequencies are those that represent the translational and rotational modes, and are normally ±10cm-1 of zero. In this case, the highest magnitude one is (-)67cm-1, which is okay though as the lowest energy "real" vibration is 1144cm-1, which is more than an order of magnitude below. The reason the ±10cm-1 rule doesn't apply here is because such a low level basis set (3-21G) has been used and is not very accurate.

| Mode # | Animated Vibration | Frequency/cm-1 | Intensity | Symmetry D3h point group | |||
|---|---|---|---|---|---|---|---|
| 1 |
|
1144 | 93 | A" | |||
| 2 |
|
1204 | 12 | E' | |||
| 3 |
|
1204 | 12 | E' | |||
| 4 |
|
2598 | 0 | A' | |||
| 5 |
|
2737 | 104 | E' | |||
| 6 |
|
2737 | 104 | E' |
All 6 "real" vibrations are positive; this indicates indeed that the optimised geometry is a minimum in the energy profile, and therefore the most stable geometry. In the IR spectrum, based on the 3N-6 vibrational modes rule for non-linear molecules such as BH3, 6 peaks representing the 6 vibrations are expected. However, there are only 3. This is due to a) the overlapping frequency values of vibrations 2/3 and 5/6, and b) vibration 4 has no overall change in dipole moment, therefore it is not an IR-active stretch (requires an asymmetric change), and so isn't shown on the IR spectrum.
TlBr3
The trigonal planar TlBr3 molecule was created in Gaussview, and in creating a pre-optimised structure, the symmetry of the molecule was restricted to D3h, and the tolerance to 'very tight (0.0001)'. The optimisation was carried out on the laptop, using the following key commands for the calculation:
| Method: DFT-B3LYP |
| Basis Set: LANL2DZ |
| Type: OPT (optimisation) |
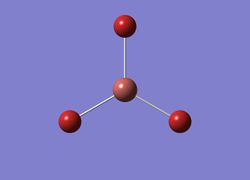
It should be noted that LANL2DZ is a medium level basis set, using D95V on 1st row atoms and Los Alamos ECP (a pseudo-potential, that models the core electrons in such a way as to make the calculations easier for large atoms with lots of electrons in its electronic configuration). This allows the calculation to better model the more complex system, without drawing too much on computational resources. The optimised structure, as a JPEG and JMol file, is shown below:
|
Analysing the optimised structure, it is found that the the optimised Tl-Br bond length is 2.65Å (lit. 2.56Å), and the optimised Br-Tl-Br bond angle is 120.0° (lit. 120.0°)[1]. Comparing these values, the optimisation has proved fairly successful, as the Br-Tl-Br bond angles match exactly, and the difference in Tl-Br bond lengths (0.09Å) is not too large to question the optimisation and its method/basis set.
A Summary of important information concerning the calculation can be obtained following the calculation:
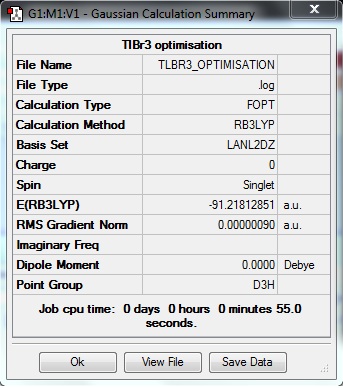
A frequency analysis was carried out to confirm the optimised structure of TlBr3 is a minimum in the energy profile; this is proven by all "real" vibrations being positive:
| Method: DFT-B3LYP |
| Basis Set: LANL2DZ |
| Type: FREQ (frequency) |
| Additional Keywords: pop=(full,nbo) |
The same method and basis set have been used for the frequency analysis as for the optimisation beacause the optimised structure is being tested to see if it is a minimum. The "low" frequencies, as explained in the BH3 section, are the '-6' of the 3N-6 vibrational modes of non-linear molecules. They represent the translational and rotational modes of the molecule, and are:
| 3 | 0 | 0 | 0 | 4 | 4 |
The lowest "real" normal mode is 46cm-1(Intensity = 4; Symmetry = E'). All the "real" frequencies were positive, indicating that the optimised geometry of TlBr3 is indeed a minimum. DOI:10042/to-6635
Cis and Trans Isomerism: Mo(CO)4L2, an Organometallic Complex
This section involves looking at the geometrical isomers of the named organometallic complex to compare which one is more stable, and as there are C=O groups present, to find out the vibrational modes of both isomers, and see how isomerism affects the vibrational spectra. The L group in the synthesised complex is usually PPh3, however due to the large computational cost in modelling phenyl groups, these Ph groups are replaced by the electronically similar Cl atoms, which don't require as much computational cost.
Optimisation
Initially, the ground state structures of the cis and trans isomers were initially optimised using:
| Method: DFT-B3LYP |
| Basis Set: LANL2MB (low level) |
| Type: OPT (optimisation) |
| Additional Keywords: opt=loose |
"Loose" convergence is used here to allow the calculation to converge, as otherwise the convergence limits would be more accurate than the basis set used, and so would likely never converge. The optimised structures are below:
 |
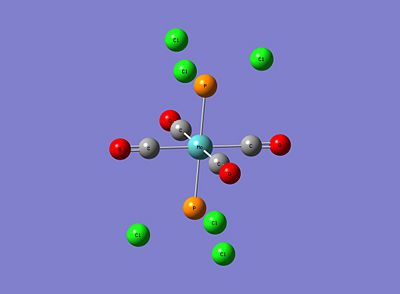 |
As can be seen, for both isomers the P-Cl bonds have disappeared! However, this is just due to the strict limits Gaussview has on defining a bond and subsequently drawing it. Although these structures sufficiently correct bond lengths and bond angles, this low level optimisation doesn't specify correctly the dihedral angles and in particular the P-Cl3 group rotations. This initial optimised result not being truly lowest in energy can be explained by the idea of metastable minima; that beginning the optimisation at an incorrect starting point on the energy profile can lead to finding a minimum that isn't the lowest energy minimum. Therefore, in order to find the lowest energy minima, new starting points will be defined for both isomers. These are below:
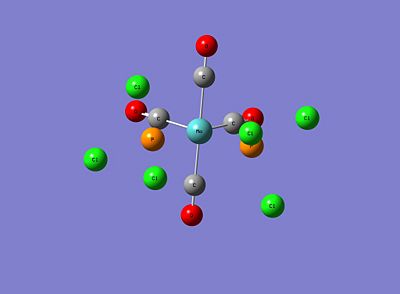 |
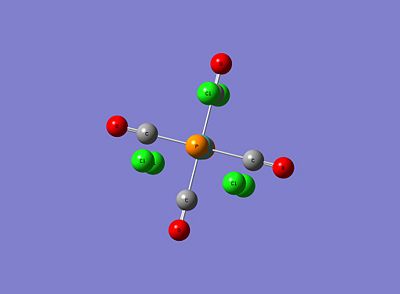 |
It can be clearly seen that for the cis isomer, the Cl of one group points up parallel to the axial bond, while the Cl of the other group points downwards, thus creating a torsion angles of 0.0° and 180.0° respectively, with respect to the axial Mo-CO bond. For the trans isomer, both PCl3 groups are eclipsed, and one Cl of both groups lies parallel to a Mo-CO bond.
Having obtained these new geometries, the optimisation is repeated thus:
| Method: DFT-B3LYP |
| Basis Set: LANL2DZ |
| Type: OPT (optimisation) |
| Additional Keywords: int=ultrafine scf=conver=9 |
N.B LANL2DZ as opposed to MB; DZ = double zeta, and is a much better basis set and pseudo potential than MB, or minimal basis option. Using a better basis set requires tighter convergence criteria, hence the new additional keywords.
The optimised structures are below:
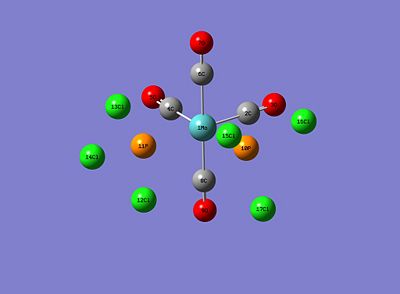
|

|
Frequency Analysis
Frequency Analyses were carried out for both isomers to determine their optimised structures are minima and not transition states. It was also carried out to observe and compare their vibrational modes. Both isomers were submitted for the calculation with the following key commands:
| Method: DFT-B3LYP |
| Basis Set: LANL2DZ |
| Type: OPT (optimisation) |
| Additional Keywords: int=ultrafine scf=conver=9 |
N.B. the additional keywords are retained here. The frequency analysis must be carried out with exactly the same method and basis set as the optimistaion carried out previously.
The calculation for the cis isomer is DOI:10042/to-6762 , and that for the trans isomer is DOI:10042/to-6763 . In the next section the vibrational modes for both isomers are tabulated and discussed.
Discussion
Structures
Below is a list of relevant geometric parameters, taken from the optimised geometries of both isomers, and experimental literature values. It should be noted that in reference to the literature for both isomers, we're substituting the Cl's back for Ph's, as the Cl complex isn't available but the Ph complex can provide similar geometric parameters. It should also be noted that for the trans isomer, the Cr version of the complex was only found; hence any bond values involving the Cr were adjusted via covalent radii so as to assume a Mo atom replacing the Cr (Cr = 139pm, Mo = 154pm, therefore 15pm added to the literature values):
| Optimised Geometries | Experimental Literature[2] | |
|---|---|---|
| Mo-P(average) | 2.51 | 2.58 |
| Mo-2C/4C (average) | 2.01 | 1.97 |
| Mo-6C/8C (average) | 2.06 | 2.04 |
| P-Cl (average) | 2.24 | N/A |
| C=O (average) | 1.17 | 1.15 |
| P-Mo-P | 94.2 | 104.6 |
| 11P-Mo-4C or 10P-Mo-2C (average) | 89.4 | 80.6 |
| 11P-Mo-2C or 10P-Mo-4C (average) | 176.1 | 163.7 |
| 2C-Mo-4C | 87.1 | 83.0 |
| 6C-Mo-8C | 178.3 | 174.1 |
| 2C/4C-Mo-6C/8C (average) | 89.7 | N/A |
| Optimised Geometries | Experimental Literature[3] | |
|---|---|---|
| Mo-P(average) | 2.44 | 2.51 |
| Mo-6C/4C (average) | 2.06 | 2.02 |
| Mo-2C/8C (average) | 2.06 | 2.02 |
| P-Cl (average) | 2.24 | N/A |
| C=O (average) | 1.17 | 1.15 |
| P-Mo-P | 177.4 | 176.7 |
| 10P/11P-Mo-4C/6C (average) | 90.0 | 91.6 |
| 10P/11P-Mo-2C/8C (average) | 88.7 | 90.4 |
| 4C-Mo-6C | 179.0 | 174.2 |
| 2C-Mo-8C | 180.0 | 175.9 |
| 4C/6C-Mo-2C/8C (average) | 89.5 | 88.2 |
Comparing the optimised geometry values to the literature, most of the bond lengths agree to a certain extent, although for the cis isomer the bond angles differ quite largely (especially those involving the P atom); the reverse is true for the trans isomer, where the bond angles including the P atom agree quite well with the literature. Comparing the cis and trans isomers, the Mo-P bond length is longer for the cis than the trans, however the P-Cl and C=O bond lengths are the same for both isomers. Obviously the P-Mo-P bond angle is larger for the trans than the cis.
Relative Energies
| Cis Isomer | Trans Isomer | |
|---|---|---|
| Absolute Energy | -623.5771 | -623.5760 |
| Relative Energy | -1637202 | -1637199 |
Looking at the relative energies, the cis isomer is found to be more stable, by about 3kJ mol-1. This value is very small though however, and in fact it is known that the trans isomer is actually more stable, due to the incresead steric hindrance between the PCl3 groups when they are cis to each other. Such a small difference could be considered insignificant in this way.
In order to change the relative ordering of the cis and trans isomers, the R groups on L=PR3 could be changed. More bulky groups would favour the trans isomer, whereas electron-withdrawing and/or electron-donating groups could reverse this ordering.
IR Spectra
 |
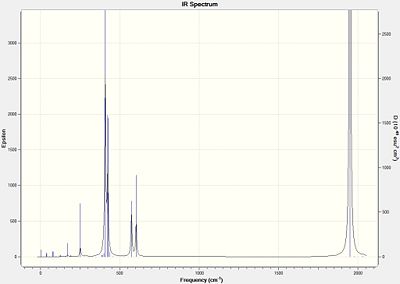 |
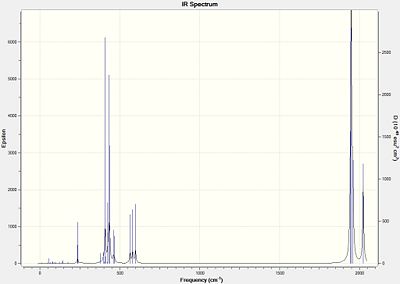
Neither isomer had any particularly "low" frequencies, which represent some rotational motion at room temperature, as the rotational levels are thermally accessible. The IR Frequencies are compared with the Experimental values[4] where L=PPh3:
| Computed | Experimental |
|---|---|
| 1946 | 1897 |
| 1949 | 1908 |
| 1959 | 1927 |
| 2024 | 2023 |
| Computed | Experimental |
|---|---|
| 1950 | 1901 |
| 1951 | 1901 |
| 1977 | 1901 |
| 2031 | 1901 |
The cis isomer's C=O frequencies correlate fairly well with the literature, but the trans isomer's do not. It should be noted that the trans isomer in the literature only has one frequency, which is expected when predicting from symmetry. However, 4 modes are obtained for both isomers, which are pretty similar. The reason why more bands may be obtained for the trans isomer is because the calculation hasn't realised that some are degenrate (have the same frequency), and others don't count because they incur no change in dipole moment.
References
- ↑ M.R. Bernejo et al., Polyhedron, 1988, 7, 2561-2567 DOI:10.1016/S0277-5387(00)83874-7
- ↑ F.A. Cotton, D.J. Darensbourg, S. Klein, and B.W.S. Kolthammer, Inorg. Chem., 21, 1982, 294-299 DOI:10.1021/ic00131a055
- ↑ D.W. Bennett, T.A. Siddiquee, D.T. Haworth, S.E. Kabir, and F. Camellia J. Chem. Cryst., 34(6), 2004, 353-359 DOI:10.1023/B:JOCC.0000028667.12964.28
- ↑ D.J. Darensbourg and R.L. Kemp, Inorg. Chem., 1978, 17, 2680-82
