Rep:Mod:otr12SYNTHESIS
Synthesis and computational lab: 1C
Introduction
Computational chemistry is chemical prediction- a certain instrument or tool might not be available in the lab to give a definitive answer for a particular query. Computational chemistry can be used to predict the properties of certain molecules such that, in the lab, these properties can be directly measured and the outcome for an experiment can be determined on comparison with computed data.
In this computational experiment various methods are used to model and predict the outcomes of specified and well documented reactions such as the hydrogentation of a cyclopentadiene cycloadduct, the interconversion of atropisomers for an intermediate in the synthesis of taxol and the Shi epoxidation of alkenes.
Results and Discussion
Conformational analysis using Molecular Mechanics (Part 1)
Hydrogenation of the cyclopentadiene dimer
The cyclopentadiene dimer is produced via a π4s + π2s cycloaddition and follows a suprafacial mechanism by the Woodward-Hoffmann rules [1] under thermal conditions. This dimerisation produces both a kinetically formed ENDO product and a thermodynamically formed EXO product. These both can undergo hydrogenation, initially hydrogenating one double bond and subsequently hydrogenating the other. The presence of two double bonds in the cycloaddition adduct leads to two possible structures for the initial hydrogenation. However, it is important prior to the investigation of the hydrogenation product, to determine which cycloadduct, EXO/ENDO, will be the dominant hydrogenation reactant. Molecular Mechanics was used with the MMFF94 force field to determine the relative energies of each of the cycloaddition adducts.
| 4n+2 | 4n | |
|---|---|---|
| Δ | Suprafacial | Antarafacial |
| hν | Antarafacial | Suprafacial |

|
|
|
|
The EXO cycloaddition adduct was minimised using MMFF94 and an output energy of 55.3740 kcal/mol obtained. The ENDO cycloaddition adduct was subsequently minimised using MMFF94 and an output energy of 58.1930 kcal/mol obtained. It is evident that the EXO product is lower energy than the ENDO product. This fits well with theory taking into regard that the ENDO product is kinetic due to secondary orbital interactions lowering the transition state energy and the EXO product is thermodynamic due to lessened H-H sterics [2]. However, the predominant factor here is not a stabilisation of the ENDO due to secondary orbital interactions, rather a destabilisation in the EXO transition state. It has been proposed by Jorgensen et al.[3] that the methylene hydrogens experience repulsion. It was also proposed this led to an increased bond length of the forming bond from 2.031A in the ENDO product to 2.128A in the EXO product. This was investigated by optimising both the EXO and ENDO cycloadduct to the transition using the Berny algorithm. Hartree Fock method with a 3-21G basis set was used to optimise the structure to a minimum having frozen the forming bonds to 2.2A. Then the structure was optimised to a transition state using Berny algorithm by iteratively calculating the numerical hessian guesses for the given structure at its energetic minimum. After the transition state and imaginary frequencies were found the forming bond lengths were measured. These were found to be 2.06A in the ENDO transition state and 2.16A in the EXO transition state agreeing nicely with literature.
A bond angle analysis was performed and showed a deviation from the expected 109.5o expected of an sp3 system. It can be seen that the ENDO cycloadduct has a greater deviation from this ideal angle and this contributes to the expected result that the ENDO cycloadduct is less thermodynamically stable than the EXO cycloadduct. The angle measured over the bridge does not change between the cycloadducts and therefore, even though this is a highly strained part of the molecule and small changes in strain at this point in either molecules would inevitably show a large deviation, the bridge does not contribute to the energy difference observed.
MM2 was now used to determine the energy contribution from stretching, bending, torsion, Van der Waals and electrostatic energy towards the output energy to discuss the relative stability of the hydrogenation products.
| Hydrogenation product 1 | Hydrogenation product 2 | |
|---|---|---|
| Stretching /kcal.mol-1 | 1.2354 | 1.0963 |
| Bending /kcal.mol-1 | 18.9415 | 14.5254 |
| Stretch-Bending /kcal.mol-1 | -0.7617 | -0.5492 |
| Torsion /kcal.mol-1 | 12.1170 | 12.4971 |
| Non- 1,4 Van Der Waals /kcal.mol-1 | -1.4964 | -1.0696 |
| 1,4 Van Der Waals /kcal.mol-1 | 5.7276 | 4.5115 |
| Dipole/Dipole /kcal.mol-1 | 0.1631 | 0.1406 |
| Total E /kcal.mol-1 | 35.9266 | 31.1520 |
The stretching and bending data reported in table 3 display the increased difficulty of the alkene on the norbonene moiety to respond to bending and stretching. The bending energy calculated was 4.4161 kcal.mol-1 more stable with the alkene located on the cyclopentene than the norbornene. In a thermodynamic sense, the hydrogenation of the alkene located on the norbonene moiety should be favoured due to the relief of this strain, therefore the hydrogenation of the cycloadducts is under thermodynamic control.
Furthermore, the norbornene alkene is less stable in terms of Van Der Waals interactions than the cyclopentene moiety by 1.2161 kcal.mol-1. This is most likely the repulsive interactions between the hydrogens of the cyclopentane moiety in hydrogenation product 1 compared to the interactions between the hydrogens of the norbornane moeity in the hydrogenation product 1. Simply, 3 sets of carbons with eclipsing hydrogens for the hydrogenation product 1 rather than 2 sets of eclipsing hydrogens for hydrogenation product 2. This again favours hydrogenation product 2.
The differing bending energies were analysed to determine the difference found in the energetic analysis. The ideal angle for a double bond should tend to 120o. The bond analysis measured the angles over each of the double bonds to be 107.3o and 112.9 o for hydrogenation product 1 and 2 respectively. This greater deviation of hydrogenation product 1 from ideality accounts for the energy difference observed in table 3. The greater strain of this seemingly compressed angle is energetically unfavourable.
Atropisomerism is the restricted rotation (due to high energy barriers) around one or more single bonds [4] yielding isomerically distinct molecules. In this investigation, an intermediate proposed by Paquette et al. [5] in the synthesis of taxol is investigated which exhibits interesting restriction of the single bonds around a carbonyl. Paquette et al. [5] discovered that the [3,3]-sigmatropic reaction shown in figure 2 is reversible and therefore the thermodynamic product will form. Structures with the carbonyl pointing up and down reported in table 4, were found by minimisation using the MMFF94 force field. Furthermore, it was found that, on optimisation, the conformation of the cyclohexane moiety played a pivotal roll in the total energy of the molecule. All minimum energy conformations of the cyclohexane moiety were found and reported.

| Up | Down | ||||
 |
 |
| Up | Down | |||
| Chair | Twist Boat | Chair | Twist Boat | |
| Stretch kcal.mol-1 | 2.7071 | 2.8456 | 2.6174 | 2.7114 |
| Bend kcal.mol-1 | 14.7197 | 15.7483 | 11.3300 | 11.7358 |
| Stretch-Bend kcal.mol-1 | 0.2785 | 0.3190 | 0.3427 | 0.3237 |
| Torsion kcal.mol-1 | 19.1569 | 22.4804 | 19.6774 | 21.8676 |
| Non- 1,4 VdW kcal.mol-1 | -1.7400 | -1.4687 | -2.1536 | -2.0911 |
| 1,4 VdW kcal.mol-1 | 13.7281 | 15.1027 | 12.8712 | 13.9175 |
| Dipole/Dipole kcal.mol-1 | -1.7571 | -1.7688 | -2.0021 | -2.0316 |
| Total Energy kcal.mol-1 | 47.0934 | 53.2585 | 42.6830 | 46.4336 |
From the data reported in table 4, it is evident that the lowest energy configuration is the atropisomer with the carbonyl pointing downwards relative to the C(CH2)2 bridge. The lowest energy conformation of each configuration is the chair configuration.
The down configuration is lower in energy than the up configuration due to a number of stereoelectronic and steric arguments. The most important idea to note is the periplanar relationship between the carbonyl and the adjacent C-H. The electron density located in the C-H bond can transfer into the C-C π orbital and the C=O antibonding orbital. Therefore, the down configuration is thermodynamically favourable and lower in energy than the alternative.
The breakdown of energetic contributions reported in table 4 shows that the greatest contribution to the energetic detriment in the up configuration derives from both the bending and Van der Waals contributions. The configurational energetic difference in terms of the bending contribution could be attributed to the spatial separation between a methyl on the bridge and the carbonyl. This measures to be 3.27A and on bending could reduce significantly to provide a repulsive interaction.
For the Van der Waals contribution, the proximity of the carbonyl and the bridge has to again be considered. On MM2 optimisation after the carbonyl was manually placed in the up position from the down position, it could be seen that the 10 membered ring underwent ring flipping resulting in an increased number of eclipsed hydrogens. This would provide such repulsive interactions that provides the Van der Waals energy contribution observed.
Hyperstable Alkenes
It has been stated that the functionalisation of the alkene after the isomerisation previously discussed is very slow and this clashes with theory predicted by Bredt's Rule[6], stating that an alkene located on a ring junction is highly unstable and reacts quickly. Work carried out by Maier et al. defined the existence of hyperstable alkenes which exhibit less strain in the alkene than the parent hydrocarbon. This was investigated by optimising both structures using the MM2 force field. This yielded an energy of 42.6829 kcal.mol-1 for the structure containing the alkene and an energy of 51.3564 kcal.mol-1 for the parent alkane. The energetic contributions were analysed.
| Alkene | Parent Alkane | |
| Stretch kcal.mol-1 | 2.6208 | 2.8427 |
| Bend kcal.mol-1 | 11.3383 | 14.2355 |
| Stretch-Bend kcal.mol-1 | 0.3434 | 0.6654 |
| Torsion kcal.mol-1 | 19.6709 | 22.1165 |
| Non- 1,4 VdW kcal.mol-1 | -2.1605 | -2.6754 |
| 1,4 VdW kcal.mol-1 | 12.8722 | 15.8977 |
| Dipole/Dipole kcal.mol-1 | -2.0022 | -1.7259 |
| Total Energy kcal.mol-1 | 42.6829 | 51.3564 |
It is evident from the bending contribution that there is a higher strain in the parent alkane than the alkene, further supported by the torsional contribution. It can be concluded from the literature [6] that the alkene is hyperstable.
Spectroscopic Simulation using Quantum Mechanics (Part 1)
Another intermediate in the synthesis of taxol was investigated here, proposed in the Paquette et al. paper[7], with a 1',3'-dithiolane attached to the cyclohexane moiety. The structure in figure 2 was built and optimised with a MMFF94 force field. This was the only configuration considered taking into regard previous conclusions.
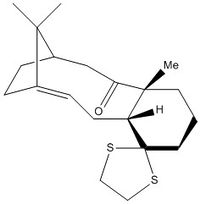

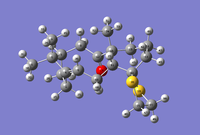
The structure in figure 2, showing the carbonyl in the down position, was optimised using the MMFF94 force field. An opt+freq calculation was undertaken using DFT, B3LYP and a 6-31G(d,p) basis set. CPCM was used as a key word to specify a polarisable conductor calculation. Benzene was specified as the solvent, differing from the deuterated benzene found in literature. Deuterated benzene could not be specified in the calculation. There should be a marginal difference between these solvents, the only difference being that benzene should show a peak on the 1H NMR spectrum and deuterated benzene should not. The EmpiricalDispersion=GD3 keyword was used to account for dispersion attractions. Gaussview seemed to automatically label the optimised structure and therefore, this was used to accurately analyse the NMR. These results were published on D-space DOI:10042/146564 .
| Assignment | δ /ppm |
| 37-H | 6.106796 |
| 40-H | 3.754198 |
| 53-H | 3.292585 |
| 52-H | 3.183435 |
| 50-H | 3.156679 |
| 51-H | 3.08227 |
| 35-H | 3.072673 |
| 38-H | 2.960616 |
| 26-H | 2.757363 |
| 39-H | 2.328592 |
| 41-H | 2.235664 |
| 25-H | 2.196258 |
| 24-H | 2.163453 |
| 28-H | 2.118312 |
| 44-H | 2.047527 |
| 42-H | 2.042768 |
| 49-H | 2.005109 |
| 27-H | 1.950693 |
| 47-H | 1.795735 |
| 34-H | 1.731999 |
| 46-H | 1.722203 |
| 36-H | 1.647961 |
| 31-H | 1.59155 |
| 43-H | 1.591332 |
| 45-H | 1.441498 |
| 33-H | 1.316912 |
| 48-H | 1.166008 |
| 32-H | 1.11447 |
| 29-H | 1.079677 |
| 30-H | 1.045078 |
NMR (300 MHz, C6D6) δ /ppm (Literature [8]): 5.21 (m, 1H), 3.00-2.70 (m, 6H), 2.70-2.35 (m, 4H), 2.20-1.70 (m, 6H), 1.58 (t, J = 5.4 Hz, 1H), 1.50-1.20 (m, 3H), 1.10 (s, 3H), 1.07 (s, 3H) , 1.03 (s, 3H)
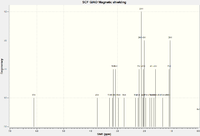
The computed data and the literature don't appear to compare very well for 1H NMR. At low chemical shifts there seems to be excellent agreement but at higher chemical shifts less so. Furthermore, the 1H NMR computation neglects splitting and therefore, can only be used to determine the extent of deshielding of a proton environment. It can be seen on comparing the labelling displayed in figure 3 and the assignments reported in table 6 that the most deshielded proton lies on the alkene. The calculated chemical shift seems to suggest a greater deshielding for this environment than literature. This was calculated for a proton in with the cyclohexane in the chair conformation. To investigate the effect of ring flipping, an NMR analysis of the twist-boat conformation was undertaken.
The data reported in table 7 display that a twist boat conformation exhibited by the cyclohexane moiety leads to increased shielding of the alkene proton. The twist boat conformation of the cyclohexane moeity appears to force the larger ring into a strained conformation in which all the hydrogens are close but not so close that they experience repulsion. These Van der Waals interactions are stronger in the twist boat conformation than the chair conformation, therefore, these interactions must play a part in the shielding of the proton.
| Assignment | δ /ppm |
| 38-H | 5.493764 |
| 50-H | 3.459268 |
| 49-H | 3.224208 |
| 48-H | 3.160377 |
| 47-H | 3.055447 |
| 36-H | 2.926427 |
| 39-H | 2.730826 |
| 27-H | 2.644316 |
| 40-H | 2.583857 |
| 41-H | 2.3561 |
| 26-H | 2.311102 |
| 45-H | 2.204044 |
| 23-H | 2.202568 |
| 25-H | 2.112036 |
| 42-H | 2.091008 |
| 29-H | 2.060802 |
| 28-H | 1.971951 |
| 43-H | 1.946061 |
| 52-H | 1.867058 |
| 44-H | 1.772681 |
| 32-H | 1.682701 |
| 35-H | 1.639949 |
| 37-H | 1.523895 |
| 53-H | 1.432649 |
| 34-H | 1.299805 |
| 46-H | 1.21028 |
| 51-H | 1.185217 |
| 33-H | 1.158731 |
| 30-H | 1.119268 |
| 31-H | 1.084679 |
| Assignment | δ /ppm | Literature δ /ppm | Deviation |
| 17-C | 204.6631 | 211.49 | -6.8269 |
| 4-C | 136.8598 | 148.72 | -11.8602 |
| 9-C | 111.0562 | 120.9 | -9.8438 |
| 12-C | 82.5872 | 74.61 | 7.9772 |
| 16-C | 50.0646 | 60.53 | -10.4654 |
| 11-C | 49.2709 | 51.3 | -2.0291 |
| 3-C | 46.366 | 50.94 | -4.574 |
| 5-C | 39.6919 | 45.53 | -5.8381 |
| 13-C | 38.9213 | 43.28 | -4.3587 |
| 23-C | 35.742 | 40.82 | -5.078 |
| 22-C | 34.1584 | 38.73 | -4.5716 |
| 15-C | 33.3182 | 36.78 | -3.4618 |
| 8-C | 27.6832 | 35.47 | -7.7868 |
| 10-C | 21.8197 | 30.84 | -9.0203 |
| 1-C | 18.5579 | 30 | -11.4421 |
| 6-C | 16.6136 | 25.56 | -8.9464 |
| 2-C | 15.6265 | 25.35 | -9.7235 |
| 14-C | 15.1996 | 22.21 | -7.0104 |
| 7-C | 13.2084 | 21.39 | -8.1816 |
| 19-C | 12.5511 | 19.83 | -7.2789 |
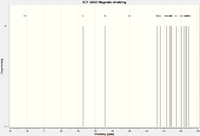
The 13C NMR calculated compared much better to the literature, with splitting and broadening effects neglected. The calculated deviations were found to have a 4.25 ppm standard deviation. The greatest deshielding experienced by a carbon environment was the C=O, carbon 17. Carbons 4 and 9 found on the alkene, were again deshielded but not to the same extent as the carbonyl. Furthermore, the electron withdrawing properties of the bonded sulphurs deshielded carbon 12.
The free energy of this configuration was found to be -1651.466234 Hartree and could be compared to the other configuration to determine a rate of conversion for the configurations.
Analysis of the properties of the synthesised alkene epoxides (Part 2)
In this investigation, two catalysts, the Shi catalyst and the Jacobsen catalyst, will be used to form epoxides from alkene examples. Both catalysts produce an epoxide configuration in an enantiomeric excess and it is the objective of this exercise to determine what the absolute configuration of the transition states. The NMR of the products were simulated
The Shi Fructose-derived chiral catalyst
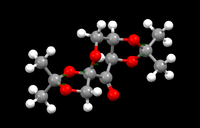
Shi catalyst, derived from fructose, provides an asymmetric, stereospecific alternative for epoxidation and is shown in figure 3. The catalyst is highly active and therefore a precursor is used which, on addition of HSO5-, forms the active form of the Shi catalyst. With the presence of acetal groups in the Shi catalyst, this gives rise to anomeric effects on the structure. The anomeric effect provides a preference for an axial position, overcoming 1,3-diaxial repulsions, to ensure an antiperiplanar arrangement is found between a lone pair of a heteroatom within the ring and the σ* C-X orbital of a substituent[9]. An analysis of the anomeric centres located on Shi catalyst has been undertaken.
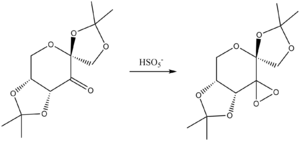
Initially, a search for shi catalyst was undertaken using pubchem. Once found, mercury was used to analyse the anomeric centres.
| Anomeric Centre | C-O bond distance /A |
|---|---|
| 1 | 1.433/1.434 |
| 2 | 1.427/1.424 |
| 3 | 1.435/1.437 |
Literature reports a single C-O bond length to be 1.420A and it is evident that all of the C-O bond lengths are larger than this value. However, if there was no anomeric effect, there would be no variation in the C-O bond lengths, which does not agree with observation. Therefore, we can conclude that, even though the bond lengths might not compare well to the accuracy required for such studies, there must be an anomeric effect present. The extent of this effect is analysed by comparing the relative lengths of the C-O bonds reported in table 5. It cannot be concluded that just because a certain environment shows shorted C-O bond lengths, it has a stronger environment for the anomeric effect is not the only effect being experienced. The nature of the effect therefore predicts that the larger the difference between-C-O- bond distances in each environment allows for the conclusion that these environments experience a greater anomeric effect.
Analysing the data reported in table 5 it can be clearly seen that the greatest C-O bond difference is found in environments 2 and 3 whereas environment 1 does not see significant anomeric effects. It is also observable that both C-O bond lengths in environment 3 are longer than the others. A similar phenomenon reported in literature shwoing elongation at the C-O bond is reported to be a result of increased electronegativety at the oxygen substituent. [10]. The increased electronegativety at the oxygen lowers the antibonding σ* and therefore the bond tends to be more dissociated. However, this leads to an increased shortening of the 'endocyclic' C-O bond, which does not seem to be seen here. The elongation is most likely a repulsive interaction between the carbonyl lone pairs and the methyl groups of this acetal centre. This would also account for the apparent twisting of the 5 membered ring containing this acetal centre.
The Jacobsen salen-derived chiral catalyst
Just like the Shi catalyst, the Jacobsen catalyst provides a route for epoxidation allowing for increased stereospecificity and enantioselectivity. However, the mechanism has been controversial and it is generally accepted that there are two different mechanisms, one involving a radical intermediate and the other a concerted mechanism [11] To determine factors affecting structure for the Jacobsen catalyst, the distances between adjacent t-Butyl groups were measured and analysed.

A search on the Cambridge crystal database was undertaken for the precursor to the Jacobsen catalyst. This yielded 5 results, 3 of which were the pre-cursor- TOVNIB01, TOVNIB02, TOVNIB03. Each of these crystal structures showed increasing staggering with crystal structure TOVNIB01 highly eclipsed. Bond distances were measured between the sterically challenged tert-butyl groups for TOVNIB01 and were displayed in figure 5.
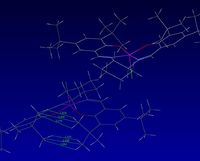
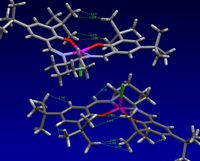
Hydrogen atoms begin to experience repulsive interactions at distances of 2.1Å [12]. Analysing figure 9, it can be seen that 2.081Å is the closest approach of the tBu groups. Even greater repulsive interactions can be seen between the tBu groups and neighboring aromatic hydrogens which measure to be 1.810Å and 1.681Å. Interactions between other tBu groups and the neighboring aromatic hydrogens measure seem to be smaller, measuring 2.156Å and 2.152Å. This is within twice the Van der Waals radius of hydrogen, reported to be 1.2Å [13] and just outside the minimum distance required for repulsion.
The calculated NMR properties of the epoxide products
In this investigation, configurations of trans-stilbene oxide and 1,2-dihydronapthalene oxide were investigated, shown in figure 9. NMR spectra were calculated for comparison to labwork. It is evident, seeing the similarity in the reported spectra, that NMR cannot give any information about the absolute configuration. It is, however, useful to use the data reported here to determine whether one has made any (R,R)-trans-Stilbene oxide or (S,S)-trans-Stilbene oxide, for example.
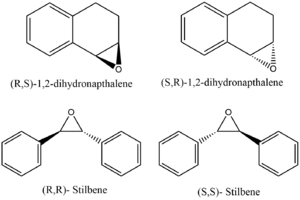
Trans-stilbene oxide and 1,2-dihydronapthalene oxide were built and optimised using the MMFF94 force field. The resulting stereochemistry was determined and an OPT+FREQ calculation was undertaken to calculate the NMR spectrum. This method was analogous to that used for the intermediate in the synthesis of taxol.
| Configuration 1 | NMR Spectrum | Configuration 2 | NMR Spectrum |
|---|---|---|---|
| (R,R)-stilbene oxide | 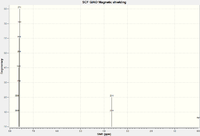 |
(S,S)-stilbene oxide | 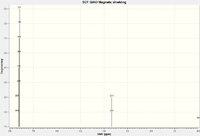 |
| (R,S)-1,2-dihydronapthalene | 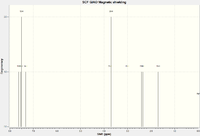 |
(S,R)-1,2-dihydronapthalene | 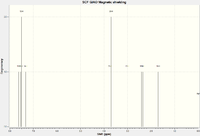 |
| Assignment | δ /ppm |
| 15-H | 7.626237 |
| 13-H | 7.539405 |
| 12-H | 7.504752 |
| 14-H | 7.331132 |
| 21-H | 3.745757 |
| 20-H | 3.70147 |
| 16-H | 3.016034 |
| 17-H | 2.403619 |
| 18-H | 2.352139 |
| 19-H | 1.698643 |
| Assignment | δ /ppm |
| 26-H | 7.706367 |
| 20-H | 7.706365 |
| 18-H | 7.642697 |
| 23-H | 7.64268 |
| 17-H | 7.625575 |
| 24-H | 7.625571 |
| 25-H | 7.605076 |
| 16-H | 7.605068 |
| 19-H | 7.586796 |
| 27-H | 7.586776 |
| 21-H | 3.673599 |
| 22-H | 3.673433 |
1H NMR Literature for 1,2-dihydronapthalene oxide (400 MHz; CDCl3)[14] : 7.45 (1H, d, J = 7 Hz), 7.35–7.20 (2H, m), 7.15 (1H, d, J = 7 Hz), 3.90 (1H, d, J = 4 Hz), 3.77 (1H, t, J = 4 Hz), 2.85–2.80 (1H, m), 2.60–2.55 (1H, m), 2.50–2.40 (1H, m), 1.80–1.75 (1H, m)
1H NMR Literature for E-Stilbene oxide (400 MHz; CDCl3)[14] : 1H NMR (400 MHz; CDCl3): 7.42–7.52 (10H, m), 3.98 (2H, s)
The data calculated and the data reported in literature compare reasonably, with all peaks reported in literature showing in the calculated values. A more in depth analysis was undertaken for the 13C spectra.
| Configuration 1 | NMR Spectrum | Configuration 2 | NMR Spectrum |
|---|---|---|---|
| (R,R)-stilbene oxide | 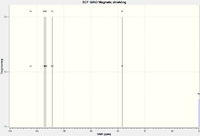 |
(S,S)-stilbene oxide | 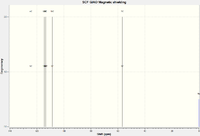 |
| (R,S)-1,2-dihydronapthalene oxide | 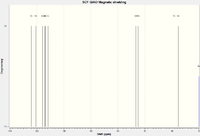 |
(S,R)-1,2-dihydronapthalene oxide |  |
| Assignment | δ /ppm | Literature [14] δ /ppm | Deviation |
| 4-C & 9-C | 124.3829 | 137.7 | -13.3171 |
| 13-C & 6-C | 114.5165 | 129.1 | -14.5835 |
| 2-C & 11-C & 12-C & 1-C & 10-C & 3-C | 113.5641 | 128.8 | -15.2359 |
| 14-C & 5-C | 108.5598 | 126.1 | -17.5402 |
| 7-C & 8-C | 56.72499 | 63.3 | -6.57501 |
| Assignment | δ /ppm | Literature [14] δ /ppm | Deviation |
| 4-C | 124.1373 | 137.1 | -12.9627 |
| 5-C | 120.679 | 132.9 | -12.221 |
| 6-C | 115.848 | 129.9 | -14.052 |
| 3-C | 114.1308 | 129.8 | -15.6692 |
| 2-C | 113.7204 | 128.8 | -15.0796 |
| 1-C | 111.7367 | 126.5 | -14.7633 |
| 9-C | 46.729 | 55.5 | -8.771 |
| 10-C | 45.12417 | 53.2 | -8.07583 |
| 7-C | 18.33161 | 24.8 | -6.46839 |
| 8-C | 15.24076 | 22.2 | -6.95924 |
Standard deviations for the 13C of both oxides were calculated to be 3.58 and 4.14 for the 1,2-dihydronapthalene and E-Stilbene respectively. The number of data points reported in literature for E-Stilbene and the number of computed points showed a mismatch, but it was evident that a number of the data points were the same or highly similar. These points were averaged and subsequently matched well with literature.
Assigning the absolute configuration of the product
In this investigation, optical rotations and vibrational circular dichroism were calculated for each of the oxides. Electronic circular dichroism, whilst it has been calculated for completeness, is not a useful measure of the absolute configuration in the products as it requires chromophore moeity. An ECD spectrum can be calculated and shows a spectrum here, however, there is no chromophore corresponding to the product and therefore, ECD cannot be used to tell the absolute configuration on the epoxide.
Optical Rotations
Optical rotations were calculated using a DFT B3LYP model and a 6-311++g(2df,p) basis set. Chloroform was used as the solvation model and polar(optrot) used as a keyword. It was calculated at wavelengths specified at 589nm and 365nm and therefore, two optical rotations per conformation are reported.
| (RS)-1,2-dihydronapthalene oxide DOI:10042/160941 |
(SR)-1,2-dihydronapthalene oxide DOI:10042/160937 | |
|---|---|---|
| 589 nm | 155.79o | -155.81o |
| 365 nm | 522.07o | -522.13o |
| (RR)-E-Stilbene oxide DOI:10042/160943 |
(SS)-E-Stilbene oxide DOI:10042/160939 | |
|---|---|---|
| 589 nm | 298.16o | -297.90o |
| 365 nm | 1254.43o | -1253.28o |
The optical rotation reported in literature for 1,2-dihydronapthalene oxide was stated as ±144.7o [15]and for E-Stilbene oxide 250.8o[16] both for a wavelength of 589 nm and both measured in chloroform. The data compare fairly well with literature, 1,2-dihydronapthalene showing a 7.12% deviation from literature and E-Stilbene showing a 15.8% deviation. These deviations are certainly not unexpected taking into regard factors that could affect the labwork or approximations/limitations in computation. Errors can be present in the polarimeter which affect results during the measurement or prior to the measurement, the sample is most likely not configurationally pure.
Vibrational circular dichroism
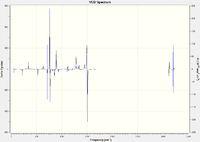
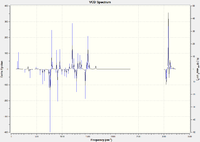
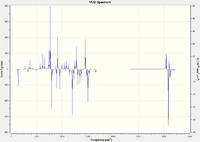
Vibrational cicular dichroism (VCD) is a highly useful technique to determine structural information and is very similar to IR spectroscopy. Unlike IR spectroscopy which absorbs unpolarised infra-red light to vibrationally excite molecules, VCD measures the difference between two polarised light sources rotated in opposite directions[17] The use of polarised light in VCD allows for determination of the absolute configuration- a compound with an (R,R) configuration will absorb light of equal intensity but in the opposite direction to a compound with a (S,S) configuration. Therefore, calculating and assigning an absolute configuration to a computed VCD spectrum should allow for a comparision to be made in the lab to a measured spectrum, and a pretty good guess to the absolute configuration in excess of a sample produced in the lab.
It is to be noted that the only difference between the spectra of certain configurations of a molecule is a reflection in the frequency axis.
Electronic circular dichroism
Electronic circular dichroism spectra were measured, however, will not provide any information about the absolute configuration at the epoxide with no chromophore moeity present around the epoxide. The spectrum seen just shows the presence of the benzylic functionality which acts as the chromophore in the case of both the epoxides. It is noted in this discussion as a possibility for measuring the absolute configuration in molecules containing chromophore functionality around the centre at which absolute configuration is to be determined.
| Configuration 1 | ECD Spectrum | Configuration 2 | ECD Spectrum |
|---|---|---|---|
| (R,R)-stilbene oxide | 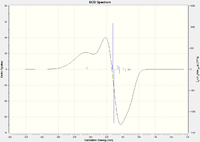 DOI:10042/160952 |
(S,S)-stilbene oxide | 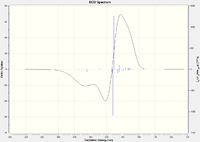 DOI:10042/160948 |
| (R,S)-1,2-dihydronapthalene | 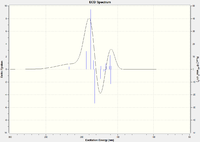 DOI:10042/160946 |
(S,R)-1,2-dihydronapthalene | 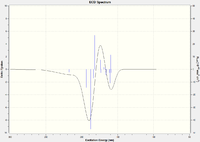 DOI:10042/160950 |
Using the (calculated) properties of transition state for the reaction
In this investigation, two catalyst systems have been introduced, namely the Shi catalyst and the Jacobsen catalyst. The previous discussions have concentrated on the comparison of experimental data with theoretical data calculated through computation, to assign absolute configuration to samples obtained whilst working in the lab. However, little consideration has been made about how likely one epoxide absolute configuration will be produced over another with a specific catalyst system. To this end, a transition state study has been undertaken to determine enantiomeric excess. Furthermore, calculations were undertaken to determine how each molecule would react with the catalyst to produce the outcomes observed.
A catalyst is often defined as a material that speeds up a reaction by lowering the kinetic barrier for reaction, without being consumed itself in reaction. A simplified picture is shown in figure 10, where it is seen that the energy required to reach the transition state for a catalysed reaction is less than the energy required to reach the transition state in an uncatalysed reaction.
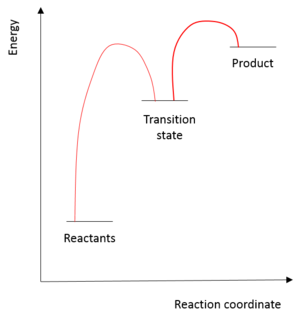
As stated above, figure 10 represents a simplified picture- quite often a catalyst will drive a reaction through a number of transition states much lower in energy than the original transition state. The sum of all of these transition states would still be lower than the original transition state! [18]
Enantiomeric excess (ee) has been calculated for each configuration pair and for each cataltyst by using ΔG and equations 1 and 2.
| Equation 1: Rate Constant |
|---|
| Equation 2: Enantiomeric Excess |
Where K is the rate constant, G is the Gibbs Free Energy, R is the molar gas constant, T is the absolute temprature, ee is the enantiomeric excess and R and S are enantiomeric proportions.
Calculated transition state output files for the various configurations of the shi epoxidation of (S,S)/(R,R)-stilbene and (R,S)/(S,R)-dihydronapthalene were used to determine the sum of electronic and zero point energies. This was used to determine the transition state of the shi epoxidation from either configuration and the free energies of these configurations
Shi Catalyst
Trans-Stilbene
-1534.626855 Hartree DOI:10.6084/m9.figshare.828552 |
-1534.627550 Hartree DOI:10.6084/m9.figshare.830388 |
-1534.641092 Hartree DOI:10.6084/m9.figshare.829522 |
-1534.641048 Hartree DOI:10.6084/m9.figshare.829523 |
-1534.624864 Hartree DOI:10.6084/m9.figshare.829524 |
-1534.625326 Hartree DOI:10.6084/m9.figshare.829525 |
-1534.634829 Hartree DOI:10.6084/m9.figshare.830389 |
-1534.631640 Hartree DOI:10.6084/m9.figshare.830390 |
The enantiomeric excess investigation was undertaken by comparing the sum of electronic and zero-point energies for each of the transition states within a certain conformation. Once the lowest energy transition state within each conformation had been found, the electronic energy + free energies were compared to determine the lowest energy transition state between the conformations.
It can be seen that RR-Trans-Stilbene transition state 3 is the lowest energy in terms of electronic energy + zero point energy and SS-Trans-Stilbene transition state 3 was the lower in energy for the SS conformations. The electronic energy + free energy for RR-Trans-Stilbene transition state 3 was computed to be -1534.700037 Hartree and for SS-Trans-Stilbene transtion state 3 was computed to be -1534.693818 Hartree. Exhibiting the lower free energy in the transition state, RR-Trans-Stilbene will be in enantiomeric excess.
| Equation 3: The modified enantiomeric excess equation |
|---|
The difference between these free energies was calculated and found to be 16327.9857 J.mol-1. Equation 1 was used to calculate the rate constant and the rate constant used in equation 3. The rate constant was 730.3249 at 298K yielding an enantiomeric excess of 99.7% in favour of the RR-Trans-Stilbene conformation. Shi et al. [19] reported an enantiomeric excess for the asymmetric epoxidation of trans-stilbene 95.2% in favour of the (+)-(R,R)-Trans-Stilbene conformation. This is very close to the value computed and therefore, the calculation in the case of trans-stilbene can be concluded to be reliable.
1,2-dihydronapthalene
-1381.067307 Hartree DOI:10.6084/m9.figshare.832492 |
-1381.071022 Hartree DOI:10.6084/m9.figshare.832510 |
-1381.079990 Hartree DOI:10.6084/m9.figshare.832511 |
-1381.073345 Hartree DOI:10.6084/m9.figshare.832512 |
-1381.076498 Hartree DOI:10.6084/m9.figshare.832538 |
-1381.060498 Hartree DOI:10.6084/m9.figshare.832536 |
-1381.071584 Hartree DOI:10.6084/m9.figshare.832545 |
-1381.081855 Hartree DOI:10.6084/m9.figshare.832544 |
Performing the same analysis for 1,2-dihydronapthalene as was performed for Trans-Stilbene, it has been observed that the lowest energy transition state for (R,S)-1,2-dihydronapthalene was transition state 3 and the lowest energy transition state for (S,R)-1,2-dihydronapthalene was transtion state 4. Free energies were computed for both of these transitions and were found to be -1381.134059 and -1381.136239 for the (R,S) and (S,R) conformations respectively. The (S,R) conformation provides the lowest energy transition state and therefore the (S,R) conformation will be in enantiomeric excess.
was calculated to be 5723.59 J.mol-1 and when inserted into equation 1 found a value for the rate constant of 10.09. This calculated an enantiomeric excess of 82.0% in favour of the (S,R) conformation. Literature[20] was found for (S,R)-1-phenyl-3,4-dihydronapthalene oxide, a very similar structure, stating the enantiomeric excess to be 89%. This is not too dissimilar to the 82.0% calculated and agreed with the favoured conformation.
Jacobsen Catalyst
Trans-Stilbene Oxide
-3574.921174 Hartree |
-3574.923087 Hartree |
The electronic + free energies were used to compare from the outset with the presence of only two possible transition states using the Jacobsen catalyst. It was evident that the SS-Trans-Stilbene oxide showed the lower transition state and therefore would be favoured in the reaction mechanism with SS-Trans-Stilbene oxide having the greater enantiomeric excess.
The free energy difference between the conformations was calculated to be 5022.582 J.mol-1 and the rate constant subsequently calculated to be 7.600356. This yielded an enantiomeric excess of 76.7% in favour of SS-Trans-Stilbene. Comparing to literature, Jacobsen et al. [21] published an enantiomeric excess of 33% in favour of the (S,S)-Trans-Stilbene. Our calculation agrees with the favoured configuration, however, the enantiomeric excess published in literature is much lower than the calculated value. This could be accounted for with a number of arguments- the strongest is most likely that the calculation didn't reach a global minimum. The Jacobsen, being a manganese complex, could undergo decomposition through a number of pathways, reducing the enantiomeric excess. Decomposition is not taken into regard in the calculation and therefore would be neglected in the calculation. However, as previously stated, the error is most likely a computational argument.
1,2-dihydronapthalene
-3421.286233 Hartree |
-3421.286765 Hartree |
-3421.295837 Hartree |
-3421.287894 Hartree |
The electronic + zero point energies calculated showed that transition state 2 for the RS configuration was lower in energy than transition state 1 of the SR conformation. The free energies of these conformations were calculated to be -3421.369033 Hartree and -3421.359499 Hartree for the SR and RS conformations respectively. The change in free energy between these transitions states was calculated to be 25031.52 J.mol-1 and the rate constant subsequently calculated to be 24541.21. This is inordinately large and it is not surprising that this yields an enantiomeric excess of 99.99%. This was compared to literature [22] which reported the enantiomeric excess to be 59% in favour of the SR configuration. This does not agree with the computed data and is likely, as found previously, the computation finding a local minimum.
Non-Covalent Interactions- Shi Catalyst and (R,R)-Trans-Stilbene
Non-covalent interactions involve no exchange of electrons and can be thought of as a stickiness inherent to most molecular functionality at certain attractive distances. Examples of Non-covalent interactions include Van der Waals interactions, hydrogen bonds, - stacking. A total density calculation was undertaken to determine the non-covalent surfaces between interacting functionality.
|
It is evident that many types of interaction can be analysed here. On initial inspection, most NCIs appeared to be Van der Waal interactions, however, it was observed that interactions between oxygens and near hydrogens has a significant contribution to the non-covalent interactions throughout this transition state.
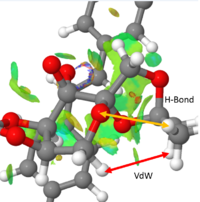
Figure 11 shows two interactions, a Van der Waals interaction between two hydrogens and a hydrogen bond between a oxygen containing ring and a nearby hydrogen. Both of these interactions are on the Shi catalyst itself and therefore contribute to the conformation of the Shi catalyst and inevitably affect the reaction trajectory of the alkene, the two of course not being mutually exclusive.
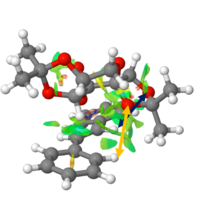
Furthermore, there appeared to be a build up of interaction between the Shi catalyst and the alkene, mostly H-like bonding between the dioxirane ring on Shi catalyst and near hydrogens on the alkene. This interaction is shown in figure 12 and would certainly favour this reaction trajectory. The 'stickiness' would hold the alkene in such a position relative to the epoxide forming oxygen on the Shi catalyst.
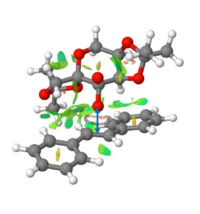
Interaction between oxygen of the Shi catalyst and the alkene is shown in figure 13. This is a strong NCI interaction at the point of transition state, at which time bonds have still yet to form.
Non-Covalent Interactions- Shi Catalyst and (R,R)-Trans-Stilbene
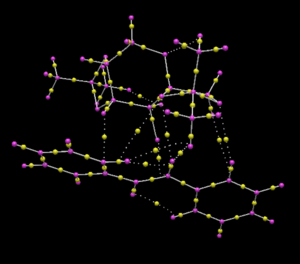
The QTAIM analysis is similar to NCI but calculates points at which the first order derivative of electron density with respect to position is 0. These 'bond topological critial points' are highlighted with yellow balls in figure 11. In the case for QTAIM, not only non-covalent interactions, but also formal bonds are analysed and therefore a much broader picture can be developed.
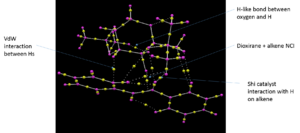
The advantage of QTAIM over NCI is you can observe where an interaction takes place and to which atom the interaction is strongest. The NCI analysis undertaken previously has been further analysed in figure 12 and one can see the interaction between the dioxirane ring and the forming alkene.
Suggesting new candidates for investigations

Reaxys was used to search for new candidates for investigation showing optical rotation power > 300 degrees and an ideal molecular weight < '200.0'. 3-((2R,3R)-3-phenyloxiran-2-yl)pyridine, 3-(3-phenyl-oxiranyl)-pyridine, trans-3-Stilbazoloxid was found for its optical rotatory power, reported to be 365.9o in benzene at 589 nm [23] and molecular weight 250.338 g.mol-1. It has been shown by Ona Illa et al. [24] that it's synthesised from readily available starting materials. Furthermore, the presence of the nitrogen in the pyridine moeity could provide greater enantiomeric excess using conclusions made in the NCI analysis. The nitrogen could provide an extra 'stickiness' and hold the molecule to the Shi/Jacobsen catalysts.
References
<references> Template loop detected: Template:Reflist
- ↑ R. B. Woodward , R. Hoffmann , J. Am. Chem. Soc., 1965, 87(2), pp 395–397, DOI:10.1021/ja01080a054
- ↑ Y. Apeloig, E. Matzner J. Am. Chem. Soc.1995, 117, pp 5375-5376 DOI:10.1021/ja00124a027
- ↑ W. L. Jorgensen , D. Lim , J. F. Blake, J. Am. Chem. Soc., 1993, 115(7), pp 2936–2942, DOI:10.1021/ja00060a048
- ↑ H. Rzepa, Conformational analysis, http://www.ch.ic.ac.uk/local/organic/conf/index.html, Date Accessed: 14/12/14
- ↑ 5.0 5.1 5.2 S.W. Elmore, L.A. Paquette, Tetrahedron Letters , 1991 , 32, pp. 319-322, DOI:10.1016/S0040-4039(00)92617-0
- ↑ 6.0 6.1 J. Bredt, Liebis Ann., 1924, 437 (1), pp. 1-13, DOI:10.1002/jlac.19244370102
- ↑ L. A. Paquette, N. A. Pegg, D. Toops, G D. Maynard, R. D. Rogers J. Am. Chem. Soc.1990, 112, pp 211-283 DOI:10.1021/ja00157a043
- ↑ L. A. Paquette, N. A. Pegg, D. Toops, G. D. Maynard, R. D. Rogers, J. Am. Chem. Soc., 1990, 12 (1), pp 277–283, DOI:10.1021/ja00157a043
- ↑ E. Juaristi, G. Cuevas, Tetrahedron, 1992, 48 (24), pp. 5019-5097, DOI:10.1016/S0040-4020(01)90118-8
- ↑ A. J. Briggs,* R. Glenn, P. G. Jones, A. J. Kirby, and P. Ramaswamy, J. Am. Chem. Soc., 1984, 106 (21), pp. 6200-6206, DOI:10.1021/ja00333a014
- ↑ E. M. McGarrigle, D. G. Gilheany, Chem. Rev., 2005, 105 (5), pp 1563–1602, DOI:10.1021/cr0306945
- ↑ E. Mamontov, T. J. Udovic, O. Isnard, , J. J. Rush, Phys. Rev. B, 2004,70, DOI:10.1103/PhysRevB.70.214305
- ↑ A. Bondi, J. Phys. Chem., 1964, 68 (3), pp 441–451, DOI:10.1021/j100785a001
- ↑ 14.0 14.1 14.2 14.3 M. W. C. Robinson, K. S. Pillinger, I. Mabbett, D. A. Timms, A. E. Graham, Tetrahedron, 2010, 66 (43), pp. 8377–8382; DOI:10.1016/j.tet.2010.08.078
- ↑ H. Sasaki, R. Irie, T. Hamada, K. Suzuki, T. Katsuki Tetrahedron, 1994, 50 (41), pp. 11827–11838; DOI:10.1016/j.tet.2010.08.078
- ↑ A. Solladié-Cavallo, A. Diep-Vohuule, V. Sunjic, V. Vinkovic Tetrahedron: Asymmetry, 1996, 7 (6), pp. 1783–1788 DOI:10.1016/0957-4166(96)00213-3
- ↑ P. J. Stephens, J. Phys. Chem., 1985, 89(5), pp 748–752, DOI:10.1021/j100251a006
- ↑ W. J. Albery , J. R. Knowles, Biochemistry, 1976, 15(25), pp 5627–5631, DOI:10.1021/bi00670a031
- ↑ O. A. Wong , B. Wang , M-X Zhao, Y. Shi, J. Org. Chem., 2009, 74, pp. 335–6338; DOI:10.1021/jo900739q
- ↑ < �� �L. Shu, Y. Shi, Tetrahedron, 57 (24), pp. 5213–5218, DOI:10.1016/S0040-4020(01)00362-3
- ↑ E. N. Jacobsen , W. Zhang , A. R. Muci ,J. R. Ecker , L. Deng, J. Am. Chem. Soc., 1991, 113, pp. 7063–7064, DOI:10.1021/ja00018a068
- ↑ P. Pietikäinen, Tetrahedron Letters, 1994, 35 (6), pp. 941–944, DOI:10.1016/S0040-4039(00)76006-0
- ↑ A. Solladie-Cavallo; M. Roje; T. Isarno; V. Sunjic; V. Vinkovic, Eur. J. Org. Chem., 2000, 6, pp. 1077 - 1080, DOI:10.1002/(SICI)1099-0690(200003)2000:6<1077::AID-EJOC1077>3.0.CO;2-4 10.1002/(SICI)1099-0690(200003)2000:6<1077::AID-EJOC1077>3.0.CO;2-4
- ↑ O. Illa, M. Namutebi, C. Saha, M. Ostovar, C. C. Chen, M. F. Haddow, S. Nocquet-Thibault, M. Lusi, E. M. McGarrigle, V. K. Aggarwal, J. Am. Chem. Soc., 2013, 135(32), pp 11951–11966, DOI:10.1021/ja405073w

