Rep:Mod:orgyh3511
Confirmational Analysis of Cyclopentadiene Dimer
Cyclopentadiene dimerises to give product 1 and 2. Through further hydrogenation, derivatives 3 and 4 are produced.

Whether the endo or the exo form dominate depends on whether the reaction is under kinetic or thermodynamic control. Therefore calculations are carried out to obtain values for total bond stretching, angle bending, torsional, van der Waals and electrostatic energies. MMFF94s method is used. The values are listed below in the table.
| Property | Dimer 1 (exo) | Dimer 2 (endo) | Dimer 3 | Dimer 4 | ||||||||||||
|---|---|---|---|---|---|---|---|---|---|---|---|---|---|---|---|---|
| Stretch kcal/mol | 3.54305 | 3.46741 | 3.31169 | 2.82305 | ||||||||||||
| Bend kcal/mol | 30.77271 | 33.19144 | 31.93522 | 24.68537 | ||||||||||||
| Torsion kcal/mol | -2.73105 | -2.94939 | -1.46912 | -0.37837 | ||||||||||||
| van der Waals kcal/mol | 12.80155 | 12.35716 | 13.63750 | 10.63729 | ||||||||||||
| Electrostatic kcal/mol | 13.01372 | 14.18422 | 5.11952 | 5.14702 | ||||||||||||
| Total energy kcal/mol | 55.37344 | 58.19070 | 50.44568 | 41.25749 | ||||||||||||
| Structure |
|
|
|
|
Analysis
For molecules 1 and 2, it is evident that the exo form is lower in energy, it is the thermodynamic product. However the endo form is produced specifically. This means the kinetic product dominates. This could be due to less strained angles in the endo form at sp2 and sp3 carbon centres (since typical angle values for sp2 carbon is 120o and for sp3 carbon is 109o) .
The two intermediates (9 and 10) in the formation of taxol are optimised and analysed using MMFF94s method.
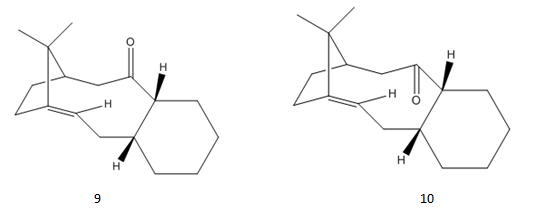
The energies of the two atropisomers are given in the table below.
| Property | Isomer 9 | Isomer 10 | ||||||
|---|---|---|---|---|---|---|---|---|
| Stretch kcal/mol | 7.65325 | 7.75545 | ||||||
| Bend kcal/mol | 28.28188 | 18.98819 | ||||||
| Torsion kcal/mol | 0.26912 | 3.79387 | ||||||
| van der Waals kcal/mol | 33.14267 | 34.99601 | ||||||
| Electrostatic kcal/mol | 0.30295 | -0.05982 | ||||||
| Total energy kcal/mol | 70.54025 | 66.29283 | ||||||
| Structure |
|
|
It is evident that isomer 10 (down) has the lower energy therefor it is the thermodynamic product. This is due to less contribution from the angle bending energy. From the angles labelled in structures we can see that isomer 10 has a less strained structure. Therefore it could be the kinetic product as well.
Products after hydrogenation[1]
The energies of the products from hydrogenation of isomers 9 and 10 are also analysed using the same method.
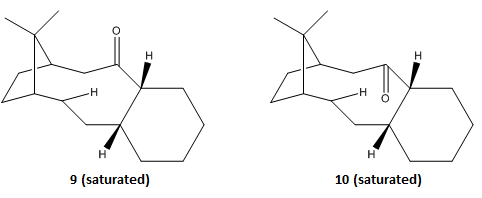
| Property | Isomer 9 (saturated) | Isomer 10 (saturated) |
|---|---|---|
| Stretch kcal/mol | 7.22403 | 7.35327 |
| Bend kcal/mol | 23.32429 | 30.23447 |
| Torsion kcal/mol | 8.10832 | 6.51434 |
| van der Waals kcal/mol | 33.55023 | 33.94051 |
| Electrostatic kcal/mol | 0.00000 | 0.00000 |
| Total energy kcal/mol | 72.32844 | 78.49372 |
The saturated products have higher energies than the unsaturated one. This means for the hydrogenation of isomers 9 and 10, the products are less stable than the reactants. Therefore it is an unfavourable process.
Spectroscopic Simulation using Quantum Mechanics [2]
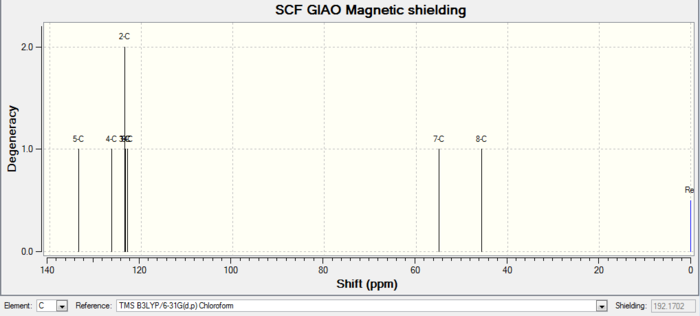
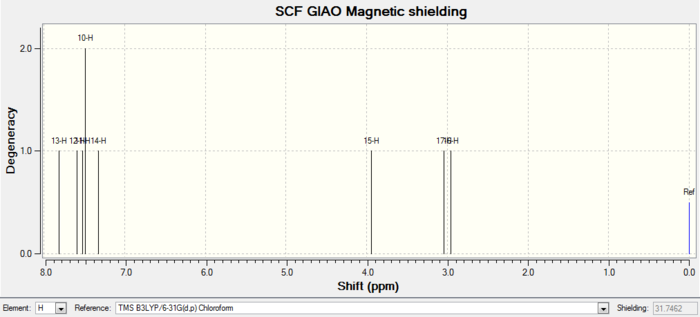
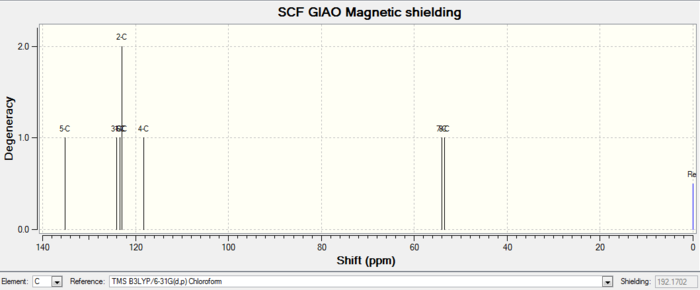
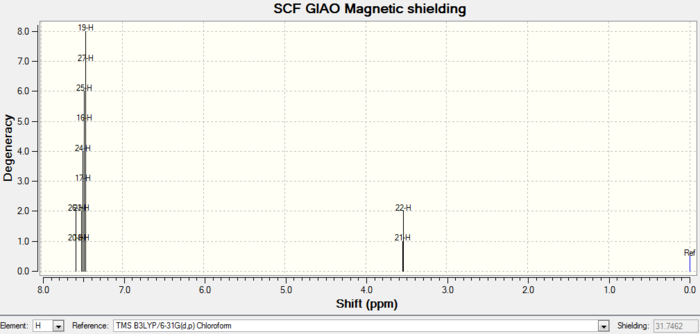
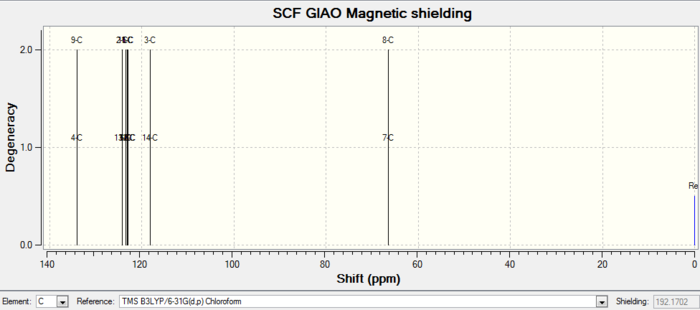
Molecules 17 and 18 are derivatives from molecules 9 and 10 above. For isomer 18, the structure is optimized, and 1H and 13C spectra are simulated using gaussian. 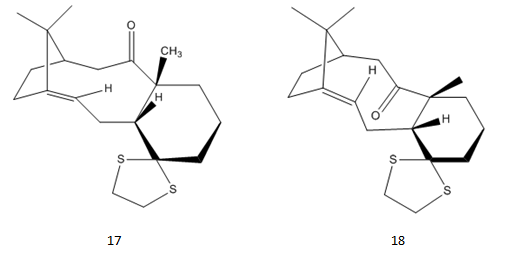
| Molecule 17 | Molecule 18 | |||||||
|---|---|---|---|---|---|---|---|---|
| Jmol image |
|
| ||||||
| Bond stretching energy kcal/mol | 15.89829 | 14.44122 | ||||||
| Angle bending energy kcal/mol | 35.38739 | 28.81334 | ||||||
| Torsion kcal/mol | 14.35822 | 13.37805 | ||||||
| van der Waals kcal/mol | 53.68261 | 50.45971 | ||||||
| Electrostatic kcal/mol | -7.12920 | -6.21523 | ||||||
| Total energy kcal/mol | 113.98747 | 102.38268 | ||||||
| Sum of electronic and thermal free energies /hartree | -1651.446638 | -1651.462758 |
| Images | |
|---|---|
| 1H NMR | 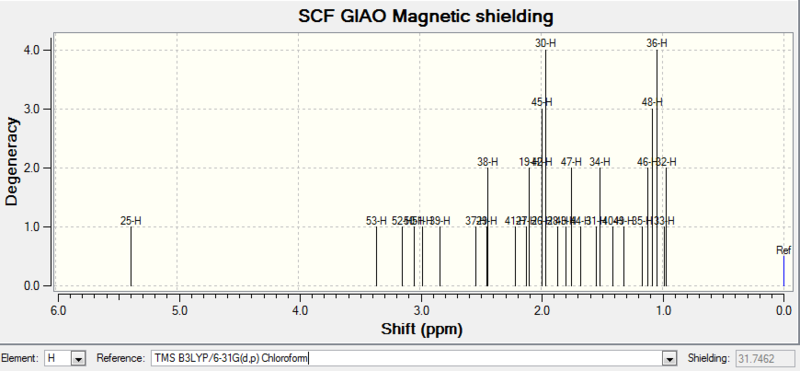
|
| 13C NMR | 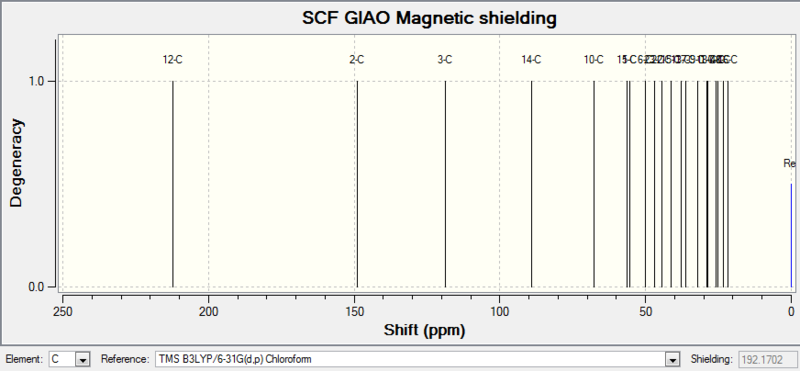
|
| Atom number | Chemical shift | Integration | Reference values (300 MHz, C6D6 ) |
|---|---|---|---|
| 25-H | 5.3799000000 | 1 | 5.21 (m, 1 H), 3.00-2.70 (m, 6 H), 2.70-2.35(m, 4 H), 2.20-1.70 (m, 6 H), 1.58 (t, J = 5.4 Hz, 1 H), 1.50-1.20 (m, 3 H), 1.10 (s, 3 H), 1.07(s, 3 H), 1.03 (s, 3 H) |
| 53-H | 3.3549000000 | 1 | |
| 52-H | 3.1421000000 | 1 | |
| 50-H | 3.0461000000 | 1 | |
| 51-H | 2.9783000000 | 1 | |
| 39-H | 2.8347000000 | 1 | |
| 37-H | 2.5414000000 | 1 | |
| 29-H | 2.4458000000 | 1 | |
| 38-H | 2.4396000000 | 2 | |
| 41-H | 2.2127000000 | 1 | |
| 27-H | 2.1244000000 | 1 | |
| 19-H | 2.0957000000 | 2 | |
| 26-H | 1.9936000000 | 1 | |
| 42-H | 1.9921000000 | 2 | |
| 45-H | 1.9888000000 | 3 | |
| 30-H | 1.9628000000 | 4 | |
| 28-H | 1.8624000000 | 1 | |
| 43-H | 1.7942000000 | 1 | |
| 47-H | 1.7491000000 | 2 | |
| 44-H | 1.6772000000 | 1 | |
| 19-H | 2.0957000000 | 2 | |
| 31-H | 1.5435000000 | 1 | |
| 34-H | 1.5162000000 | 2 | |
| 40-H | 1.4073000000 | 1 | |
| 49-H | 1.3150000000 | 1 | |
| 35-H | 1.1656000000 | 1 | |
| 46-H | 1.1176000000 | 2 | |
| 48-H | 1.0804000000 | 3 | |
| 36-H | 1.0476000000 | 4 | |
| 33-H | 0.9840000000 | 1 | |
| 32-H | 0.9728000000 | 2 |
| Atom number | Chemical shift | Integration | Reference values (75 MHz, C6D6 ) |
|---|---|---|---|
| 12-C | 212.2430000000 | 1 | 211.49, 148.72, 120.90, 74.61, 60.53, 51.30, 50.94, 45.53, 43.28, 40.82, 38.73, 36.78, 35.47, 30.84.30.00, 25.56, 25.35, 22.21, 21.39, 19.83 |
| 2-C | 148.8953000000 | 1 | |
| 3-C | 118.5509000000 | 1 | |
| 14-C | 89.0565000000 | 1 | |
| 10-C | 67.5747000000 | 1 | |
| 11-C | 56.3146000000 | 1 | |
| 5-C | 55.5376000000 | 1 | |
| 6-C | 50.0936000000 | 1 | |
| 23-C | 46.8216000000 | 1 | |
| 22-C | 44.4718000000 | 1 | |
| 15-C | 41.2998000000 | 1 | |
| 13-C | 37.6775000000 | 1 | |
| 17-C | 36.2823000000 | 1 | |
| 9-C | 32.0825000000 | 1 | |
| 18-C | 29.0650000000 | 1 | |
| 1-C | 28.6982000000 | 1 | |
| 7-C | 25.8648000000 | 1 | |
| 4-C | 25.2119000000 | 1 | |
| 8-C | 23.2836000000 | 1 | |
| 16-C | 21.7432000000 | 1 |
Comment on NMR spectra: the calculated values generally agree well with experimental data, with some differences in integration numbers. This could be caused by peaks merging together during measurements due to similar chemical shifts. Therefore each hydrogen or carbon cannot be read separately.
From the energy values we can see that molecule 18 has lower energy. This could be the reason why 17 can be completely changed into 18. But due to similarity in energy values, the process takes a long time, and energy need to be put in.
Analysis of the properties of the synthesised alkene epoxides
Molecule 21
The pre-catalyst 21 is used in the Shi asymmetric Fructose catalysis.
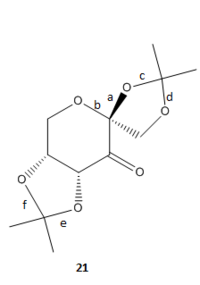
It is searched in the Cambridge crystal database (CCDC) to obtain information about bond lengths in this molecule. Two molecules are found in Mercury.
test molecule |
C-O bond lengths (with O-C-O substructures) are labelled.
Typical C-O bond length is 1.43 Å [3]. The difference in bond lengths in this molecule can be explained by enomeric effect[4]. The lone pair on the oxygen in the 6-membered ring donates to the anti-periplanar antibonding σ* orbital of the C-O bond (bond a). This results in shortened bond length in bond a. For bonds f and e, where enomeric effect doesn't possess, bond lengths are longer and close to normal C-O bond length value.
Molecule 23
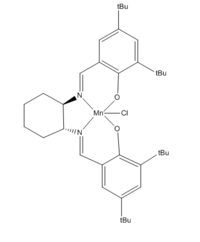
The stable pre-catalyst 23 is used in the Jacobsen asymmetric catalysis. Two molecules are found in Mercury.
test molecule |
Within the distance of 2.4 Å, molecules would have interactions. However repulsive interactions occur within 2.1 Å [3].For molecule 23, from the labelled through space distances we can see that only 1 out of the 4 labelled bonds has disfavoured interactions. Therefore overall the molecule can be considered as stabilized.
Analysis of styrene and stilbene epoxides
Styrene epoxide (1) (R conformer)
test molecule |
NCI (non-covalent-interaction) analysis 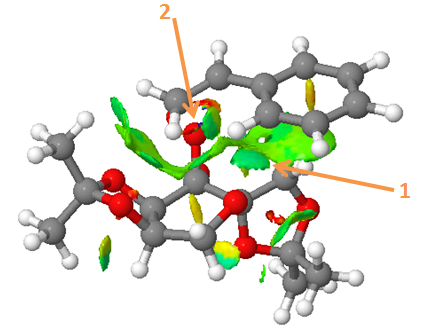
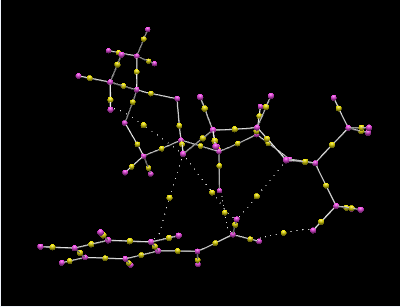
Arrow 1 points to the attractive interaction between styrene and the catalyst 22.
Arrow 2 points out the bond that is formed in the transition state between the two molecules.
Electronic topology (QTAIM)
The solid lines with a yellow dot in the middle indicates a BCP (bond critical point).
The dashed line with a yellow dot in the middle indicates a non-covalent BCP (eg. between hydrogen and oxygen).
Styrene epoxide (2) (S conformer)
test molecule |
Trans-stilbene epoxide(RR)
test molecule |
Trans-stilbene epoxide (SS)
test molecule |
| R-Styrene | S-Styrene | RR-Stilbene | SS-Stilbene | |
|---|---|---|---|---|
| Calculated value / deg | 48.89 | -30.39 | 298.01 | -298.06 |
| Literature value / deg | 44.8[5] | -33.2[6] | 361.0[7] | -205.2[8] |
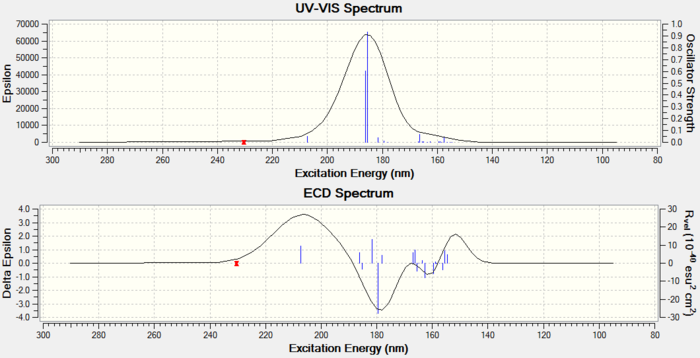
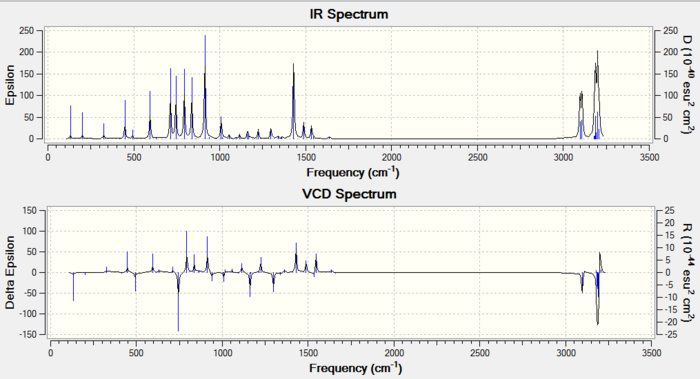
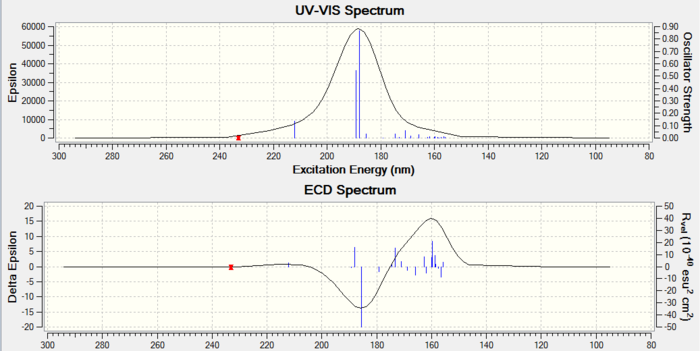
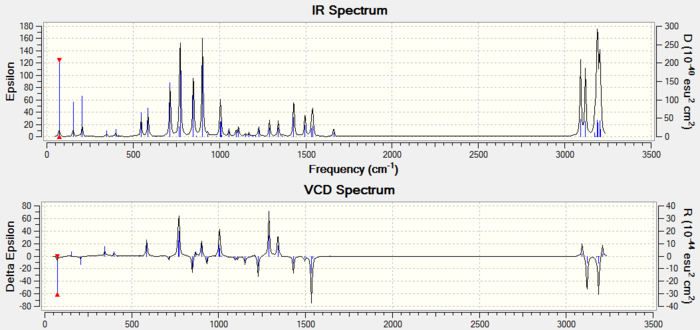
Analysis: The optical rotation values for R and S conformers of styrene and stilbene both show similar values with opposite signs. This is a signature of different conformers existing. Also the values calculated match the experimental values. ECD spectra are measured but in this case this technique is actually useless due to lack of chromophore in epoxides. For VCD spectra, since there are no experimental values to be compared to, no further analysis can be carried.
Using the calculated properties of transition state for the reaction
| R-Styrene | S-Styrene | RR-Stilbene | SS-Stilbene | |
|---|---|---|---|---|
| Total energy / kcal/mol | 23.90614 | 24.54131 | 44.66384 | 44.66336 |
Styrene[9]
| R /hartree | S /hartree | Difference /hartree | Energy in j/mol | K | enantiomeric excess |
| -1303.730703 | -1303.733828 | 0.003125 | 8203.126562 | 0.036549452 | 0.035260693 |
| -1303.730238 | -1303.724178 | -0.00606 | -15907.50303 | 612.1550372 | 0.998369091 |
| -1303.736813 | -1303.727673 | -0.00914 | -23992.50457 | 15969.30616 | 0.999937384 |
| -1303.738044 | -1303.738503 | 0.000459 | 1204.87523 | 0.615057815 | 0.380827119 |
Trans-stilbene[10]
| RR /hartree | SS /hartree | Difference /hartree | Energy in j/mol | K | enantiomeric excess |
| -1534.687808 | -1534.68344 | -0.004368 | -11466.00218 | 102.0346414 | 0.990294526 |
| -1534.687252 | -1534.685089 | -0.002163 | -5677.876081 | 9.879077234 | 0.908080439 |
| -1534.700037 | -1534.693818 | -0.006219 | -16324.87811 | 724.4060173 | 0.998621462 |
| -1534.699901 | -1534.691858 | -0.008043 | -21112.87902 | 4998.040213 | 0.999799962 |
Jacobsen catalyst[11]
| S,R /hartree | R,S /hartree | Difference /hartree | energy in j/mol | K | enantiomeric excess |
| -3383.259559 | -3383.25106 | -0.008499 | -22309.87925 | 8100.3572 | 0.999876564 |
| -3383.253442 | -3383.25027 | -0.003172 | -8326.501586 | 28.75632659 | 0.966393701 |
| S,S /hartree | R,R /hartree | ||||
| -3383.262481 | -3383.253816 | -0.008665 | -22745.62933 | 9657.037968 | 0.999896459 |
| -3383.257847 | -3383.254344 | -0.003503 | -9195.376751 | 40.82752619 | 0.976092299 |
(K= exp(-ΔG/RT), enatiomeric excess= K/(1+K)[12])
| R-styrene | RR-stilbene |
|---|---|
| 75%[5] | 99%[7] |
Experimental data generally agrees with the enatiomeric excess (ee) calculated from the data given, with the calculated ee being a bit higher. This may be due to some factors which computational calculations don't include. (eg. solvent,temperature, pressure).
Suggested new candidate for investigation
(1R,4R,5R,9S)-4,5-epoxy-8-hydroxy-14-caryophyllanal[13]
Experimental conditions:
Concentration: 1g/100ml Solvent: CHCl3
| Wavelength | 589 | 578 | 546 | 436 | 365 |
|---|---|---|---|---|---|
| α | -148.6o | -153.2o | -174.8o | -309.3o | 525.0o |
References
- ↑ W. F. Maier, P. Von Rague Schleyer, J. Am. Chem. Soc., 1981, 103, 1891.DOI:10.1021/ja00398a003
- ↑ Spectroscopic data: L. Paquette, N. A. Pegg, D. Toops, G. D. Maynard, R. D. Rogers, J. Am. Chem. Soc.,1990, 112, 277-283 DOI:10.1021/ja00157a043
- ↑ 3.0 3.1 CRC Handbook of Chemistry and Physics 65Th Ed.
- ↑ R. U. Lemieux, S. Koto, and D. Voisin,"The Exo-Anomeric Effect",ACS Symposium Series 1979, 87, 17-29.DOI:10.1021/bk-1979-0087.ch002
- ↑ 5.0 5.1 Kuladip Sarma et al., "A novel method for the synthesis of chiral epoxides from styrene derivatives using chiral acids in presence of Pseudomonas lipase G6 [PSL G6] and hydrogen peroxide", Tetrahedron, 2007, 63,735–8741 DOI:10.1002/chin.200751136
- ↑ E. J. Corey et al, "An Efficient and Catalytically Enantioselective Route to (S )- (-)-Phenyloxirane", J Org Chem, 1988, 53,2861-2863 DOI:10.1021/jo00247a044
- ↑ 7.0 7.1 Philip C. Bulman Page et al, "Asymmetric organocatalysis of epoxidation by iminium salts under non-aqueous conditions", Tetrahedron, 2007, 63,5386–5393DOI:10.1021/jo035820j
- ↑ Niwa,Takashi and Nakada,Masahisa;Journal of the American Chemistry, 2012, 134, 13538-13541 DOI:10.1021/ja304219s
- ↑ DOI:10.6084/m9.figshare.822152 DOI:10.6084/m9.figshare.823545 DOI:10.6084/m9.figshare.828520 DOI:10.6084/m9.figshare.822136 DOI:10.6084/m9.figshare.822135 DOI:10.6084/m9.figshare.828519 DOI:10.6084/m9.figshare.822137 DOI:10.6084/m9.figshare.826003
- ↑ DOI:10.6084/m9.figshare.828552 DOI:10.6084/m9.figshare.829524 DOI:10.6084/m9.figshare.830388 DOI:10.6084/m9.figshare.829525 DOI:10.6084/m9.figshare.829522 DOI:10.6084/m9.figshare.830389 DOI:10.6084/m9.figshare.829523 DOI:10.6084/m9.figshare.830390
- ↑ DOI:10.6084/m9.figshare.740436 DOI:10.6084/m9.figshare.740437 DOI:10.6084/m9.figshare.783851 DOI:10.6084/m9.figshare.783898 DOI:10042/25945 DOI:10.6084/m9.figshare.856649 DOI:10.6084/m9.figshare.856650 DOI:10.6084/m9.figshare.856651
- ↑ Schneebeli et al. "Quantitative DFT modeling of the enantiomeric excess for dioxirane-catalyzed epoxidations", J Am Chem Soc., 2009, 131(11),3965–3973 DOI:10.1021/ja806951r
- ↑ Abraham, Wolf-Rainer; Ernst, Ludger; Arfmann, Hans-Adolf Phytochemistry (Elsevier), 1990,29,757-763DOI:10.1016/0031-9422(90)80013-7

