Rep:Mod:nsolomon2
Module 2
- Please note that any changes after 5pm will solely be regarding the addition of extra literature references***
Objectives
The objective of this computational experiment will be to explore the physical and electronic structure of molecules by performing Gaussian geometry and energy optimisations. The first part of this experiment will be based on exploring the nature of two trigonal planar molecules by obtaining an energy minimum and verifying this minimum with frequency analysis. With the aid of non bonding orbital (NBO) analysis we will generate the molecular orbitals for the molecules of interest and compare them to that predicted from LCAO. This will then lead us to investigating a more complex organometallic octahedral complex.
In the second part we will undertake a mini research project to investigate a AlCl2Me2 bridging dimer and rationalise with energy calculations and MO analysis which is the most stable form.
Throughout the experiment we will constantly be assessing the limitations advantages of using such computational techniques.
Part 1 - Introduction to Computational techniques
BH3
Firstly, an attempt to energetically optimise a BH3 molecule will be made. This will be done by adopting the Bohn-Oppenheimer approximation and assuming a given position for the nuclei and solving the Schrödinger equation for the electron density and the electrons. The force is the first derivative of the potential energy so at a given position there is a given potential energy with a given force. This force is applied to the molecule in iterative steps targeted to reaching the minimum energy. This point corresponds to the minimum equilibrium geometry on a potential energy diagram where the total force on the molecule sums to zero. This gives us the optimised geometry; i.e. that which is found in the gas phase. The lowest energy geometry is the most probable geometry and once this geometry is obtained physical properties of the molecule will be obtainable. It is important to note that the starting geometry will influence the final geometry. If for example we begin from a very unfavourable geometry we may not necessarily obtain the lowest energy geometry as there is a limit to the computational time dedicated to each calculation. For this reason we will begin from a trigonal planar geometry for BH3 with arbitrary bond length of 1.50A.
We will be using the computational chemistry software program Gaussian to compute this optimisation (along with other calculations such as frequency or vibrational calculations). The chief method used for most calculations is based on density functional theory (DFT), specifically B3LYP. The basis set for this optimisation will be 3-21G. The .gjf input file is to be created in Gaussian and the output to be analysed will be a .log file. A summary of the calculation is shown below.
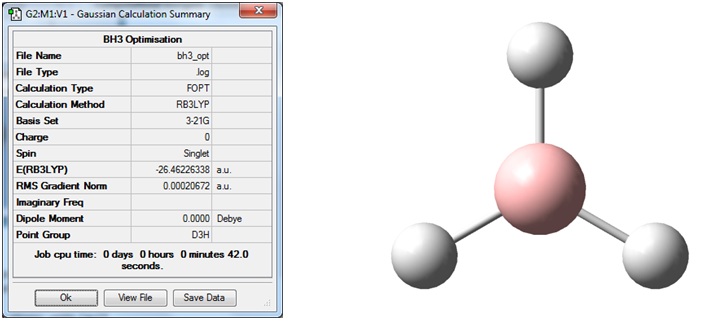
The first thing to notice is that the RMS gradient is effectively zero (less than 0.001) and that the calculation has converged. (see .log file). This means that we have reached a stationary point, the energy minimum of the potential energy diagram. The result gave a bond length r =1.193A and a bond angle 120deg.; this is in agreement with the literature value of 1.867A [1] and the expected angle form a trigonal planar geometry. The dipole moment is zero as expected as the molecule is perfectly symmetric. The energy quoted is an absolute energy and is only of useful for comparison to different conformations/configurations of BH3. A graphical representation of the optimisation process (4 cycles in this case) is shown below:
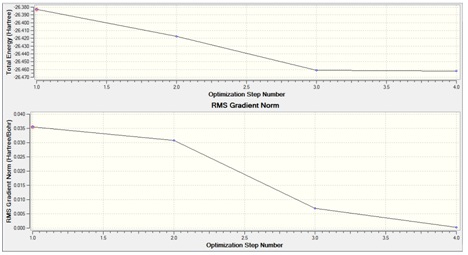
The first graph gives the energy at each of the steps in the calculation and the second graph the associated gradient. Clearly we begin fairly close to the minimum and the gradient decreases the quickest between steps 2 and 3 indicating the largest change to our molecule. The final slope of the gradient is negative indicating an energy minimum has been obtained.
An interesting feature of this calculation is that Gaussian started the process from a bondless molecule. This is because the programme draw bonds based on a distance criterion. This does not mean the bonds do not exist. The definition of a bond is not based of distance but more so on electron density. We may say a bond is a region of high electron density between two atoms leading to an electromagnetic force of attraction between the atoms.
By solving the electronic structure we generate the MOs of the molecule. The computed orbitals are represented next to the theoretical diagrams based on LCAO below:
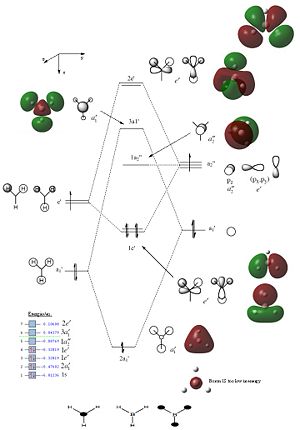
The computed MOs are a consistent with those predicted by LCAO. They however show a more delocalised and perhaps realistic picture of the electronic structure. Specifically, for the 2a1’ orbital there is a completely delocalised LCAO. Notice that there is a lower energy non-bonding orbital corresponding to the Boron 1s orbital too low in energy to bond with hydrogen; lower in energy by 14982.0 kJ/mol. For the anti-bonding orbitals the repulsion between the out of phase lobes is highlighted more explicitly than in a simple graphical representation. If we consider the 3a1’ orbital we do not see any difference in size between the various orbital contributions. For anti-bonding orbitals we would expect less electron density on the more electronegative atom (in this case hydrogen) and therefore a smaller orbital. However this is not represented in the calculated MO and highlights a key limitation of this approach. However on the whole qualitative MO theory is shown to be very accurate and useful in predicting the MOs for molecules.
We will now carry out a Natural Bond Orbital Analysis (NBO). This separates the electron density of the molecule and places it in atomic orbitals to give 2c-2e bonds. Gaussview may also be used to show the formal charges on the atoms. Also, by analysing the output we may see the various contributions from the s and p orbitals for BH3.

The result makes good sense. The more electronegative hydrogen is assigned the negative charge and the boron the positive charge. As there are three hydrogens to each boron atom we see that the negative charge is one third less. i.e. 0.066:0.198. By considering the orbital contributions we see for example in orbitals 1,2 and 3 (i.e. 2a1’ and 2x1e’) that 47% of a B-H bond is made up of the boron hybridisation of 33%s+67%p and the other 53% is made from the H 100%1s. Orbital 4 corresponds to the core non bonding boron 1s orbital. Intuitively, the above percentages correspond well to the MO diagram.
We will now undertake some frequency analysis on BH3 to find the vibrational modes and predict the IR spectrum. The frequency analysis is based on finding the second derivative of the potential energy curve. If all the frequencies obtained are positive we have an energy minimum and if there is one negative frequency we find a transition state. The analysis was carried out on the optimised BH3 structure and the energy output obtained was identical indicating a successful calculation. The following output was obtained:
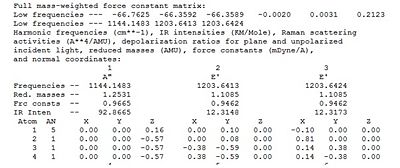
The first 3 low frequencies are negative raising suspicion as to whether our calculation was correct. However, after evaluation BH3 is a relatively simple molecule and it is extremely unlikely a transition state has been found, as the only changes to the molecule have been changes in bond length and not angles. Also it is reasonable to observe some unusual results as the hydrogens are very light and will give large frequencies. We may therefore say that we are dealing with an energy minimum. The 6 low frequencies (quote) are related to the non-vibrational degrees of freedom, 3 translational and 3 rotational; hence molecule has 3N-6 vibrational frequencies. The other frequencies correspond to the stretching or bending modes of the molecule which are summarised below:
From this we see the higher energy stretches at 2598cm-1 and 2737cm-1; notice that this stretch is degenerate and consistent with the assignment of the e” symmetry label. The IR spectrum is shown below:

We observe less than the 3N-6 stretches expected, where N=4. The degenerate stretches at 2737cm-1 and 1203cm-1 mean that there are 2 less stretches observed in the IR spectrum. Interestingly the totally symmetric stretch at 2598cm-1 has zero intensity and is therefore not observed. The intensity is related to the dipole moment of the molecule. As the 2598cm-1 stretch has an overall dipole moment of zero, the intensity is expected to be zero too.[2]
TlBr3
We will now extend our investigation to TlBr3 attempt to optimise the geometry. TlBr3 has many more electrons (81/Tl and 35/Br) than say a much simpler molecule such as BH3. Also the atoms are much heavier and relativistic effects may be experienced by core electrons which is difficult to factor into the Schrödinger equation. However, we may model purely based on the valence electrons as it is these that contribute to the bonding interactions. For this we need to establish a pseudo-potential and improve our basis set to account for more complex electronic structure. The basis set chosen is a balance between the best description of electronic structure and the computational time constraints encountered when dealing with larger sets. A good choice for this calculation is LanL2DZ which uses a “medium” sized basis set on first row atoms and pseudo potential for heavier atoms. Generally an increased basis set gives better fitting functions to more intricate systems. Again the method of choice will be the DFT- B3LYP. We begin from a trigonal planar structure with restricted D3h symmetry. We restrict the symmetry to ensure a good quality of results and no “splitting” of frequencies, analogous to reducing the error. Following optimisation we obtain the following:
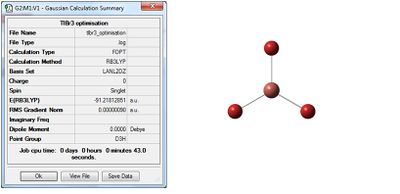
Media:TLBR3_OPTIMISATION_nfs.LOG
Why must we use the same method and basis set for both calculations? Why do we have to carry out a frequency analysis?
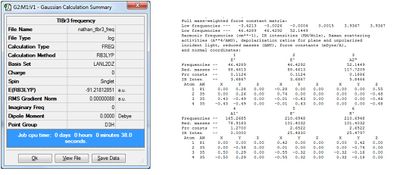
As discussed the frequency analysis enables us to distinguish between transition states and ground states to confirm that we do indeed have a minimum geometry. For this reason when undertaking frequency analysis we must keep the method and basis set the same to obtain the same energy; this can be viewed as a control that the calculation has worked well and that we are working from an energy minimum; it makes little sense to perform frequency analysis on un-optimised structures. Frequency analysis is also useful for computing the stretching and bending modes of molecules as seen for BH3. This will prove invaluable in verifying experimental evidence. Therefore for TlBr3 we maintain the same DFT- B3LYP method and LanL2DZ basis set.
| Number | Vibrational form | Frequency | Intensity | Symmetry Point Group D3h |
|---|---|---|---|---|
| 1 |  |
46 | 3.7 | E' |
| 2 |  |
46 | 3.7 | E' |
| 3 | 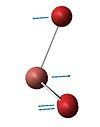 |
52 | 5.8 | A2" |
| 4 |  |
165 | 0.0 | Totally symmetric A'1 |
| 2 |  |
210 | 25.5 | E' |
| 2 |  |
210 | 25.5 | E' |
The IR spectrum corresponding to these stretches and bends is shown below:
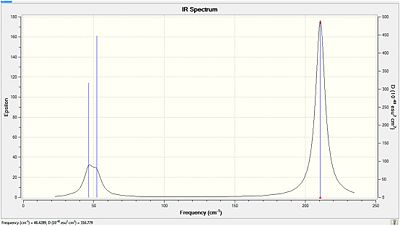
The first thing to note is that although the stretching and bending modes are very similar to BH3 the frequencies are very low in energy in comparison. This may be accounted for by the fact that the atoms are much heavier and result in short frequencies with larger amplitudes. This is analogous to varying the mass on a spring. The totally symmetric (dipole=0D) stretch at 165.27cm-1 has the expected intensity of zero and is not observed. The degenerate bends at 46.43cm-1 overlap with the bend at 52.14cm-1 reducing the number of peaks observed. The other two degenerate vibrations at 210.69cm-1 correspond to asymmetric stretches which are naturally higher in energy than the bends.
Error
To every computation there is an associated error with the calculation. In this experiment we observe the following: For frequencies there is ana associated 10% error so these are only quoted to the nearest whole number. For atomic units there is an error of ca 0.004 a.u. Additionally: Dipole moments are only accurate to 0.01D Bond angles only accurate to 0.1° and bond distances to 0.01 Å Also note that comparing energies only makes sense for structures with exactly the same number of each atom.
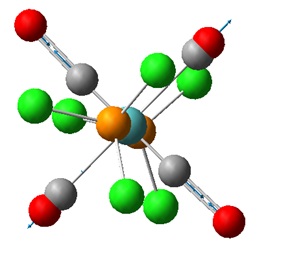
Mo(CO)4Cl2
We will now calculate the vibrational spectra of Mo(CO)4Cl2 and examine the discrepancies between the cis and trans isomers. We will aim to answer why experimentally the former has 4 CO stretches whereas the trans isomer has only one CO stretching frequency. As a consequence of the investigation we will also be able to predict which isomer is the most stable.
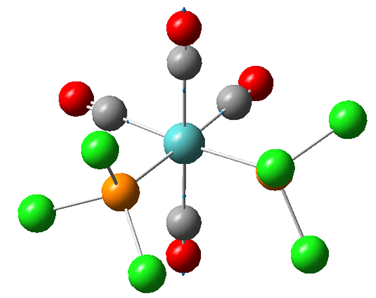
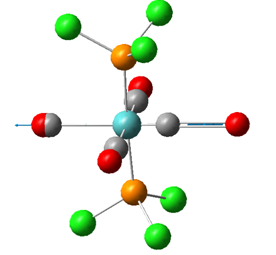
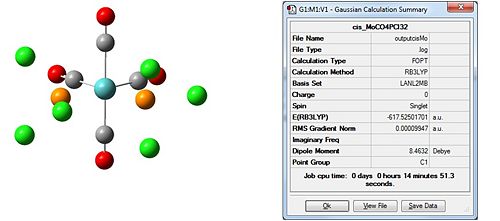
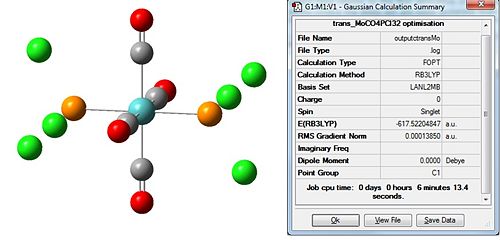
The first thing to do will be to optimise the molecule. We will use a low level basis set and pseudo-potential like LANL2MB for similar reasons to TlBr3 except this time the molecule is more complex; hence the low level basis set. We will add an additional keyword to the calculation, “opt=loose”, to ensure the calculation convergence (first derivative of energy) is reached as the basis set is not that good. Again, for reasons discussed, bonds are missing in the output:
 |
 |
DOI:10042/to-6971 DOI:10042/to-6970
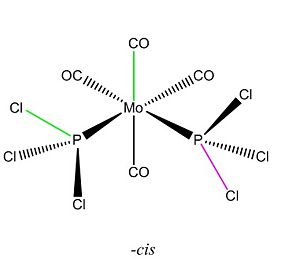
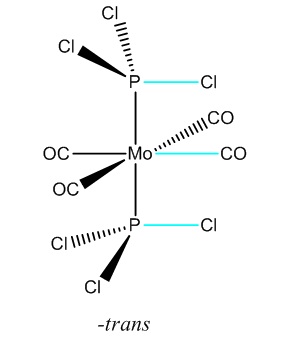
The dipole moment is zero as expected for the trans and 9.4632D for the cis isomer. Initial inspection of the energies deems the cis isomer more stable by 7.7939kJ/mol. This is unusual as we would expect the trans- isomer to be more stable due to an obvious decrease steric hinderance; however the we are unable to make a conclusive statement based on this as this is within the computational error of 10kJ/mol. Typically for a cis-tans isomerisationwe would expect an energy difference of at least ca 30kJ/mol. The dihedral angles need refinement and for this reason we choose to re-optimise the structure from this start point to obtain an even lower energy minimum. For this we will the same method but use the larger LANL2DZ pseudo-potential and basis set. This much better basis set will require convergence so we include “int=ultrafine scf=conver=9 in” the additional keywords to tighten the convergence criteria. We change the dihedral angles for the cis and trans isomers as follows:
 |
 |
DOI:10042/to-6972 DOI:10042/to-6973
Again the –cis isomer has been found to be the most stable by ca. 8kJ/mol and again we are unable to make a conclusive statement based on this, as this is within the computational error of 10kJ/mol. This raises questions as to whether we have included all the interactions an our basis set is comprehensive enough? Our log file gives a clue as to why we observe the above.
Warning! P atom 10 may be hypervalent but has no d functions.
Warning! P atom 11 may be hypervalent but has no d functions.
We will therefore extend the investigation to include the d-orbitals by adding extrabasis to our keywords and including the D-function and its decay rate in the input file.
The resulting output gives the following summary:

DOI:10042/to-6974 DOI:10042/to-6975
Energy difference = 3.3 kJ/mol – trans favoured
Clearly this energy difference is not large enough to distinguish between the two molecules. The results are however improved in that the –trans isomer is lower in energy than the –cis isomer. We may theretofore conclude that Cl is not a good enough substitution for PPh3 ligands. Interestingly, what changes can we make to the ligand L=PR3 that could potentially alter the relative ordering of the cis and trans isomers? We could investigate the energies with smaller ligands which may result in the –cis being lower than the –trans isomer as steric factors are no longer an issue. Also if the ligand is a bridged ligand,i .e. an alkyl bridges the two phosphorous atoms we will contain the geometry to the –cis isomer.
TIME CONSTRAINT:(Additional discussion required trans effect, NBO analysis and dipole moment)
Compute frequency analysis with same basis set and method for structures (d-orbital included):

DOI:10042/to-6976 DOI:10042/to-6977
All the frequencies for the cis and trans isomers are positive except for some of the low frequencies, which are as a result of computational difficulties inherent within the program. These are within 5cm-1 so we may still say that we have reached a minimum.
Geometry
|
Bond length/ Å |
P-Cl |
CO |
Mo-P |
Mo-CO |
|
-cis |
2.115 |
1.175 |
2.476 |
2.021 |
|
-trans |
2.118 |
1.174 |
2.422 |
2.056 |
Angles cis – dihedral = -6.97°, -6.8°
Angles trans – dihedral = 0.1°, 0.2°
Literature CO stretch for -cis = 1986, 1994, 2004, 2072 cm-1 [3] and for the -trans 1896cm-1 [4]
Links for non d-ob freq calc.:DOI:10042/to-6978 andDOI:10042/to-6979
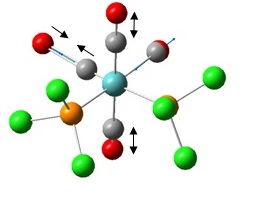
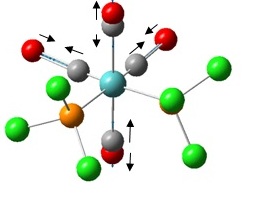
Firstly considering the vibrations including the d-orbitals, for the –cis isomer there are 4 stretching modes for the carbonyl ligands. In comparison to the –trans isomer there is essentially only 1 (doubly degenerate) CO stretching mode as the stretches at 1966cm-1 and 2056cm-1 are extremely weak in intensity in comparison and are not observed. The reason for this difference in the number of peaks may b attributed to the symmetry properties of the two isomers. The –trans isomer has more vibrations that don’t result in changes in the dipole moment as it is overall more symmetric than the –cis isomer. Fewer changes in the dipole moment essentially mean less peaks! The results are in reasonable agreement with the literature quoted above. A finer basis set would perhaps improved upon this.

Comparing the above to the more simple calculation excluding the d-orbital participation we see that CO frequencies are lower in energy. This supports the notion that d-orbitals allows backbonding from the metal centre to the CO pi* thus lowering the energy of the CO bond.
Further comments:
Low frequency vibrations:
an example of a low frequency rocking vibration is shown below for the cis-isomer. The vibration stands at 10cm-1
Vibration |
If a vibration/rotation has a very low energy, ie a very low frequency, what do you think is happening at room temperature?
Gaussian compute all the vibrational modes of the molecule at 0K. However, this does not mean all modes are active at 0k. We would expect that increasing the energy will result in more activated vibrational modes. Therefore it is likely we would observe activated low frequency modes at rt. Higher energy modes would require a higher temperature.
Notes of the keywords used so far:
What does Opt=loose signify?
In minimisation we change the structure until there is no change in energy. By setting "opt = loose" we increase the threshold of “differences in energy” as the basis set is not that good fitting/refined.
"Cartesian" – changing geometry by coordinate and not by connectivity
"Cycle = 50" – maximum of 50 cycles
"Ultrafine" – Gaussian uses ultrafine grids for evaluating integrals.
"Scf=conver=9" - On cycles of calculating charge density from the Schrödinger equation we are more precise about which charge densities are classified as “the same”. Essentially this means better results.
Vibrational Analysis
"To be infrared active a vibrational mode must produce a dipole moment change. IR active modes are those that have the same symmetry as the dipole moment, which has the same symmetry as the translational vectors {Tx, Ty, Tz}", see http://www.huntresearchgroup.org.uk/teaching.html
Assuming the ligands are symmetrtical:
For the –cis isomer the point group is C2v. The IR active CO modes are 2a1, b1 and b2 thus predicting 4 peaks in the IR spectrum. This is how this was calculated:
|
|
|
|
|
|
|
|
|
|
|
|
|
|
|
|
|
|
|
|
|
|
|
|
|
|
|
|
|
|
Similar analysis for the –trans isomer with point group: D4h, the IR active mode is eu, which is degenerate infering two overlapping peaks.
Part 2 Mini Project
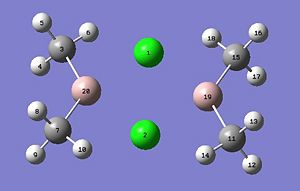
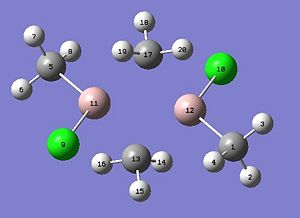
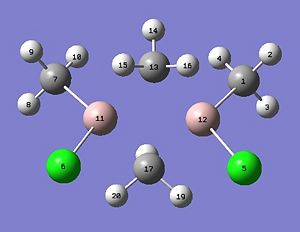
We will now extend our work to consider AlMe2Cl which exists as a dimer at room temperature (shown below). The dimer exists as the trivalent aluminium requires alleviation of electron deficiency. The structure is in equilibrium with several other isomers through intramolecular exchange in a Schlenk like equilibrium. We will aim to find out which structure(s) is more energetically stable? This will be rationalised through analysis of the relative energies, computation of the vibrational frequencies and NBO analysis. We will also calculate the molecular orbitals and see whether they match the theory.

Each of the four structures above will be subject to the following calculations:
1.Optimisation
For reasons discussed with TlBr3, as Aluminium is relatively a reasonably “heavy atom” a pseudopotential will need to be applied. A good choice of method is the DFT-B3YLP and for the basis set LanL2DZ which uses a “medium” sized basis set on first row atoms and pseudo potential for heavier atoms. Note, many attempts were made at using the smaller sized basis set LANL2MB, setting a loose optimisation and maximum cycle of 50, but calculations resulted is large deviations from the original structure so when LanL2DZ basis was applied to this a completely different structure was obtained. A very interesting result was observed with the mixed bridged structure which illustrates this nicely:

The LANL2MB calculations can be viewed below:
DOI:10042/to-6986
DOI:10042/to-6987 DOI:10042/to-6989 DOI:10042/to-6990
The consequent LANL2DZ calculations which were not later used: DOI:10042/to-6991 DOI:10042/to-6992 DOI:10042/to-6993 DOI:10042/to-6994

This shows that LANL2MB is too crude for this calculation where the initial geometry is important. There is a possibility that there is a small minimum which the basis set is too crude to accommodate for and hence the optimisation just passes over to the lower energy minimum. Therefore, if we want to investigate the structures shown above we will have to proceed with LanL2DZ throughout providing the initial geometry is reasonable.
1. 2.Frequency analysis
An identical method and basis set is used to compute the vibrational modes of the isomers.
2. 3.Single point energy calculation and NBO
The structure is then freezed and a single point calculation is carried out on the optimised structure to find the total electronic energy. Here we calculate the electron density to compute the MOs and NBO charges on the molecule. We stick with the B3YLP method but this time use a 6-31g(d) method which is a more complete basis set as it will incorporate additional diffuse orbitals to the calculation, appropriate for the computation of MOs.
Optimisation - Al2Me2Cl2 summary
All calculations converged with RMS gradient = 0.00 indicating energy minima were obtained.
| Structure | Al-Cl / Al-Me bond length/A | Bridging angle/ ° | Absolute energy/a.u. | Dipole/D |
|---|---|---|---|---|
| Cl bridged | 2.477 | 94.7 | -193.7308 | 0.00 |
| Me bridged – trans | 2.168 | 75.9 | -193.6920 | 0.00 |
| Me bridged - cis | 2.159 | 76.1 | -193.6906 | 5.578 |
| Mixed bridge |
2.412(Al-Cl) 2.426(Al-Me), AlCl side: 2.475(Al-Cl) 2.062(Al-Me) |
79.6,88.0 | -193.7022 | 5.237 |
DOI:10042/to-6997 DOI:10042/to-6999 DOI:10042/to-7000 DOI:10042/to-7003
In order of stability we have Cl bridged > Mixed bridged > Me-bridged trans > Me-bridged cis. The Cl bridged structure is 75.20157 kJ/mol more stable than the mixed bridge and 101.90422 kJ/mol more stable than the Me bridged structure. This is consistent with chemical intuition. The me-bridged trans is 3.598169 kJ/mol more stable than the me-bridged cis structure; however not much can be said about this as it is within the computational error of ~10kJ/mol. However intuitively we would expect the trans to be more stable than the cis isomer due to sterics and a overall dipole moment of zero.
Why is the Cl bridged structure so much more stable than the mixed bridge or me-bridged structure?
Initial guess would suggest that this is the case due to the nature of the bridging bonds. Shriver and Atkins [5] suggest that the Al-Cl bond is shorter in the bridged structure therefore suggesting a formal 2c2e bond whereas in the mixed or me-bridged structure we have longer bonds with a formal 3c2e bond. (literature Al-Cl length 2.13A [6]. Gaussian calculations do not account for this as they contradict the experimental evidence where the Al-Cl bonds are in fact longer. However what it does suggest is a larger angle of 94.7deg. in the Al-Cl bridged structure indicating less strain on the system. Could the stability be purely based on angular strain?
There is an inclination that the starting geometry (specifically the Al-Al and the bridging bond lengths) has influenced the final Al-Me bond lengths, rendering them shorter than expected and reported by Shiver and Atkins. In the above calculation for the Me-bridged structures we started from Al-Al distance = 2.7A which is shorter than the 3.3A for the Cl- bridged structure. We will investigate whether starting from 3.3A for the Me-bridged structure will influence the final energy giving a different lower energy minimum structure. (see log files)

Media:ALAL_LARGE.gjfMedia:ALAL_LARGE.LOG
A surprising result has been found. The structure has converged to exactly the same structure reported above with the Al-Al distance 2.7A with exactly the same energy of -193.69201114 a.u. This confirms that the above structural properties reported above are in fact computationally correct and contradict the literature! This has exposed a limitation to Gaussian. The shorter literature value for the 2c2e Al-Cl bond may be attributed to Chlorine sharing one electron with aluminium on one side and donating a pair via a dative covalent bond on the other side; something Gaussian cannot predict.
The observed energies cannot be explained by considering the bond length; hopefully NBO and MO analysis will be able to rationalise the above. Notes: Gaussian did accept penta coordinate carbon atoms so the inputs were only bonded on one side of the methyl bridging species. Bonds are missing in the some off the outputs but this may be attributed to the nature of Gaussian classifying bonds on distance criteria as discussed earlier.
Frequency Analysis
We will now attempt to carry out frequency analysis to ensure we are at minima. We can also relate key frequencies to the strength of say the bridging bonds to rationalise the order of stability observed. Initial inspection of the .log files shows that there are no negative frequencies (greater than 5cm-1) and the energies are the same as those from the optimisation, indicating that we are at an energy minimum.
Cl bridged
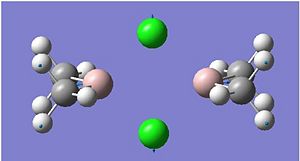
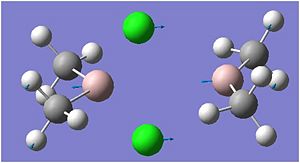
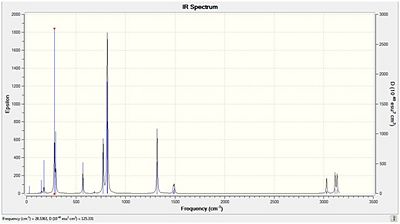
The highest energy bridging Cl vibration is at 297cm-1 however this has zero intensity. Other very low intensity vibrations include 295cm-1 and 203cm-1. These are low in intensity due to the high symmetry of the vibration. The highest intensity bridging vibration is that of 281cm-1. However if we are concerned with the bond strengths we should not be concerned whether it is observed on the IR spectrum, but rather on whether it is possible. 297 and 281 cm-1:
 |
 |
Me bridged
-cis
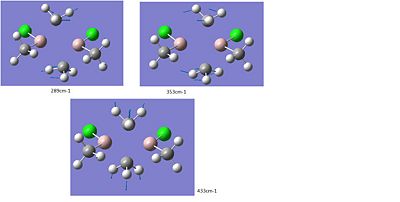

-trans
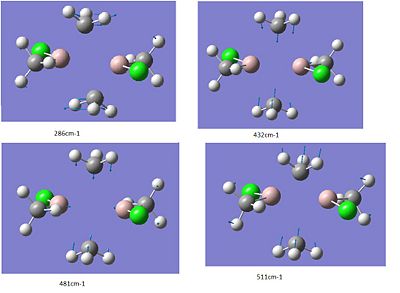
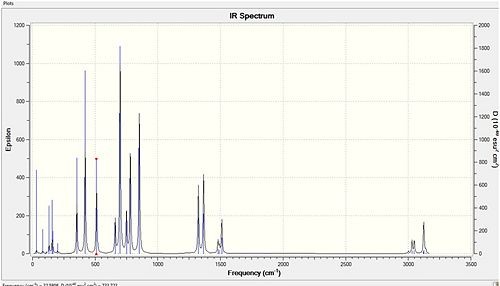
DOI:[http://en.wikipedia.org/wiki/Digital_object_identifier DOI:10042/to-7008 10042/to-70DOI:10042/to-7008 ]
Mixed bridging
The highest energy Al-Cl vibration is at 332cm-1 and for the Al-Me at 294cm-1. Lower energy vibrations include 239cm-1 (synchronised Al-Cl and Al-Me) and 184cm-1 (Me alone).
 |
 |
 |
 |

What can be said from the above frequency analysis?
It is only reasonable compare identical vibrational modes between the structures. This limits what can be said. Focusing on the -Cl bridged and –Me bridged structures we can compare two of the bridging rocking vibrations. The symmetric vibration at 297cm-1 and asymmetric vibration at 281cm-1 for the Cl-bridged structure can be compared with the analogues for the Me-bridged –cis structure’s 433cm-1 and trans- structure’s 286cm-1. Cleary for the –Me bridged structure the vibrations are higher energy consistent with the shorter bond lengths observed above. For the mixed bridged structure we observed something in between.
There does not appear too much difference between the –cis and –trans rocking modes at 289cm-1and 286cm-1.
NBO and MO Analysis
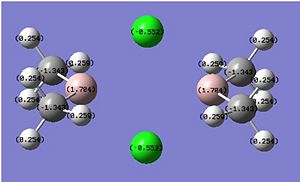
The results from the NBO analysis with the more complete 6-31G(d) basis set are as follows:
Cl Bridged
 |
 |
Me Bridged
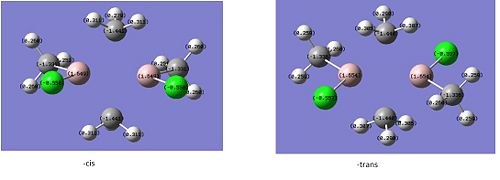 |
 |
 |
DOI:10042/to-7027 DOI:10042/to-7029
Mixed Bridged
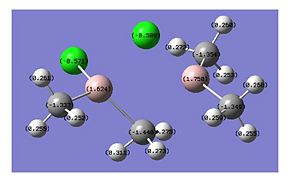 |
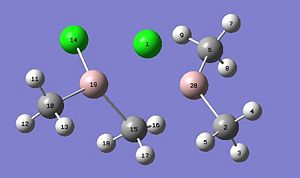 |
Cl Bridged
      (Occupancy)   Bond orbital/ Coefficients/ Hybrids
---------------------------------------------------------------------------------
    1. (1.97073) BD ( 1)Cl   1 -Al  19
               ( 90.96%)   0.9537*Cl   1 s( 23.40%)p 3.27( 76.51%)d 0.00(  0.09%)
                                           0.0000 -0.0001  0.4836  0.0113 -0.0002
                                           0.0000  0.7066  0.0021  0.0000 -0.0001
                                           0.0000  0.0000 -0.5156  0.0005  0.0000
                                          -0.0260  0.0000  0.0096  0.0119
               (  9.04%)   0.3007*Al  19 s( 14.46%)p 5.74( 83.02%)d 0.17(  2.52%)
                                           0.0000 -0.0008  0.3794 -0.0258  0.0050
                                           0.0004 -0.5902  0.0051  0.0000  0.0000
                                           0.0000 -0.0001  0.6935  0.0313  0.0000
                                          -0.1347  0.0000  0.0741  0.0390
    2. (1.97073) BD ( 1)Cl   1 -Al  20
               ( 90.95%)   0.9537*Cl   1 s( 23.40%)p 3.27( 76.51%)d 0.00(  0.09%)
                                           0.0000  0.0001 -0.4836 -0.0113  0.0002
                                           0.0000  0.7067  0.0021  0.0000  0.0001
                                           0.0000  0.0000  0.5155 -0.0005  0.0000
                                          -0.0260  0.0000 -0.0096 -0.0119
               (  9.05%)   0.3008*Al  20 s( 14.47%)p 5.74( 83.02%)d 0.17(  2.52%)
                                           0.0000  0.0008 -0.3794  0.0258 -0.0050
                                           0.0004 -0.5902  0.0051  0.0000 -0.0002
                                           0.0000  0.0001 -0.6934 -0.0313  0.0000
                                          -0.1347  0.0000 -0.0742 -0.0390
    3. (1.97073) BD ( 1)Cl   2 -Al  19
               ( 90.95%)   0.9537*Cl   2 s( 23.41%)p 3.27( 76.50%)d 0.00(  0.09%)
                                           0.0000 -0.0001  0.4837  0.0113 -0.0002
                                           0.0000  0.7066  0.0021  0.0000  0.0006
                                           0.0000  0.0000  0.5155 -0.0005  0.0000
                                           0.0260  0.0000  0.0096  0.0119
               (  9.05%)   0.3008*Al  19 s( 14.47%)p 5.74( 83.01%)d 0.17(  2.52%)
                                           0.0000 -0.0008  0.3795 -0.0259  0.0049
                                           0.0004 -0.5901  0.0050  0.0000 -0.0008
                                          -0.0001  0.0001 -0.6934 -0.0313  0.0002
                                           0.1347  0.0002  0.0742  0.0390
    4. (1.97073) BD ( 1)Cl   2 -Al  20
               ( 90.96%)   0.9537*Cl   2 s( 23.39%)p 3.27( 76.51%)d 0.00(  0.09%)
                                           0.0000  0.0001 -0.4835 -0.0113  0.0002
                                           0.0000  0.7067  0.0021  0.0000 -0.0007
                                           0.0000  0.0000 -0.5155  0.0005  0.0000
                                           0.0260  0.0000 -0.0096 -0.0119
               (  9.04%)   0.3007*Al  20 s( 14.46%)p 5.74( 83.02%)d 0.17(  2.52%)
                                           0.0000  0.0008 -0.3794  0.0258 -0.0050
                                           0.0004 -0.5902  0.0051  0.0000  0.0006
                                           0.0001 -0.0001  0.6935  0.0313  0.0001
                                           0.1347 -0.0001 -0.0741 -0.0390
Mixed bridged
      (Occupancy)   Bond orbital/ Coefficients/ Hybrids
---------------------------------------------------------------------------------
    1. (1.95972) BD ( 1)Cl   1 -Al  19
               ( 90.99%)   0.9539*Cl   1 s( 20.02%)p 3.99( 79.88%)d 0.01(  0.10%)
                                           0.0000  0.0001 -0.4472 -0.0126  0.0003
                                           0.0000  0.7074  0.0039  0.0000  0.0005
                                           0.0009  0.0000  0.5462 -0.0005  0.0034
                                          -0.0253  0.0046 -0.0067 -0.0178
               (  9.01%)   0.3001*Al  19 s( 13.52%)p 6.19( 83.70%)d 0.21(  2.79%)
                                           0.0000  0.0013 -0.3671  0.0088  0.0172
                                           0.0001 -0.4599 -0.0144  0.0000  0.0537
                                           0.0142  0.0003 -0.7877 -0.0412  0.0157
                                          -0.1376  0.0107 -0.0551 -0.0744
    2. (1.96658) BD ( 1)Cl   1 -Al  20
               ( 89.72%)   0.9472*Cl   1 s( 21.35%)p 3.68( 78.53%)d 0.01(  0.12%)
                                           0.0000 -0.0001  0.4619  0.0121 -0.0005
                                           0.0000  0.6761  0.0011  0.0000  0.2831
                                          -0.0006  0.0000 -0.4981  0.0038  0.0105
                                          -0.0257 -0.0152  0.0056  0.0143
               ( 10.28%)   0.3206*Al  20 s( 18.68%)p 4.21( 78.72%)d 0.14(  2.60%)
                                           0.0000 -0.0014  0.4313 -0.0071 -0.0267
                                           0.0005 -0.4992 -0.0137  0.0002 -0.2948
                                          -0.0179 -0.0001  0.6699  0.0428  0.0653
                                          -0.0997 -0.0701  0.0478  0.0677
 19. (1.87943) BD ( 1) C  15 -Al  19
             ( 86.41%)   0.9296* C  15 s( 32.57%)p 2.07( 67.42%)d 0.00(  0.01%)
                                           0.0004  0.5695  0.0367 -0.0004 -0.2566
                                          -0.0026 -0.0139  0.0031  0.7781 -0.0520
                                           0.0029 -0.0043  0.0003  0.0068  0.0026
               ( 13.59%)   0.3686*Al  19 s( 26.05%)p 2.76( 71.98%)d 0.08(  1.97%)
                                           0.0000 -0.0024  0.5101  0.0155  0.0065
                                           0.0000  0.6147  0.0049  0.0001  0.1067
                                           0.0005 -0.0012 -0.5741 -0.0320  0.0284
                                          -0.1117 -0.0167  0.0775  0.0106
Me-bridged (trans)
      (Occupancy)   Bond orbital/ Coefficients/ Hybrids
---------------------------------------------------------------------------------
   11. (1.78856) BD ( 1)Al  11 - C  13
               ( 11.77%)   0.3431*Al  11 s( 26.05%)p 2.77( 72.11%)d 0.07(  1.84%)
                                          -0.0001 -0.0060  0.5103 -0.0067  0.0012
                                          -0.0003  0.6402  0.0211 -0.0001 -0.3033
                                          -0.0069 -0.0005 -0.4669 -0.0261 -0.0698
                                          -0.0883  0.0481  0.0554  0.0182
               ( 88.23%)   0.9393* C  13 s( 32.30%)p 2.10( 67.69%)d 0.00(  0.01%)
                                           0.0004  0.5669  0.0396 -0.0002 -0.0337
                                          -0.0019  0.1312  0.0040  0.8096 -0.0555
                                          -0.0061  0.0014  0.0034  0.0043  0.0074
   12. (1.78857) BD ( 1)Al  12 - C  17
               ( 11.77%)   0.3431*Al  12 s( 26.05%)p 2.77( 72.11%)d 0.07(  1.84%)
                                           0.0001  0.0060 -0.5103  0.0067 -0.0012
                                          -0.0003  0.6403  0.0211 -0.0001 -0.3032
                                          -0.0069 -0.0006 -0.4669 -0.0261  0.0698
                                           0.0884 -0.0481 -0.0554 -0.0181
               ( 88.23%)   0.9393* C  17 s( 32.30%)p 2.10( 67.69%)d 0.00(  0.01%)
                                          -0.0004 -0.5669 -0.0396  0.0002 -0.0338
                                          -0.0019  0.1310  0.0040  0.8096 -0.0555
                                           0.0061 -0.0014 -0.0034 -0.0043 -0.0074
Me-bridged (cis)
      (Occupancy)   Bond orbital/ Coefficients/ Hybrids
---------------------------------------------------------------------------------
11. (1.77014) BD ( 1)Al  11 - C  13
  ( 10.51%)   0.3243*Al  11 s( 18.00%)p 4.40( 79.27%)d 0.15(  2.73%)
                                           0.0001  0.0054 -0.4242  0.0036 -0.0011
                                           0.0001 -0.5610 -0.0131  0.0000  0.0092
                                           0.0061 -0.0007 -0.6905 -0.0306 -0.0020
                                          -0.1491  0.0098 -0.0695 -0.0120
               ( 89.49%)   0.9460* C  13 s( 32.63%)p 2.06( 67.35%)d 0.00(  0.01%)
                                          -0.0004 -0.5699 -0.0389  0.0001  0.0541
                                          -0.0001  0.0369  0.0062  0.8163 -0.0541
                                          -0.0011  0.0004 -0.0021 -0.0073 -0.0077
   12. (1.77016) BD ( 1)Al  11 - C  17
               ( 10.52%)   0.3243*Al  11 s( 18.00%)p 4.40( 79.27%)d 0.15(  2.73%)
                                          -0.0001 -0.0054  0.4242 -0.0036  0.0011
                                          -0.0001  0.5610  0.0132  0.0000 -0.0092
                                          -0.0061 -0.0007 -0.6904 -0.0306  0.0020
                                          -0.1491  0.0097  0.0695  0.0120
               ( 89.48%)   0.9460* C  17 s( 32.63%)p 2.06( 67.36%)d 0.00(  0.01%)
                                           0.0004  0.5699  0.0389 -0.0001 -0.0542
                                           0.0001 -0.0372 -0.0062  0.8163 -0.0541
                                           0.0011  0.0004 -0.0021  0.0073  0.0077
Considering the formal charges we see that carbon has ca -1.4 across all structures and Cl has ca -0.55. This is unusual considering that we would expect the more electronegative chlorine to hold the greater negative charge. However, we have not considered the relatively electropositive hydrogens on the methyl carbon which are not present on the Cl atoms. These increase the relative NBO negative charge on the carbon. Gaussian has calculated these charges based purely on orbital contributions and not electronegativity. A much more useful analysis would be to consider the orbital contributions.
Inspection of the population analysis in the .log file shows that the Cl-bridged structure has a 91% (23%s, 77%p) contribution from the Cl atom and a 9% (14%s, 83%p, 3%d) contribution from the Aluminium. This means that the p-orbitals in both atoms are the main contribution to the bond with a much heavier emphasis from the Chlorine. We would expect the MO for this interaction to be centered on the chlorine.
Comparing to the Me-bridged trans structure we see a slightly larger 12% (26%s, 72%p, 1.84%d) contribution from the Aluminium and (smaller in comparison to Cl) 88% (32%s, 68%p) contribution from the methyl carbon. Similar percentages are quoted for the cis structure. The s contributions overall (both Al and bridging atom) in the Me-bridged structure are greater than those in the Cl structure thus accounting for the shorter bond observed.
It is interesting to see that in the mixed bridged structure we observe essentially identical joint contributions to those quoted above; half identical to the Cl-bridged structure and have identical to the Me-bridged structure.
An aside would be to compare the –cis and –trans isomers which would a highlight discrepancies the wing-Al-C bonding intercalations.
We will now extend the investigation to compute the MOs for the cl-bridged structure only and account for whether this matches up to that theoretically predicted by LCAO. Also perhaps there will be some insight into why this structure is so stable relative to the others.
We have attempted to predict the MO diagram from a LCAO theoretical basis. We have used an isolobal analogy and approximated the “-CH3” group with “H”.
It is difficult to predict the ordering of the final MOs and the starting Cl2 levels relative to the Al unbridged structure without energy calculation. We will therefore compute the MOs by adding Cl2 across the AlMe2 dimer.
| Structure | Single point energy/a.u. |
|---|---|
| Cl bridged | -1565.1216 |
| Me bridged – trans | -1565.0997 |
| Me bridged - cis | -1565.0993 |
| Mixed bridge | -1565.1033 |
The single point energy gives an indication of the total electronic energy. There is again little difference between the –trans ans cis Me bridged structures. However, the key energy difference is the 57.5187494965kJ/mol energy difference between the Cl bridged structure and the (-trans) Me bridged structure. This is consistent with the observed following LANL2DZ optimisation .We may account for this by taking a closer look at the MOs.
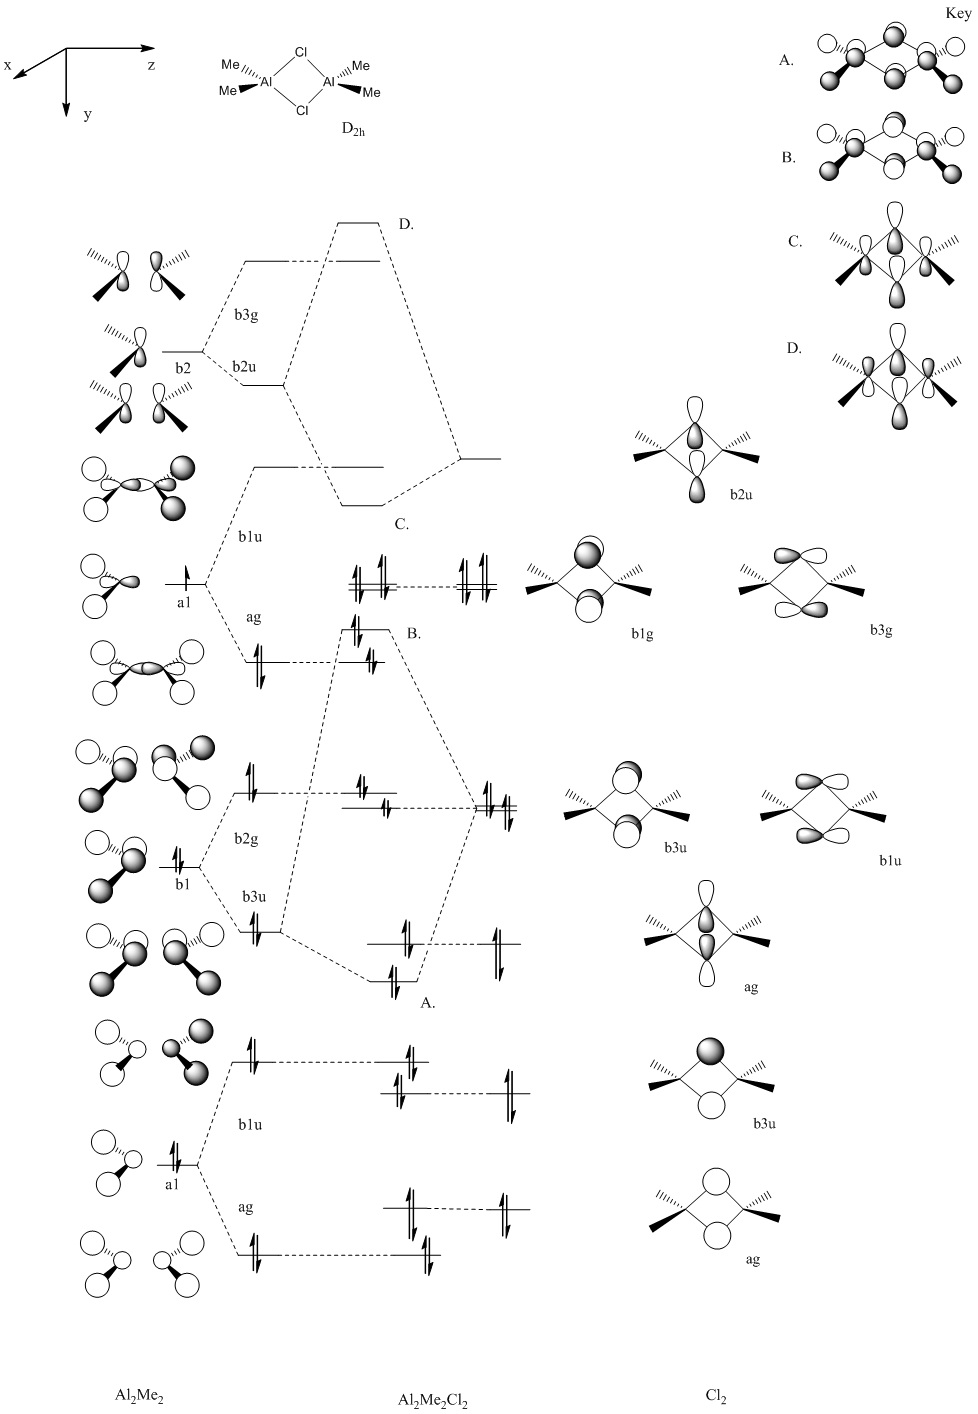
Initial inspection of the MOs leads to us to the conclusion that our initial guess for the Cl2 levels was too high in energy. The orbitals for the added Cl2 MO diagram should be lower. Selecting key orbitals leads to the following adjustment in the MO diagram.
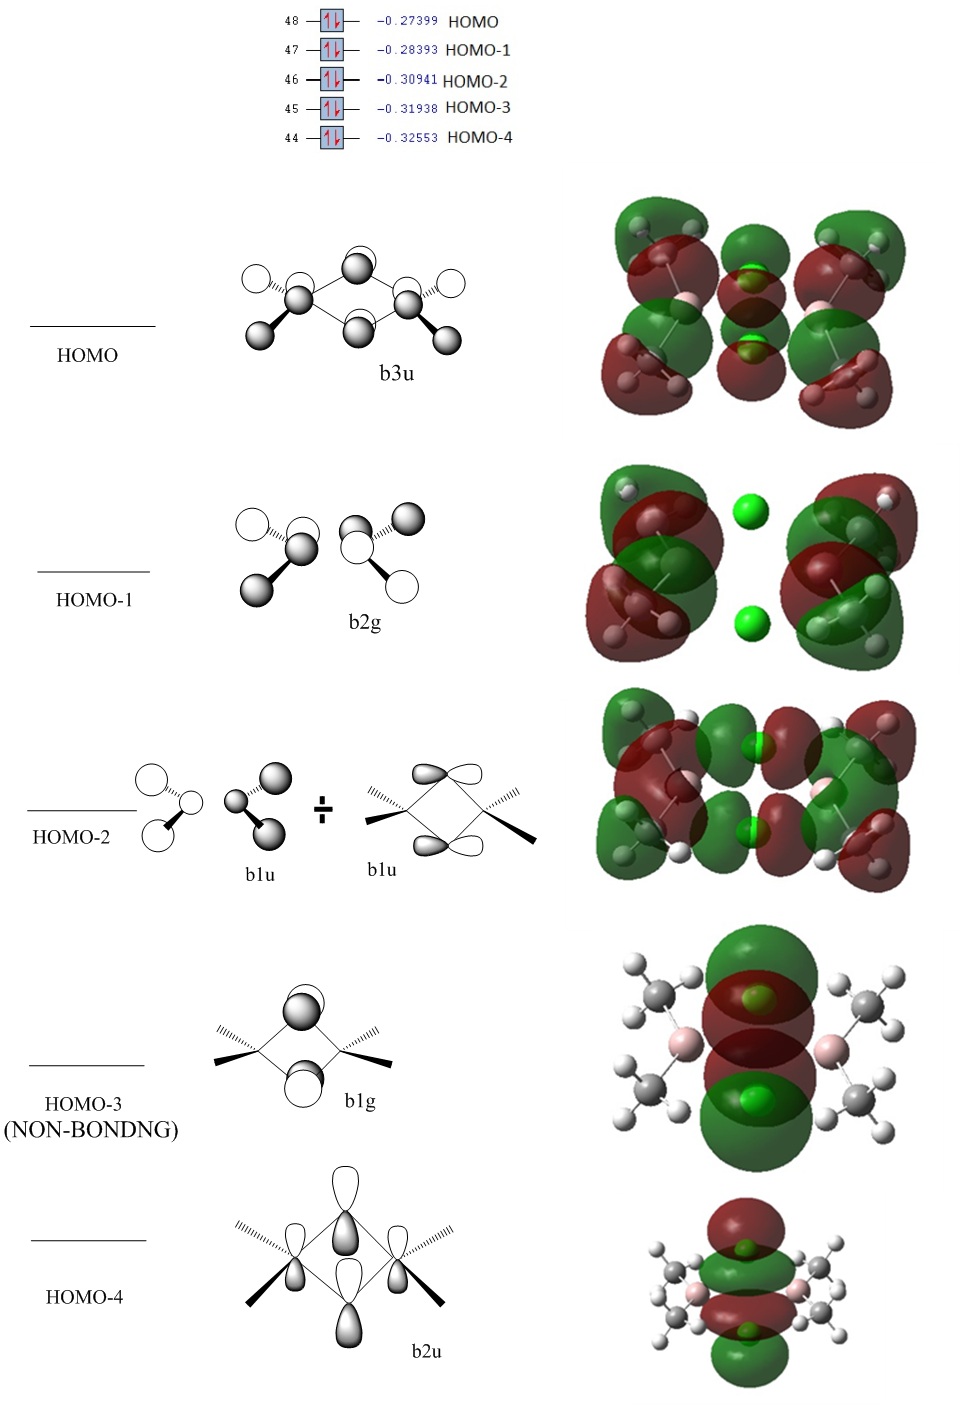
The HOMO is in fact structure A and the HOMO-1 the Al2Me2 dimerised b2g anti bonding orbital. The HOMO-2 turns out to be the b1u from the Cl2 mixed with the b1u from the Al2Me2; something not energetically possible in the old diagram due to the large difference in energies. The HOMO-3 is solely the b1g from the Cl2 contribution. The HOMO-4 turns out to be the bridge-bonded b2u MO; again something not possible with the initial ordering or energies in the initial diagram. At first sight we see that there are anti-bonding interactions or no interactions in the bridge of the HOMO, HOMO-1 and HOMO-2. However, after closer inspection we see that there is much stabilisation gained by a strong overlap of the Al-C bonds. Besides, the anti-bonding repulsion is weak in the bridge due as 1. it pi-antibonding and 2. The orbitals are far apart. HOMO-3 is non-bonding. A key orbital of interest is the HOMO-4 which suggests a strong delocalised bridging interaction keeping the dimer together. Back to the original question: why is this structure favoured over the Me –bridged structure?
Computing the 4 occupied orbitals below the HOMO for the Me-bridged (-trans) structure is where we would expect the higher energy bridging interactions to lie. We see that there is the absence of this bridging bonding interaction; albeit it is very weak. Consequently, it is less favourable to form a dimer with Me as a bridging species even though the Al-bridge bond length may be shorter than for the Cl-bridged structure.
We could extend the investigation to create the MO diagrams for the other dimer. We could also investigate solvent effects and their influence on the dipoles of the structures.
Conclusion
In conclusion we have used a variety of Gaussian techniques to characterise strutural and electronic features of moleulces. These have proved powerful as the results are often comparable with the literature. However, limitations have also been exposed in the way the Gaussian program operates in the sense that it lacks "chemical intuition".
The mini-project has yielded interesting results for the bond lengths; perhaps use of a different more appropriate basis set could be investigated to match the literature. However the MO analysis and initial geometry optimisations have proved invaluable in ascertaining the the Cl-bridged structure is indeed the lowest energy isomer.
Had time permitted I would have liked to include more 3D representations/jmols and animations
References
- ↑ (http://www.ncbi.nlm.nih.gov/pubmed/15934063)
- ↑ http://www.sciencedirect.com/science?_ob=MImg&_imagekey=B6TGS-44F75BT-44-1&_cdi=5262&_user=217827&_pii=S0022286098801014&_origin=search&_coverDate=05%2F31%2F1988&_sk=998249999&view=c&wchp=dGLbVlz-zSkWb&md5=5794f36309242552a34c70c4ddd285b1&ie=/sdarticle.pdf
- ↑ ↑ ELmer C. Alyea and Shuquan Song, Inorg. Chem., 1995 34, 3864-3873 DOI:10.1021/ic00119a006
- ↑ 4.0 4.1 4.2 F. Cotton, Inorg. Chem. 1982, 21, 2661-2666
- ↑ Shriver and Atkins Inorganic Chemistry, Fourth Edition, OUP
- ↑ 1. E.Z. Zasorin and N.G. Rambidi Zh. Strukt. Khim. 8 (1967), p. 391.


