Rep:Mod:ns3516
NH3 Molecule
For the first part of the report I will be investigating the ammonia molecule.
I began by creating the molecule in Gaussview, I then set the N-H bond length to 1.3 angstrom and then corrected its point group to C3V. After i had done this i was then ready to optimise the molecule. This would enable me to determine the lowest energy, most stable, structure of ammonia.
Now we will look at the output of the optimisation.
I determined the distance of the optimised N-H bond to be 1.01798A and that of the H-N-H angle to be 105.741°.
The calculation method I used for this molecule was RB3LYP and the basis set was 6-31G(d,p). I calculated the final energy of ammonia to be -56.55776873 a.u. and the RMS gradient to be 0.00000485. Ammonia's point group as established previously is C3V.
        Item               Value     Threshold  Converged?
Maximum Force            0.000004     0.000450     YES
RMS     Force            0.000004     0.000300     YES
Maximum Displacement     0.000072     0.001800     YES
RMS     Displacement     0.000035     0.001200     YES
In looking at the table above we can establish that the forces are in fact converged and since the force gives the slope of the energy vs distance graph a value of next to 0 implies that there are barely any forces acting on this molecule. [1]. So ammonia is optimised to its most stable configuration.
                          ----------------------------
                          !   Optimized Parameters   !
                          ! (Angstroms and Degrees)  !
--------------------------                            --------------------------
! Name  Definition              Value          Derivative Info.                !
--------------------------------------------------------------------------------
! R1    R(1,2)                  1.018          -DE/DX =    0.0                 !
! R2    R(1,3)                  1.018          -DE/DX =    0.0                 !
! R3    R(1,4)                  1.018          -DE/DX =    0.0                 !
! A1    A(2,1,3)              105.7412         -DE/DX =    0.0                 !
! A2    A(2,1,4)              105.7412         -DE/DX =    0.0                 !
! A3    A(3,1,4)              105.7412         -DE/DX =    0.0                 !
! D1    D(2,1,4,3)           -111.8571         -DE/DX =    0.0                 !
--------------------------------------------------------------------------------
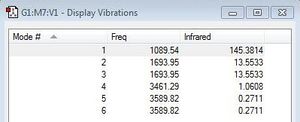
After having optimised the molecule I decided to look at the vibrational modes present in the NH3 molecule when it is exposed to IR radiation and the table adjacent gives the different modes I found.
NH3 molecule |
The optimisation file is linked to here
How many modes do you expect from the 3N-6 rule?
From the 3N-6 rule I would expect the NH3 molecule to have 6 vibrational modes.
Which modes are degenerate (i.e. have the same energy)?
I think that modes [2 and 3] and [5 and 6] are degenerate as they have the same energy and also absorb as the same frequency of IR radiation.
Which modes are "bending" vibrations and which are "bond stretch" vibrations?
I think that modes 1-3 are bending vibrations as these vibrations are found at lower frequency values typically around a 1000cm-1. I think that stretching vibrations corresponds to modes 4-6 as these are usually found at a higher frequency range.
Which mode is highly symmetric?
I think that mode 4 is highly symmetric as once I ran the animation I saw that the vibrational modes it involves vibrate in the same direction. In doing so the change in dipoles would cancel each other out and therefore would not be visible in an IR spectrum.
One mode is known as the "umbrella" mode, which one is this?
Mode 3 is the "umbrella" mode as it involves a motion that resembles that of an umbrella being constantly opened and closed.
How many bands would you expect to see in an experimental spectrum of gaseous ammonia?'
I would expect to see three bands: firstly mode 1 as this involves a change in dipole, then out of the two pairs of degenerate modes ([2 and 3] and [5 and 6]) only one of each will be seen. Since mode 4 is highly symmetric this will not be observed in an IR spectrum (since it requires a change in dipole).
Charge Analysis
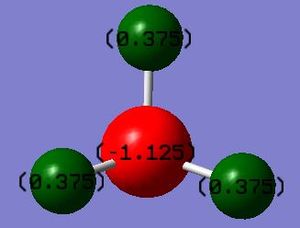
I calculated the charge on the nitrogen atom to be -1.125 and that on the hydrogen to be 0.375. I would expect a negative charge on the nitrogen atom as it is a much more electronegative atom than hydrogen and so within the bond the electrons are more likely to be found closer to it thus giving it a negative charge and leaving the hydrogen atoms positively charged.
N2 Molecule
The second part of my report will focus on the nitrogen molecule. I once again optimised the molecule and established the N-N bond distance to be 1.10550A. The calculation method I used for this molecule is RB3LYP and the basis set 6-31G(d,p). The final energy of the nitrogen molecule was -109.52412868 a.u., the RMS gradient was 0.00000060 a.u. and the point group was D∞h.
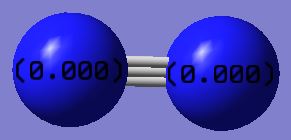
Given that N2 is a homodiatomic molecule I would not expect it to have a charge as the atoms in the bond are equivalent.
        Item               Value     Threshold  Converged?
Maximum Force            0.000001     0.000450     YES
RMS     Force            0.000001     0.000300     YES
Maximum Displacement     0.000000     0.001800     YES
RMS     Displacement     0.000000     0.001200     YES
For the reasons established previously this optimised molecule is the lowest energy, most stable, structure as all the forces are converged.[1]
                         ----------------------------
                          !   Optimized Parameters   !
                          ! (Angstroms and Degrees)  !
--------------------------                            --------------------------
! Name  Definition              Value          Derivative Info.                !
--------------------------------------------------------------------------------
! R1    R(1,2)                  1.1055         -DE/DX =    0.0                 !
--------------------------------------------------------------------------------

As N2 is a homodiatmoic molecule it does not have a vibrational mode which corresponds to a change in dipole. It only has one vibrational mode which is a symmetrical stretch and thus does not abosorb IR.
N2 molecule |
The optimisation file is linked to here
H2 Molecule
The third part of this report will be centered on the hydrogen molecule. Once again I began by optimising the molecule and in doing so I was able to determine the distance of the optimised H-H bond which came out to a value of 1.01798A. The calculation method used for this molecule is RB3LYP and the basis set 6-31G(d,p). The final energy of this molecule was -1.17853936 a.u., the RMS gradient was 0.00000017 a.u. and the point group was D∞h. (D^H)
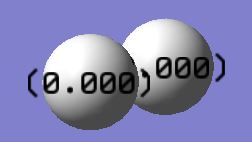
H2 is a homodiatomic molecule consisting of the same atoms and so I would not expect it to have a charge.
        Item               Value     Threshold  Converged?
Maximum Force            0.000000     0.000450     YES
RMS     Force            0.000000     0.000300     YES
Maximum Displacement     0.000000     0.001800     YES
RMS     Displacement     0.000001     0.001200     YES
The H2 molecule is in its lowest energy configuration as the forces are converged.[1]

After having optimised the molecule I decided to investigate its vibrational modes. Since H2 is a homodinuclear moleule it only has one vibrational mode - a symmetric stretch. As IR requires a change in dipole the value in the IR column is 0 and so it is not observed in an IR spectrum.
H2 molecule |
The optimisation file is linked to here
Energies in atomic units:
Ammonia is a compound commercially formed from the Haber-Bosch Process - a reaction scheme which was first devised by Fritz Haber and Carl Bosch at the beginning of the 20th century. [2]
Below I have provided a table detailing the various energies associated in the reaction.
| Molecule | Energy (a.u.) |
|---|---|
| E(NH3) | -56.55776873 |
| 2*E(NH3) | -113.11553746 |
| E(N2) | -109.52412868 |
| E(H2) | -1.17853936 |
| 3*E(H2) | -3.53561808 |
The energy for converting hydrogen and nitrogen gas into ammonia gas is -146.48kJ/mol. The ammonia product is more stable than the gaseous reactants as it has a more negative energy value and high exothermmicity is an indicator of stability.
Project Molecule: F2
For the final part of the report I opted to investigate the F2 molecule as my project molecule to see how it compares to N2 and H2, other diatomic molecules. After optimisation i determined the F-F bond distance to be 1.40281A. The calculation method I used for this molecule was RB3LYP and the basis set 6-31G(d,p). The final energy of this molecule was -199.49825218 a.u., the RMS gradient was 0.00007365 and the point group was D∞h.
F2 consists of two fluorine atoms and so would not have a charge.
        Item               Value     Threshold  Converged?
Maximum Force            0.000128     0.000450     YES
RMS     Force            0.000128     0.000300     YES
Maximum Displacement     0.000156     0.001800     YES
RMS     Displacement     0.000221     0.001200     YES
This optimised molecule is in its lowest energy structure as all the forces are converged.[1]
                         ----------------------------
                          !   Optimized Parameters   !
                          ! (Angstroms and Degrees)  !
--------------------------                            --------------------------
! Name  Definition              Value          Derivative Info.                !
--------------------------------------------------------------------------------
! R1    R(1,2)                  1.4028         -DE/DX =    0.0001              !
--------------------------------------------------------------------------------

From the table above we can see that the F2 molecule has an infrared value of 0. This is explained by the fact that F2 is a homodiatomic molecule and so does not involve a change in dipole which is a principle factor for IR absorption. F2 has only one vibrational mode corresponding to the symmetric stretch which is not IR active.
F2 molecule |
The optimisation file is linked to here
Atomic orbitals
Below I have included the various molecular orbitals that I found particularly interesting when investigating the F2 molecule.
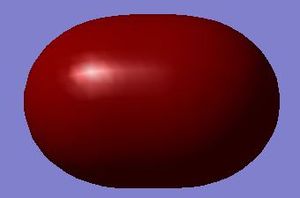
This 2s bonding orbital is formed from the overlap of two atomic 2s orbitals giving rise to a sigma bond.

The 2s antibonding orbital is formed from two atomic 2s orbitals that are out of phase producing a high energy orbital. No sigma bond is formed in this case as the orbitals are out of phase.
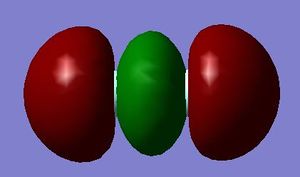
The 2p bonding orbital is formed from the favourable sideways overlap of two atomic 2p orbitals that are in phase. This produces a region of high electron density between the orbitals (where they overlap) i.e. the sigma bond.
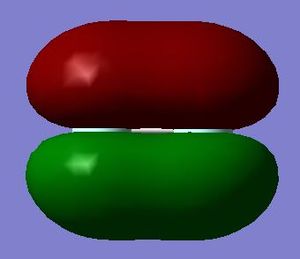
The 2p bonding orbital in the pi bond is formed from the parallel overlap of two 2p atomic orbitals essentially producing the pi bond. This pi bond forms a region of high electron density above and below the molecule.
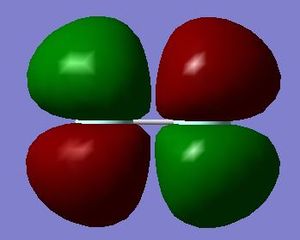
The 2p antibonding orbital is formed from two atomic parallel 2p orbitals that are out of phase and so in this case no pi bond is formed. This orbital lies high in energy due to the repulsion between the orbitals. This can be seen in the diagram as the orbitals point towards the corners away from each other in order to minimise repulsion.
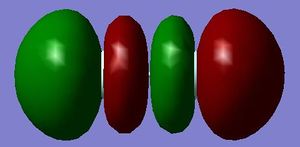
The LUMO is the lowest unoccupied molecular orbital. It is a high energy orbital and typically in a reaction it is where the electrons in a bond would be accommodated.
References
- ↑ 1.0 1.1 1.2 1.3 Patricia, Hunt. "Viewing and Understanding your Optimised NH3 output", Hunt Research Group, London, n.d. Retrieved on 3 March 2017.
- ↑ Wikipedia. "Haber Process", Wikipedia, n.d. Retrieved on 3 March 2017.

