Rep:Mod:npa11
Optimisation
BH3
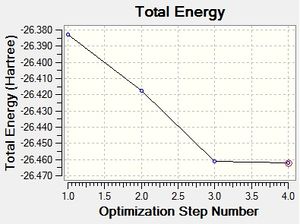
The borane molecule was first optimised using the 3-21G Basis set with RB3LYP calculation method. The B-H bond lengths had been altered to 1.5Å to show the effect of the optimisation.
BH3 3-21G optimisation:
Media:BH3-OPT.LOG

| Summary Information | Result |
|---|---|
| File type | .log |
| Calculation type | FOPT |
| Calculation method | RB3LYP |
| Basis set | 3-21G |
| Final energy | -26.46226338 au |
| Gradient | 0.00020672 au |
| Dipole moment | 0.00D |
| Point group | D3h |
| Calculation time | 12 Seconds |
| Bond length | 1.193 Å |
| Bond angle | 120.0o |
Item Value Threshold Converged?

Maximum Force            0.000413     0.000450     YES
 RMS     Force            0.000271     0.000300     YES
 Maximum Displacement     0.001610     0.001800     YES
 RMS     Displacement     0.001054     0.001200     YES
 Predicted change in Energy=-1.071764D-06
 Optimization completed.
    -- Stationary point found.
To enhance the energy minimum of borane a further optimisation was carried out using a 6-31G(d,p) basis set with the calculation method remaining as RB3LYP.
BH3 6-31G (d,p) optimisation:
Media:BH3-OPT-631G.LOG
| Summary Information | Result |
|---|---|
| File type | .log |
| Calculation type | FOPT |
| Calculation method | RB3LYP |
| Basis set | 6-31G(d,p) |
| Final energy | -26.61532363 au |
| Gradient | 0.00000235 au |
| Dipole moment | 0.00D |
| Point group | D3h |
| Calculation time | 57 Seconds |
| Bond length | 1.192 Å |
| Bond angle | 120.0o |
         Item               Value     Threshold  Converged?
 Maximum Force            0.000005     0.000450     YES
 RMS     Force            0.000003     0.000300     YES
 Maximum Displacement     0.000019     0.001800     YES
 RMS     Displacement     0.000012     0.001200     YES
 Predicted change in Energy=-1.305135D-10
 Optimization completed.
    -- Stationary point found.
GaBr3
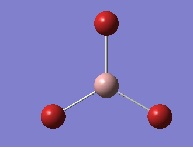
To optimise this molecule a more enhanced basis set was employed. LANL2DZ uses pseudo potentials for heavier elements, which uses the repulsive forces of the core electrons of the atom as a background potential energy and allows recovery of relativistic effects when solving the schrodinger equation.
GaBr3 LANL2DZ optimisation:
Media:Log_79456GaBr.log
https://spectradspace.lib.imperial.ac.uk:8443/dspace/handle/10042/25203
| Summary Information | Result |
|---|---|
| File type | .log |
| Calculation type | FOPT |
| Calculation method | RB3LYP |
| Basis set | LANL2DZ |
| Final energy | -41.70082783 au |
| Gradient | 0.00000016 au |
| Dipole moment | 0.00D |
| Point group | D3h |
| Calculation time | 27.6 Seconds |
| Bond length | 2.350 Å |
| Bond angle | 120.0o |
Literature values of bond length and bond angles[1]:
Bond length= 2.239±0.007 Å
Bond angle= 119.1±0.1o
        Item               Value     Threshold  Converged?
 Maximum Force            0.000000     0.000450     YES
 RMS     Force            0.000000     0.000300     YES
 Maximum Displacement     0.000003     0.001800     YES
 RMS     Displacement     0.000002     0.001200     YES
 Predicted change in Energy=-1.282678D-12
 Optimization completed.
    -- Stationary point found.
BBr3
As this molecule contains a a light atom and three heavy atoms a GEN optimisation was chosen for the calculation. This allows each atom to have a specific basis set. Boron was given a basis set of 6-31G whilst the bromine atoms were given the LANL2DZ basis set as they are heavier atoms and require peusdo potentials.
BBr3 GEN optimisation:
Media:Log_79469_BBr3_GEN.log
https://spectradspace.lib.imperial.ac.uk:8443/dspace/handle/10042/25211

| Summary Information | Result |
|---|---|
| File type | .log |
| Calculation type | FOPT |
| Calculation method | RB3LYP |
| Basis set | GEN |
| Final energy | -64.43645296 au |
| Gradient | 0.00000382 au |
| Dipole moment | 0.00D |
| Point group | D3h |
| Calculation time | 37 Seconds |
| Bond length | 1.934 Å |
| Bond angle | 120.0o |
        Item               Value     Threshold  Converged?
 Maximum Force            0.000008     0.000450     YES
 RMS     Force            0.000005     0.000300     YES
 Maximum Displacement     0.000036     0.001800     YES
 RMS     Displacement     0.000023     0.001200     YES
 Predicted change in Energy=-4.027548D-10
 Optimization completed.
    -- Stationary point found.
Structure Comparison
| Molecule | Bond Length (Å) |
|---|---|
| BH3 | 1.192 |
| GaBr3 | 2.350 |
| BBr3 | 1.934 |
On changing the ligand from H to Br, it has been shown that the B-L bond length has increased by 0.74164Å. This is due to the increased size of bromines atomic radii leading to larger atomic orbital size. Both hydrogen and bromine are similar in the fact that they are both X-type ligands and donate one electron to the central atom. This results in a sigma bond. The difference between these two arises in the fact that Bromine has lone pairs of electrons, which it can donate into the empty orthogonal orbital of boron. This extra conjugation attraction results in a shorting of the bond as noted in the fact that the bond length is shorter than the sum of the atomic radii of boron and bromine.
When the central atom is changed from second row boron to fourth row gallium with the ligand remaining constant it is noted that the bond length of M-L increases by 0.41622Å. This arises due to the increase in size of atomic orbital leading to a poorer orbital overlap, which causes bonds to be weaker and hence longer. Bond lengths are related to atomic radii therefore as you descend down a group the bond length will increase. Gallium is a weaker Lewis acid than boron, due to larger orbital size leading to less effective orbital overlaps. In the molecules calculated this results in poor pi donation from a lone pair on the bromine ligand for gallium and results in less effective bond shortening in comparison to the boron bromine bond.
A bond is the equilibrium between all electrostatic forces of attraction between the opposite charges of the nuclei and electrons. Bonds form due to the overlap of atomic orbitals, which localise the electrons within that overlap. The wave form of the electron defines these orbitals and their respective shapes. When they combine to form a bond it allows expression in terms of a wave function, which contains all knowable information about the electron. This resulting wave function squared gives the location where the electron is most likely to be found providing a good overlap between atomic orbitals has occurred.Gaussview does not draw bonds where we might expect as it has been programmed to draw bonds on certain criteria. So when a structure is produced and it appears as though there are no bonds this is not the case, it simply means the distance exceeds a pre defined value and it therefore produces a structure without showing a bond, which may be there.[2]
Vibrational Analysis
BH3
To carry out a frequency analysis on borane the calculation type was changed to Frequency but the method type and basis set remained constant from the optimisation. This is used to confirm that the molecule is at a minimum.
BH3 Vibrational analysis summary:
Media:NPA-BH3-OPT-631G-VA.LOG
| Summary Information | Result |
|---|---|
| File type | .log |
| Calculation type | FREQ |
| Calculation method | RB3LYP |
| Basis set | 6-31G(d,p) |
| Final energy | -26.61532363 au |
| Gradient | 0.00000237 au |
| Dipole moment | 0.00D |
| Point group | D3h |
| Calculation time | 16 Seconds |
Low frequencies --- -0.9033 -0.7343 -0.0054 6.7375 12.2491 12.2824
Low frequencies --- 1163.0003 1213.1853 1213.1880
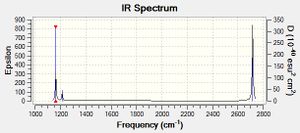
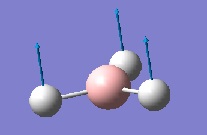
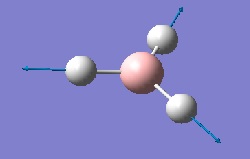
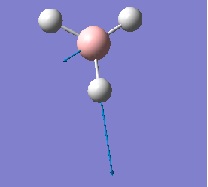
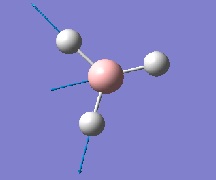
In the IR spectrum generated from gaussian there are only three peaks, but there are six vibrational modes. The reason for this is due to two factors. Firstly their are two degenerate sets of vibrational modes which occur at the exact same frequency. shown at 2715.3 cm-1 and 1213.19 cm-1. These overlap and therefore only form two peaks for four vibrational modes. The other reason is due to the vibration shown as number four is IR inactive due to its high symmetry when oscillating resulting in no dipole momment. This means no absorption of light can occur indicated by the zero value for intensity.
GaBr3
Similar to the frequency analysis of borane the method type and basis set remained the same as in the optimisation but the method type was altered to frequency.
GaBr3 Vibrational analysis summary: Media:Log_79555_GaBr3_Frequency.log
https://spectradspace.lib.imperial.ac.uk:8443/dspace/handle/10042/25253
| Summary Information | Result |
|---|---|
| File type | .log |
| Calculation type | FREQ |
| Calculation method | RB3LYP |
| Basis set | LANL2DZ |
| Final energy | -41.70082783 au |
| Gradient | 0.00000011 au |
| Dipole moment | 0.00D |
| Point group | D3h |
| Calculation time | 16.8 Seconds |
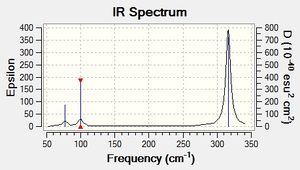
The lowest real mode for GaBr3 is shown below in the second line of the low frequencies as 77 cm-1
Low frequencies --- -0.5252 -0.5247 -0.0024 -0.0010 0.0235 1.2010
Low frequencies --- 76.3744 76.3753 99.6982
| No. | Form of the Vibration | Frequency (cm-1) | Intensity | Symmetry D3h |
|---|---|---|---|---|
| 1 |  |
76 | 3 | E' |
| 2 | 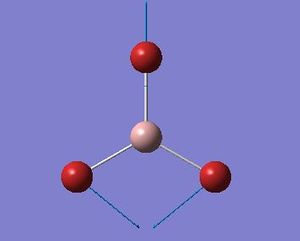 |
76 | 3 | E' |
| 3 |  |
99 | 9 | A2" |
| 4 | 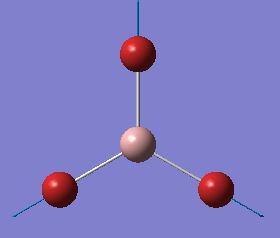 |
197 | 0 | A1' |
| 5 | 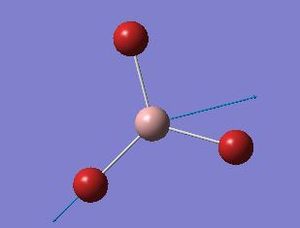 |
316 | 57 | E' |
| 6 | 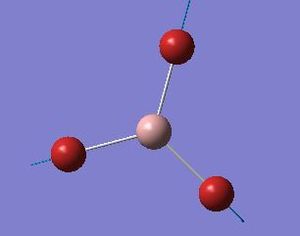 |
316 | 57 | E' |
Frequency Analysis
| BH3 Frequencies (cm-1) | GaBr3 Frequencies (cm-1) |
|---|---|
| 1163 (A2") | 76 (E') |
| 1213 (E') | 76 (E') |
| 1213 (E') | 99 (A2") |
| 2582 (A1') | 197 (A1') |
| 2715 (E') | 316 (E') |
| 2715 (E') | 316 (E') |
The large difference in frequency values between GaBr3 and BH3 can be explained by the following equation: frequency, .
As gallium and bromine are so large they have poor orbital overlap,which results in weak bonds and a low value of the force constant, k. Additionally they are heavier atoms than boron and hydrogen so have a larger reduced mass, μ. Both of these factors combined result in lower frequency values as determined by the equation. The ordering of modes has altered between Borane and GaBr3 because when the a2" symmetry mode distorts the symmetry changes from D3h to C3V resulting in a close arrangement of the ligands. In the case of GaBr3 this causes Pauli repulsion of the sterically bulky bromine ligands. This means the energy of this vibration is higher in energy and means it occurs at a higher frequency than the e' symmetry mode. In borane the energy of the a2" symmetry mode doesn't suffer as much from this as the hydrogen ligands are smaller and don't cause steric repulsions to the mode. Furthermore there is a breakdown in the Born-Oppenheimer approximation, which results in the nuclei oscillating and therefore having energy contributing to the total energy of the a2" vibrational mode.
Both spectra generated from Gaussian depict three peaks from a possible six vibrational modes. Three peaks are shown as in both molecules there are two pairs of degenerate e' symmetry modes, which leads to only two peaks showing one for each set of degenerate modes. the third peak is from the IR active mode the a2" whilst the a1' is IR inactive and therefore does not show up on the spectra. In the values of the frequencies there are two sets of modes which lie close together the a2" with a e' and the a1' with a e'. This is explained by the fact that the first two symmetry modes are bending modes, which require less energy than the other two symmetry modes that are stretching modes. Since the stretching modes require more energy they occur at higher frequencies.
The same basis set must be employed to both the optimisation and frequency analysis calculations because when the computer solves the Schrodinger equation it creates a potential energy surface and solves for the minimum point on this curve, ensuring the molecule is at an energy minimum. If the basis set changes the potential energy surface will also change and the molecule may no longer be solved to have the minimum energy. It hasn't determined the minimum on the potential surface. Carrying out frequency analysis allows determination that the molecule is at an energy minimum. The calculation solves the second order derivative to show that the gradient is a minimum. Furthermore it produces the symmetry labels, a predicted spectrum and an animation of the vibrational modes for the given molecule. The top line of the low frequencies represents the external degrees of freedom of the molecule. These degrees of freedom represent the three translations of the molecule and the three rotations of the molecule. The bottom line real modes of vibrations that are IR active.
Molecular Orbitals
BH3 MO's
To generate MO's for the molecule the .chk file of the optimisation was used and under the NBO tab "Full NBO" was selected. Further more in the additional key words section the phrase "pop=full" was inputted.
BH3 Molecular Orbital summary: Media:Log_79562BH3_MO.log
https://spectradspace.lib.imperial.ac.uk:8443/dspace/handle/10042/25261
| Summary Information | Result |
|---|---|
| File type | .fch |
| Calculation type | SP |
| Calculation method | RB3LYP |
| Basis set | 6-31G(d,p) |
| Final energy | -26.61532363 au |
| Gradient | 0.00000000 au |
| Dipole moment | 0.00D |
| Point group | D3h |
| Calculation time | - Seconds |
| no. | Molecular Orbital | no. | Molecular Orbital |
|---|---|---|---|
| 1 |  |
5 | 
|
| 2 | 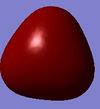 |
6 | 
|
| 3 | 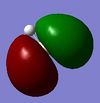 |
7 | 
|
| 4 |  |
8 | 
|
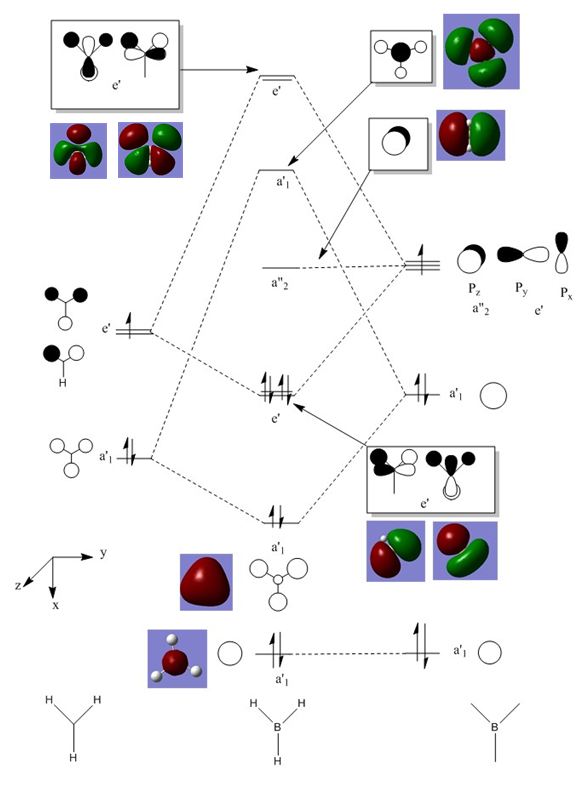
Qualitative MO theory provides a useful and relatively accurate method of generating MO's especially for small molecules. It generates almost identical MO's as quantum calculations, as shown in the MO diagram above. The quantum calculations become a far better method for more complex and larger molecules that are hard to analyse qualitatively. Qualitative calculations are a useful way of teaching the concept of what the computer is doing and allows understanding and interpretation of the results generated when the computer solves the Schrodinger equation. The LCAO's are restricted to have the electrons localized to help in determination of symmetry.
NBO Analysis of NH3
Optimisation of NH3
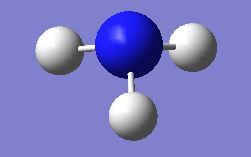
A 6-31G basis set combined with a RB3LYP method was employed to optimise the molecule of ammonia. In the keywords section "nosymm" to increase the accuracy of the optimisation.
NH3 6-31G(d,p) optimisation:Media:NH3_OPTIMISATION.LOG
| Summary Information | Result |
|---|---|
| File type | .log |
| Calculation type | FOPT |
| Calculation method | RB3LYP |
| Basis set | 6-31G(d,p) |
| Final energy | -56.55776856 au |
| Gradient | 0.00000885 au |
| Dipole moment | 1.85D |
| Point group | C1 |
| Calculation time | 1 minute 59 Seconds |
 Item Value Threshold Converged?

Maximum Force            0.000024     0.000450     YES
 RMS     Force            0.000012     0.000300     YES
 Maximum Displacement     0.000079     0.001800     YES
 RMS     Displacement     0.000053     0.001200     YES
 Predicted change in Energy=-1.629715D-09
 Optimization completed.
    -- Stationary point found.
Frequency Analysis
Similar to the frequency analysis run for the previous molecules the calculation type was changed but the basis set and the method remained the same as the optimisation.
NH3 Frequency analysis:Media:NPA_NH3_FREQ.LOG
| Summary Information | Result |
|---|---|
| File type | .log |
| Calculation type | FREQ |
| Calculation method | RB3LYP |
| Basis set | 6-31G(d,p) |
| Final energy | -56.55776856 au |
| Gradient | 0.00000887 au |
| Dipole moment | 1.85D |
| Point group | C1 |
| Calculation time | 28 Seconds |
Low frequencies --- -30.7927 -0.0010 -0.0008 0.0011 20.2690 28.2324
Low frequencies --- 1089.5544 1694.1237 1694.1863
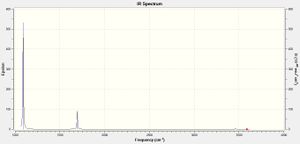
Symmerty should be C3V however from the calculation with restriction of nosymm the point group was determined as C1.The following vibrational modes have been corrected to C3V.
| No. | Form of the Vibration | Frequency (cm-1) | Intensity | Symmetry C3V |
|---|---|---|---|---|
| 1 |  |
1089 | 145 | A1 |
| 2 |  |
1694 | 13 | E |
| 3 | 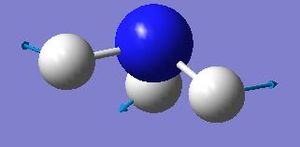 |
1694 | 13 | E |
| 4 |  |
3460 | 1 | A1 |
| 5 |  |
3589 | 0 | E |
| 6 | 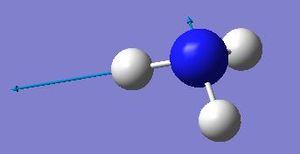 |
3589 | 0 | E |
MO's and NBO's of NH3
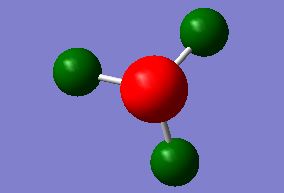
The same process to generate the MO's of borane has been implemented to the ammonia molecule. To generate the NBO'S the .log file from the population analysis was used and the results allowed calculation of charge distribution.
NH3 Molecular Orbitals:Media:NPA_NH3_MO.LOG
| Summary Information | Result |
|---|---|
| File type | .chk |
| Calculation type | SP |
| Calculation method | RB3LYP |
| Basis set | 6-31G(d,p) |
| Final energy | -56.55776856 au |
| Gradient | 0.0000000 au |
| Dipole moment | 1.85D |
| Point group | C1 |
| Calculation time | 37 Seconds |

| Atom | Charge |
|---|---|
| Nitrogen | -1.125 |
| Hydrogen | +0.375 |
| no. | Molecular Orbital | no. | Molecular Orbital |
|---|---|---|---|
| 1 |  |
4 |  |
| 2 | 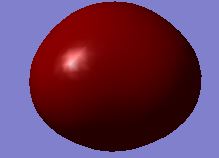 |
5 |  |
| 3 | 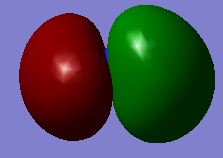 |
6 | 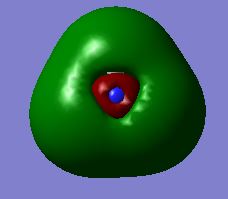 |
 Summary of Natural Population Analysis:

Natural Population
Natural -----------------------------------------------
Atom No Charge Core Valence Rydberg Total
-----------------------------------------------------------------------
N 1 -1.12515 1.99982 6.11104 0.01429 8.12515
H 2 0.37505 0.00000 0.62250 0.00246 0.62495
H 3 0.37505 0.00000 0.62250 0.00246 0.62495
H 4 0.37505 0.00000 0.62249 0.00246 0.62495
=======================================================================
* Total * 0.00000 1.99982 7.97852 0.02166 10.00000
Natural Bond Orbitals (Summary):

Principal Delocalizations
NBO Occupancy Energy (geminal,vicinal,remote)
====================================================================================
Molecular unit 1 (H3N)
1. BD ( 1) N 1 - H 2 1.99909 -0.60417
2. BD ( 1) N 1 - H 3 1.99909 -0.60417
3. BD ( 1) N 1 - H 4 1.99909 -0.60416
4. CR ( 1) N 1 1.99982 -14.16768
5. LP ( 1) N 1 1.99721 -0.31756
Reaction Energies
Optimisation of NH3BH3
To generate this molecule a molecular template of ethane was used with the carbon atoms being replaced with a nitrogen and a boron. This structure was then optimised using a 6-31G basis set and a calculation method of RB3LYP.
6-31G(d,p) Optimisation of NH3BH3 : Media:NPA_NH3BH3_FREQ.LOG

| Summary Information | Result |
|---|---|
| File type | .log |
| Calculation type | FOPT |
| Calculation method | RB3LYP |
| Basis set | 6-31G(d,p) |
| Final energy | -83.22468924 au |
| Gradient | 0.00002095 au |
| Dipole moment | 5.56D |
| Point group | C1 |
| Calculation time | 22 Seconds |
Item Value Threshold Converged?
Maximum Force 0.000037 0.000450 YES
RMS Force 0.000015 0.000300 YES
Maximum Displacement 0.000540 0.001800 YES
RMS Displacement 0.000242 0.001200 YES
Predicted change in Energy=-2.237685D-08
Optimization completed.

-- Stationary point found.
Frequency analysis of NH3BH3
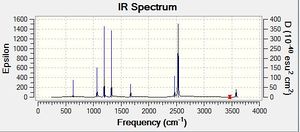
As implemented before the optimsiation basis set and calculation method are kept the same but the type is changed to frequency. This is to show that the molecule is at a minimum.
Frequency analysis of NH3BH3 : Media:NPA_NH3BH3_FREQ1.LOG
| Summary Information | Result |
|---|---|
| File type | .log |
| Calculation type | FREQ |
| Calculation method | RB3LYP |
| Basis set | 6-31G(d,p) |
| Final energy | -83.22468924 au |
| Gradient | 0.00002095 au |
| Dipole moment | 5.56D |
| Point group | C1 |
| Calculation time | 63 Seconds |
Low frequencies --- -11.2042 -0.0008 -0.0004 0.0011 12.2537 14.9711
Low frequencies --- 263.0537 632.9047 638.0070
Energy Calculations
| Molecule | Energy (au) |
|---|---|
| NH3 | -56.55776856 |
| BH3 | -26.61532363 |
| NH3BH3 | -83.22468924 |
Association energy= ΔE= E(NH3BH3)-[E(NH3)+E(BH3)]= (-83.2)-[-56.6-26.6)]= -0.05159705 au
Association energy= -135.4 kJ/mol
Dissociation energy= +135.4 kJ/mol
This is a strong dative bond as it is comparable in strength to the bond dissociation of I2, which has BDE(I-I)= 151 kJ/mol [3]
References
- ↑ Reffy, Balazs; Kolonits, Maria; Hargittai, Magdolna Journal of Molecular Structure, 1998 , vol. 445, 1-3 p. 139 - 148
- ↑ Kotz, John C., Paul M. Treichel., John R. Townsend. Chemistry and Chemical Reactivity. 7th ed. Australia: Thomson Brooks/Cole., 2009. Print.
- ↑ Blanksby, S. J.; Ellison, G. B.; (2003). "Bond Dissociation Energies of Organic Molecules". Acc. Chem. Res. 36 (4): 255–263.

