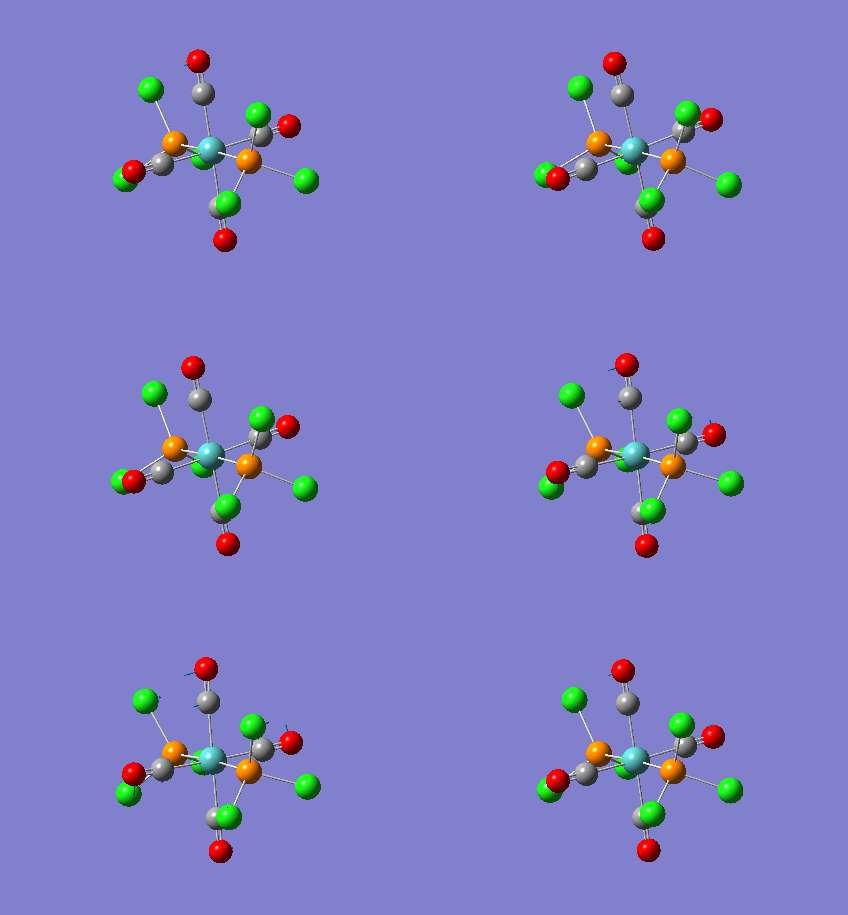
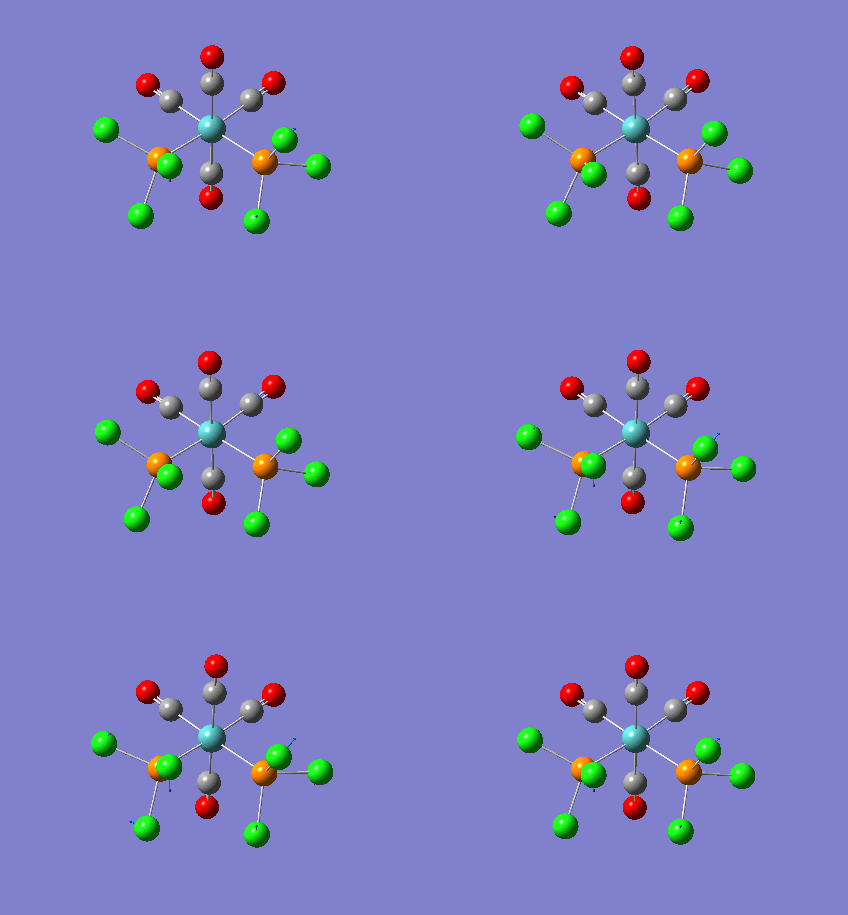
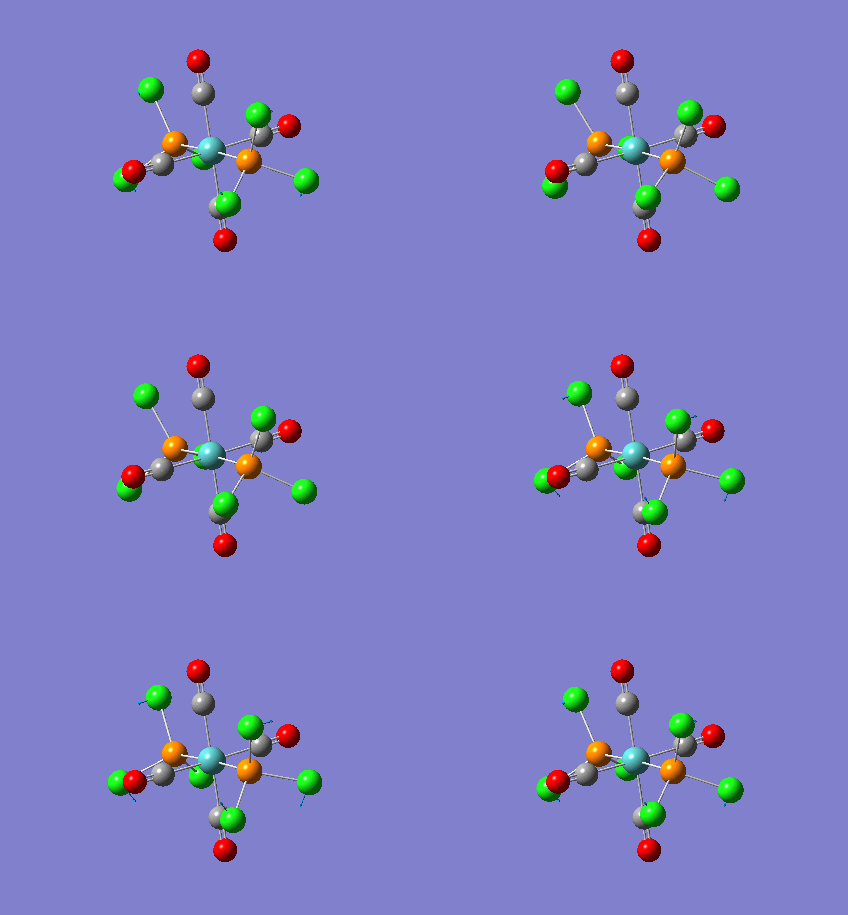
Rep:Mod:northern
Ryan Spence
Note on accuracy
Before the investigation is discussed, it should be stressed that the following computational methods have systematic error inbuilt. There is a ±10 KJ /mol error with the energies given in the calculations. This equals to be 0.00381 Hartrees (units which the program uses) and therefore energies are only accurate to 2 decimal places. There is a 10% error associated with every stretching frequency calculated which is relatively significant. This is due to the approximation of the harmonic oscillator where vibrations are in fact anharmonic. Furthermore, the dipole moment has an associated error to 2 decimal places, and intensities of peaks from IR are rounded to the nearest integer value. Bond lengths are accurate to 0.01 Å and bond angles to 0.1°. This should be kept in mind during the investigation.
Optimising a Molecule of BH3
A molecule of BH3 was created and optimised using Guassview 5.0. Guassview uses information about a molecule and displays it in graphical form and does so by quantum mechanical methods using Gaussian calculations. A file can be created and edited with Guassview, whilst Gaussian uses these files to run the calculations and store them in an output file. With this, the bonding and structure of BH3 can be examined.
Initially, each B-H bond length was set to 1.5A. Then, BH3 was optimised. To do this, two processes were used: SCF and OPT. This was used in conjunction with three parameters: B3LYP method, 3-21G basis.
The B3LYP (Becke 3-Parameter, Lee-Yang-Par) method is a hybrid exchange correlation functional, determining the approximations when solving Schrödinger’s equation in the SCF part of the calculation. That is, using Schrödinger’s equation to calculate the electron density and its associated energy when the nuclei are in a particular position. A basis set is used for Schrödinger’s equation and is the minimum number of atomic orbitals needed, when linearly combined, to construct the MO’s of a molecule. In this case, 3-21G basis set is used which has very low accuracy, but consequently calculations are made much quicker. Then, by selecting OPT, an optimisation of the molecule was computed by repeating the SCF cycle. This results in a geometry of BH3 with the lowest energy After optimisation, it was calculated that the H-B-H angle was 120o and the bond length was 1.19 A.
The output file was viewed as a "real" text based .log file and as a .chk file from Gaussian which is in a format only for the machine can read. A .com file was created when a job was submitted into Guassview.
| Filename | BH3 OPT |
| File Type | .log |
| Calculation Type | FOPT |
| Calculation Method | RB3LYP |
| Basis Set | 3-21G |
| Charge | 0 |
| Spin | Singlet |
| E(RB3LYP) | -26.462 a.u. |
| RMS Gradient Norm | 0.00016 a.u. |
| Imaginary Freq | |
| Dipole Moment | 0.0020 Debye |
| Point Group | C2V |
| Job cpu time | 7.0 seconds |
Product 7 |
The optimisation plots were then viewed, as shown below. The first graph shows the energy of BH3 at each step of the optimisation which converges to a minimum. The second graph gives the gradient of the energy of BH3 at each step of the optimisation, again converging to 0. The gradient is the rate of change of energy with respect to the number of geometry alterations.
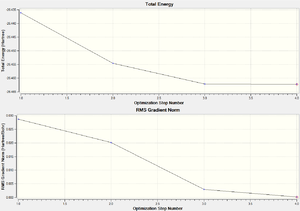
It can be seen that the gradient converges to less than 0.001 which indicates the optimisation was successful. Additionally, whilst analysing the animation of the optimisation steps, it was noted that no bonds were seen for the first step. This does not mean the bonds were inexistent; instead it is because the distance of the bonds exceeded the predefined value. In Guassview, the bonds are drawn upon a distance criterion which is a gross simplification but is the easiest and quickest way to assign atom connections. However, the definition i would chose for the existence of a bond would be the electron density between atoms. That is, a high electron density would indicate a bond which would give more accurate results. The stage at which the gradient converges to zero correlates to the most stable structure (that would be found in the gas phase). It is here where each B-H bond will be at equilibrium distance, represented on a Lennard-Jones curve as the minimum energy. At the equilibrium distance, the gradient = (-dE/dx) = 0. Thus, the attractive and repulsive forces will cancel each other out. The calculations performed find this equilibrium positions of the basis set by changing the dx (bond length) to minimise dE (bond energy) and is repeated many times until the gradient reaches zero.
Molecular Orbitals of BH3
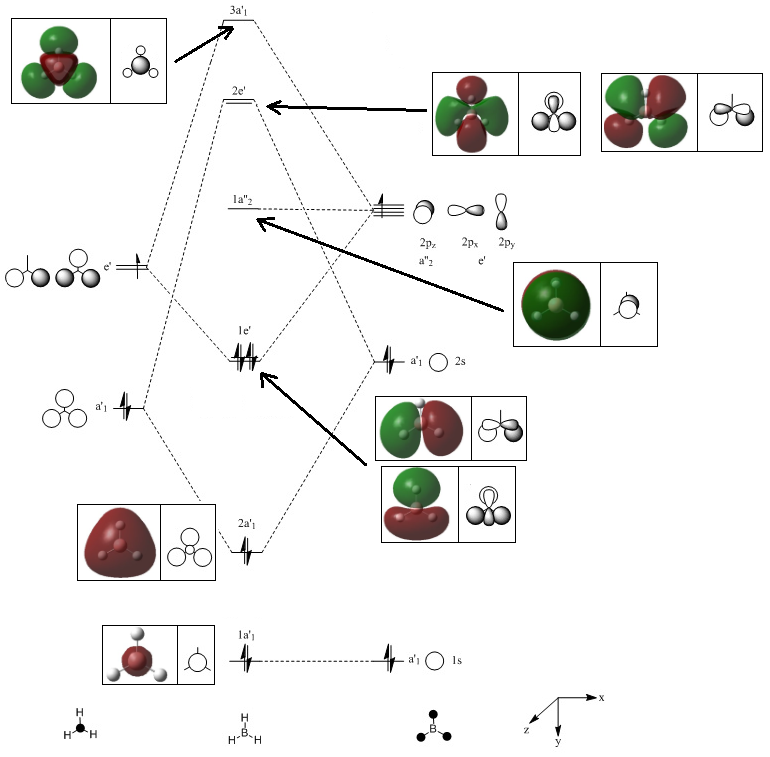
The .chk file from the BH3 optimisation was opened with the method set to energy instead of optimisation to analyse the molecular orbitals. The calculated MO’s can be seen below in comparison with the theoretical approach. The theoretical approach uses LCAO (linear combination of atomic orbitals) to construct the MO’s.
MO Diagram of BH3 DOI:10042/to-6706
The calculated MO’s are extremely similar to the theoretical MO’s. The important similarity is that the number of nodes is identical in each case, which determines the relative energy of each MO, along with orbital overlap, atomic orbital energies and similar sizes of atomic orbitals. The only difference between the two methods is that the in the calculated MO’s, two orbital lobes of the same phase are seen as a combination rather than two distinct orbitals. For example, the 1e’ orbital. Furthermore, the non bonding and antibonding orbitals are much more diffuse than the occupied orbitals, which is because they exist at a higher energy. Qualitative methods are good as a simple approximation, but for a more accurate representation of relative energies and orbital combinations, qualitative computational methods need to be used.
NBO analysis of BH3
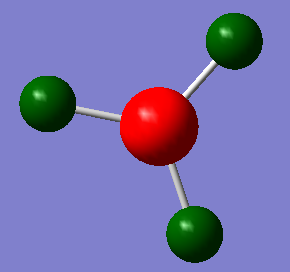
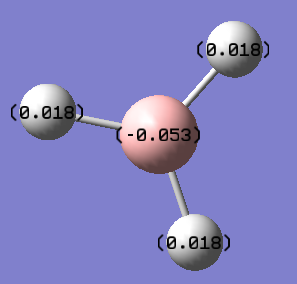
Using Guassview and the .log file from the Gaussian population analysis, an analysis of the natural bond orbital analysis was taken. The atomic charges can be seen by the differing colours on the molecule. The boron atom is highly positively charged (Lewis deficient) and is therefore a different colour to the highly negatively charged hydrogen atoms. By selecting the ‘show numbers’ option, it was noted that the NBO charge on the boron was 0.331 and for hydrogen was -0.110. Under the "Bond orbital/ Coefficients/ Hybrids" section, a description of the compound is given along with the bond orbital coefficients and hybridisation. The results can be seen below:
Under the ‘Natural Bond Orbital (Summary)’ section, the recorded energies and population of the B-H bonds and the boron lone pair (B(LP*)) can be seen. The results are shown below:
TAAAAAAAAAAAAAAABBBBBBBBBBBBBBBBBBBBBBBLLLLLLLLLLLEEEEEEEEEEEEE
The occupancy of each bond is approximately 2 electrons which correspond well with the "organic chemists" picture of 2e-2c bonding. The B lone pair is much higher in energy compared to the core and B-H bonds. This can be accounted for by the strong repulsion of the electrons in the lone pair. There are fewer attractive forces because the electrons because they are not situated between two positive atom centres, hence it is higher in energy. Under the "Second Order Perturbation Theory Analysis of Fock Matrix in NBO Basis" section, there is analysis of the interactions (mixing) between the different MO’s. However, for BH3 it is irrelevant.
Vibrational analysis and confirming minima
The frequencies (or vibrations) of BH3 were analysed on the optimised structure to confirm that the ‘minimum’ structure had been obtained. The ‘low frequencies’ correspond to the ‘-6’ of the overall 3N-6 vibrations that are possible, and are just the motions of the centre of mass of the molecule. Theoretically these values should be zero but in this case are not due to calculation inaccuracies. However, the first vibration (of A2’’ symmetry) has a frequency that is much larger than the ‘zero’ values of about 2 orders of magnitude. The fact that they are much smaller than the other frequencies means that the results are still reliable.
When determining the frequencies, the second derivative of the potential energy surface is being calculated which gives the curvature of the function. Essentially, it is the rate of change of the restoring force with respect to the distance. With only positive frequencies, a minimum exists but the occurrence of a negative value indicates a transition state. More than one negative frequency signifies a calculation error or optimisation has not worker properly. In this case, as seen in the table below, all the frequencies are positive which means a geometry of minimum energy was correctly identified.
The significance of frequency analysis is important because it can be compared to experimental IR spectra and a product can be correctly determined.
The six vibrational modes with their corresponding frequencies can be seen in the table below. The IR spectrum is also shown:
| Vibration Number | Vibration Animation | Frequency (cm-1) | Intensity | Symmetry of D3h point group |
| 1 | 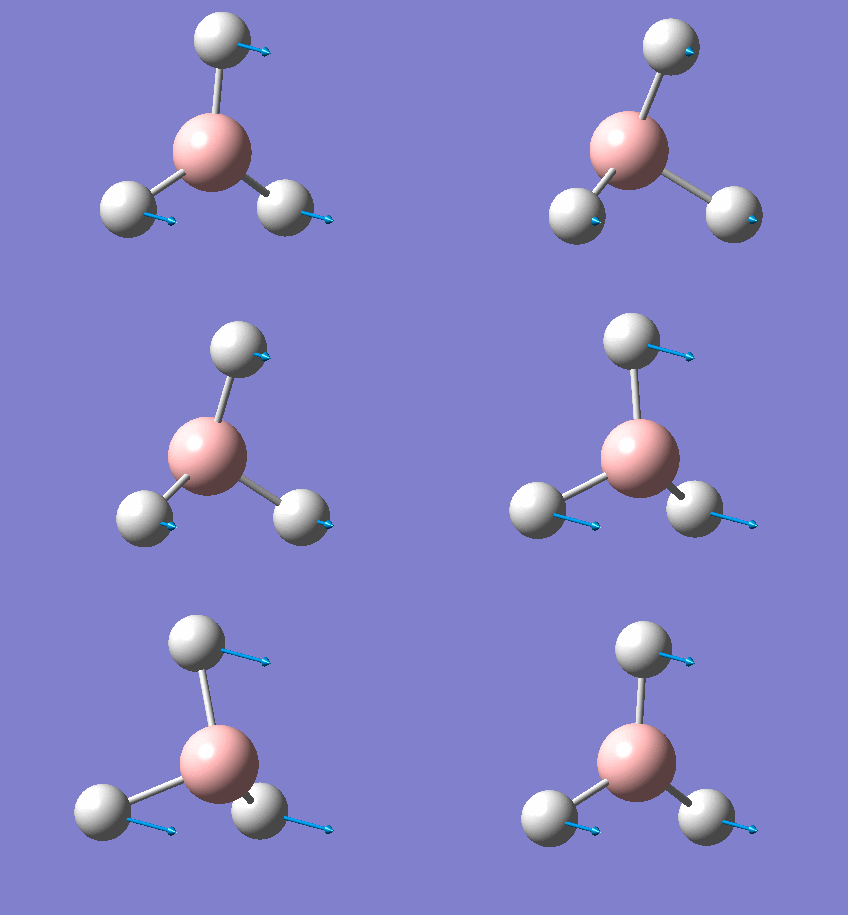 |
1146 | 93 | a" 2 |
| 2 |  |
1205 | 12 | e' |
| 3 | 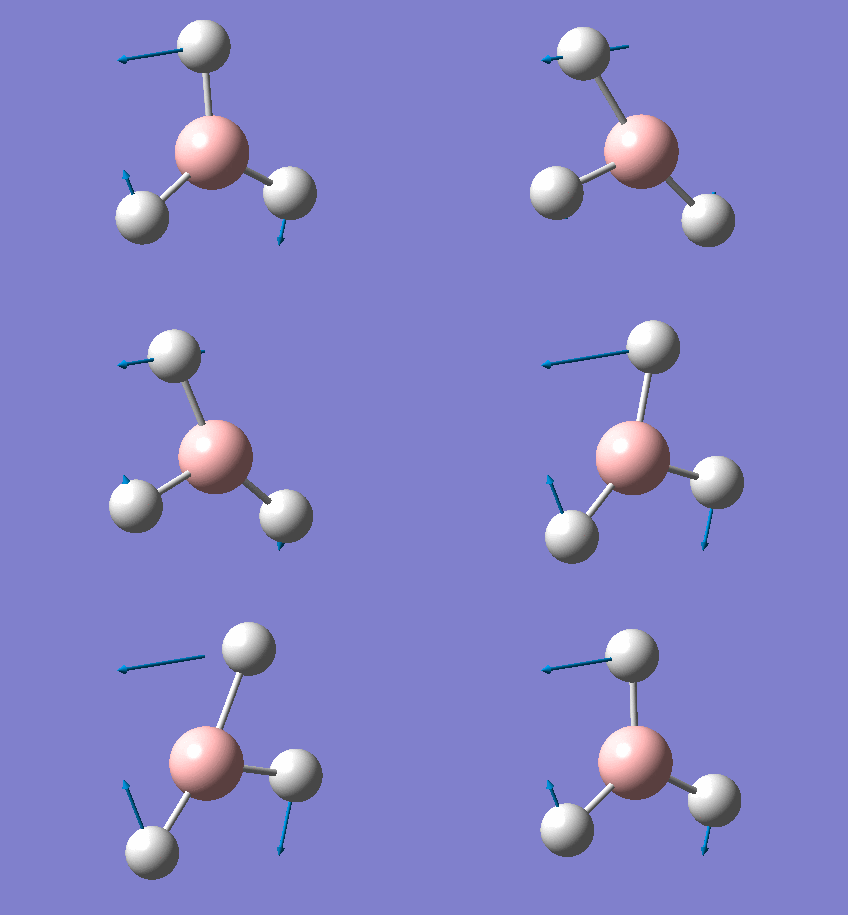 |
1205 | 12 | e' |
| 4 |  |
2592 | 0 | a' 1 |
| 5 | 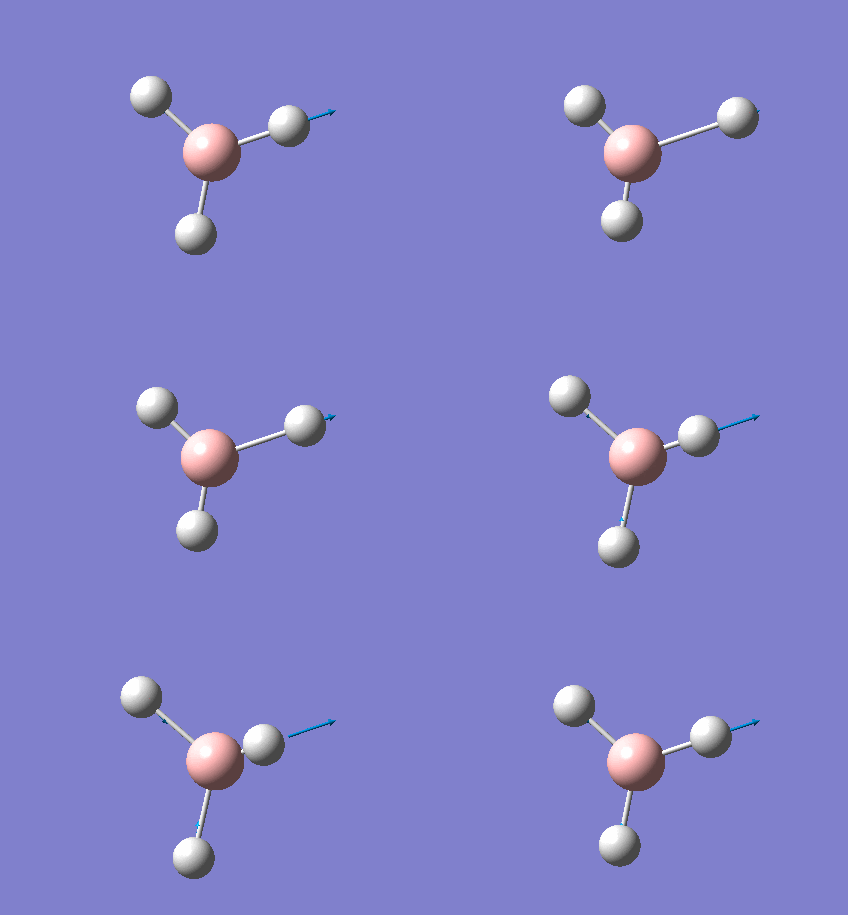 |
2730 | 104 | e' |
| 6 | 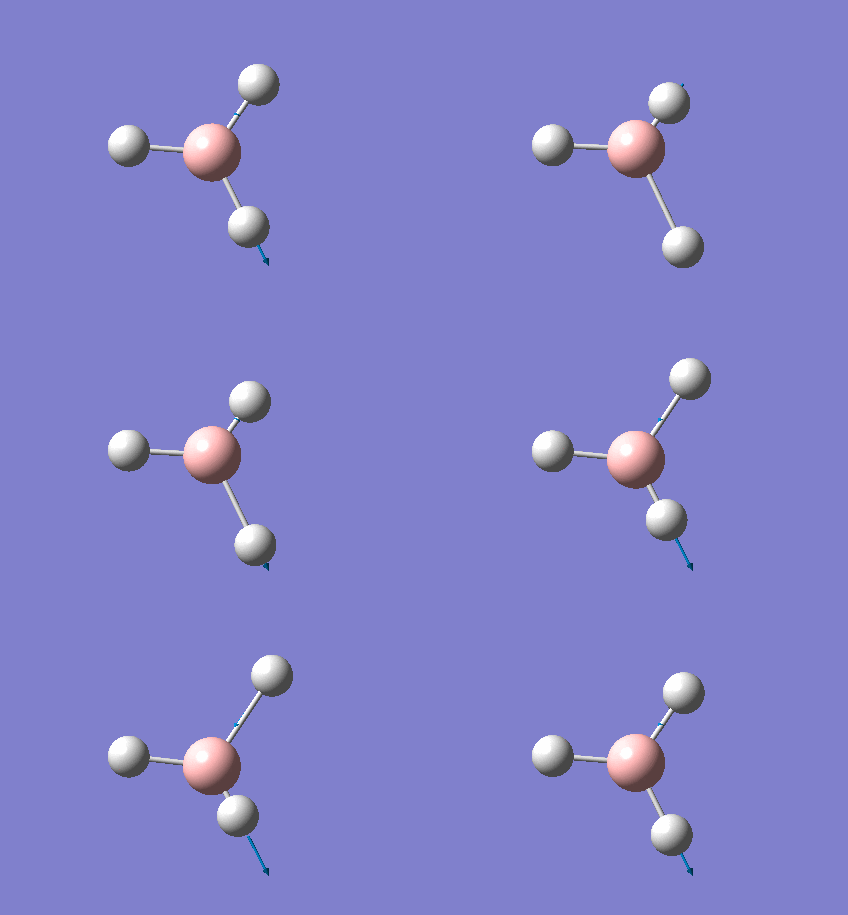 |
2730 | 104 | e' |
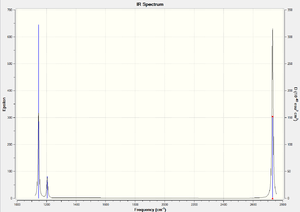
The IR spectrum shows three peaks. However, non linear molecules have 3N-6 modes of vibration, which indicates that BH3 should have 6 peaks. Only three peaks are observed because there are two sets of degenerate vibrational modes: 2+3 and 5+6. Also, vibrational mode 4 has an intensity of 0 and is therefore not observed. This is because the dipole moment does not change for this mode of vibration.
Calculations on TlBr3
The D3h ground state structure of TlBr3 was optimised. Guassview was used to create a D3h ground state structure of TiBr3 (within 0.0001 tolerance) which was then optimised using Guassian. Optimisation was carried out using the LANL2DZ basis set, a medium level basis set, and DFT/B3LYP method. The basis set used uses Los Alamos ECP (pseudo-potential) on heavier elements which simplify the calculations because, for TlBr3, there are many more electrons (186 e-) which would make calculations time consuming. A pseudo potential uses the assumption that it is only valence electrons that contribute to bonding interactions. The optimisation of TlBr3 using these methods can be seen below:
| Filename | TLBR3 OPT |
| File Type | .log |
| Calculation Type | FOPT |
| Calculation Method | RB3LYP |
| Basis Set | LANL2DZ |
| Charge | 0 |
| Spin | Singlet |
| E(RB3LYP) | -91.218 a.u. |
| RMS Gradient Norm | 0.00000090 a.u. |
| Imaginary Freq | |
| Dipole Moment | 0.00000 Debye |
| Point Group | D3H |
| Job cpu time | 2 minutes 29.0 seconds |
The bond angles and lengths were then compared with literature values:
| Tl-Br bond length/Å | Br-Tl-Br bond angle/ o | |
|---|---|---|
| Calculated | 2.65 | 120.0 |
| Literature[1] | 2.56 | 120.0 |
The bond lengths reported in literature are very similar to the calculated ones from optimisation. This indicates the correct geometry of minimum energy was found. However, the two are not exactly the same due to the assumptions and approximations used during the calculations.
Vibrational analysis of TlBr3
Using Guassian, the frequencies (or vibrations) of TlBr3 were analysed on the optimised structure to confirm that the structure with the minimum energy on the potential curve had been obtained.
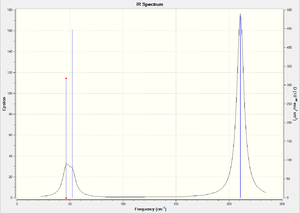
The same basis set used previously (LANL2DZ) was used to for the frequency analysis because to validitate reliably the minimum, the same set of calculations on the same functions must be used. Otherwise, the values will not correspond well. Furthermore, the ‘zero’ frequencies that corresponf to the ‘-6’ of the overall 3N-6 are all closer to zero than those of BH3. This signifies that the accuracy of this experiment is slightly better. The low and normal frequencies were obtained from the .log file and can be seen in the table below:
| Low frequencies (cm-1) | -3.42 | 0.00 | 0.00 | 0.00 | 3.94 | 3.94 |
| Normal frequencies (cm-1) | 46 | 46 | 52 | 165 | 211 | 211 |
In some structures gaussview does not draw in the bonds where we expect, does this mean there is no bond? Why?
As stated previously for BH3, some bonds are not shown on the structures given by Guassview. Again, the bonds are drawn upon a distance criterion and in these cases the distance of the bond has exceeded a predetermined set of bond lengths. However, this does not mean a bond does not exist because Guassview still recognises the electron density between the two atoms.
What is a bond?
A chemical bond is a connection of two nuclei where there is high electron density between the two centres. This conforms to the 2c-2e Lewis structure model. However, this is assuming electrons are particles. Electrons can also be thought of as waves with a de Broglie wavelength. In this case, the wavefuntion from each atom will overlap constructively so that the maximum of the wave occurs between the nuclei to produce an ‘in phase’ chemical bond and can be thought of as being spread out over the entire molecule.
Isomers of Mo(CO)4L2
Two Mo(CO)4L2 isomers where L=PPh3 will be examined. The cis and trans isomers will be optimised to calculate their relative thermal stabilities and hence the most stable isomer, which will then be confirmed through frequency analysis. However, the ligands in this case are very large and would be too expensive and time consuming to use. Thus, smaller ligands of chlorine were used instead because they have been shown to have similar electronic contributions to the bonding as phenyl groups. Also, they are still relatively bulky.
Four C=O absorption bands are expected from the cis isomer and only one band is expected from the trans ligands. The number of CO vibrational bands active is related to the symmetry of the complex where, using group theory, the cis isomer is identified to have C2v symmetry and the trans isomer has D4h symmetry.
Under the C2V point group, the cis isomer has the symmetry operations of E, C2, σV and σV'. By adding the traces of each transformation matrix, the reducible representation can be found: ΓR = χE + χC2 + χσV + χσV' = 4 + 0 + 2 + 2. Then, by using the formula: nIR = 1/h ΣQ kχIR (Q) χR (Q), the irreducible components can be found, where; χR(Q) = reducible representation character under Q, χIR(Q) = irreducible representation character under Q, h = number of operations associated with the point group, Q = particular symmetry operation, k = no. of operations of Q.
Using this formula gives 4 components in the irreducible representation: ΓIR = 2A1 + B1 + B2, which correspond to the Tx, Ty and Tz translation vectors. These have the same symmetry as the dipole moment and are therefore IR active. As a result, these four components will give four peaks in the C=O region (1700-2100cm-1) on the IR spectrum.
Under the D4h point group, the trans isomer has the symmetry operations of E, C4, C2, C2’, C2’’, i, S, σh, σV, σd. This gives the irreducible representation: ΓIR = A1g + B1g + Eu. The only IR active mode is Eu which has the same symmetry as the dipole moment. This will result in only one peak in the C=O region on the spectrum. Nevertheless, experimentally there will be a loss of D4h symmetry due to solvent interactions etc and create more than one absorption peak.
Optimising Mo(CO)4L2
Mo(CO)4L2 was optimised using the B3LYP method and a low level basis set LANL2MB to get an approximate geometry. A convergence criteria was used by adding ‘opt=loose’ in the ‘Additional keywords’ box so that the convergence limits is not more accurate than the method used. The optimisation results can be seen below:
| cis Mo(CO)4L2 | trans Mo(CO)4L2 | |
| Filename | MOCISOPT | MOTRANSOPT |
| File Type | .log | .log |
| Calculation Type | FOPT | FOPT |
| Calculation Method | RB3LYP | RB3LYP |
| Basis Set | LANL2MB | LANL2MB |
| Charge | 0 | 0 |
| Spin | Singlet | Singlet |
| E(RB3LYP) | -612.632 a.u. | -617.52203738 a.u |
| RMS Gradient Norm | 0.00021488 a.u. | 0.00013115 a.u. |
| Dipole Moment | 9.5089 Debye | 0.0000 Debye |
| Point Group | C1 | C1 |
| Job cpu time | 8 minutes 44.0 seconds. | 10 minutes 29.0 seconds. |
A second optimisation was run to increase the accuracy of the calculations. This is to confirm that the lowest energy minimum was found rather than another minimum on the potential energy curve. In order to find the true minimum, the torsion angle of the PCl3 groups were adjusted. For the cis isomer, one Cl was pointed up parallel to the axial bond, and the another Cl of the other group pointing down. For the trans isomer, both PCl3 groups were eclipsed and one Cl atom of each group were parallel to one Mo-C bond. For the second optimisation, a better LANL2DZ basis set was used with the same method B3LYP. The electronic convergence was increased by adding ‘int=ultrafine scf=conver=9’ to the ‘additional keywords’ section. The second optimisation results can be seen below:
| cis Mo(CO)4L2 | trans Mo(CO)4L2 | |
| Filename | log_37252 | log_37249 |
| File Type | .log | .log |
| Calculation Type | FOPT | FOPT |
| Calculation Method | RB3LYP | RB3LYP |
| Basis Set | LANL2DZ | LANL2DZ |
| Charge | 0 | 0 |
| Spin | Singlet | Singlet |
| E(RB3LYP) | -623.57707195 a.u. | -623.57603098 a.u. |
| RMS Gradient Norm | 0.00000491 a.u. | 0.00003399 a.u. |
| Dipole Moment | 1.3104 Debye | 0.3052 Debye |
| Point Group | C1 | C1 |
| Job cpu time | 1 hours 5 minutes 5.1 seconds. | 42 minutes 2.6 seconds. |
The LANL2DZ pseudo-potential and associated basis set is still not accurate enough, especially for the phosphorous atoms. These particular atoms have only a minimal basis (of valence s and p orbital function). But, P can be hypervalent where dAO’s can also constitute to bonding. To include this, the keyword ‘extrabasis’ was added to the .com file and the text shown below was added to the end of the file;
(blank line) P 0 D 1 1.0 0.55 0.100D+01
(blank line)
The third optimisation was then run and the results can be seen below:
Cis isomer: DOI:10042/to-6709 , Trans isomer: DOI:10042/to-6711 align=center
| cis Mo(CO)4L2 | trans Mo(CO)4L2 | |
| Filename | log_37255 | log_37251 |
| File Type | .log | .log |
| Calculation Type | FOPT | FOPT |
| Calculation Method | RB3LYP | RB3LYP |
| Basis Set | Gen | Gen |
| Charge | 0 | 0 |
| Spin | Singlet | Singlet |
| E(RB3LYP) | -623.69291203 a.u | -623.69415607 a.u. |
| RMS Gradient Norm | 0.00005659 a.u. | 0.00000538 a.u. |
| Dipole Moment | 0.0712 Debye | 0.2294 Debye |
| Point Group | C1 | C1 |
| Job cpu time | 30 minutes 3.7 seconds. | 44 minutes 35.4 seconds. |
The third optimisation gave slightly different geometries of the isomers and therefore different energies. It shows that the trans isomer is the most stable by approximately 3 kJ/mol which is only small. This agrees with literature (Darensbourg et al) that the trans isomer is the thermodynamically more stable one. This can be accounted for by the steric hindrance in the cis isomer where the electron clouds of the two PCl3 substituents will repel each other.
In order to change the relative order of the stability of the trans and cis isomers, the substituents attached to the phosphorous atom can be changed. Larger groups (eg phenyl) will arrange the geometry into the tans isomer to avoid steric clash, whilst smaller groups (eg H atoms) will arrange into the cis isomer.
Therefore, in order to alter the stability of the cis and trans isomers relative to each other, the size of the PR3 group can be changed. Large, bulky PR3 groups, such as PPh3 will favour the trans isomer, whereas smaller groups will favour the cis isomer. Furthermore, a more electron withdrawing /donating substituent may affect the relative stabilities by introducing back bonding into the molecule which may affect the relative stabilities of the isomers.
Frequency analysis of Mo(CO)4(PCl3)2
Frequency analysis was computed to confirm the true minimum of both isomers had been obtained during optimisation.
When analysing the .log file, there were no normal frequencies that were negative, but some negative values were obtained for the ‘zero values’. However, they were not larger than -5 cm-1 and were really close to zero indicating that the optimisation correctly identified the geometry of minimum energy. The table below shows the lowest frequency vibrations for both isomers:
Cis isomer:DOI:10042/to-6710 , Trans isomer:DOI:10042/to-6712
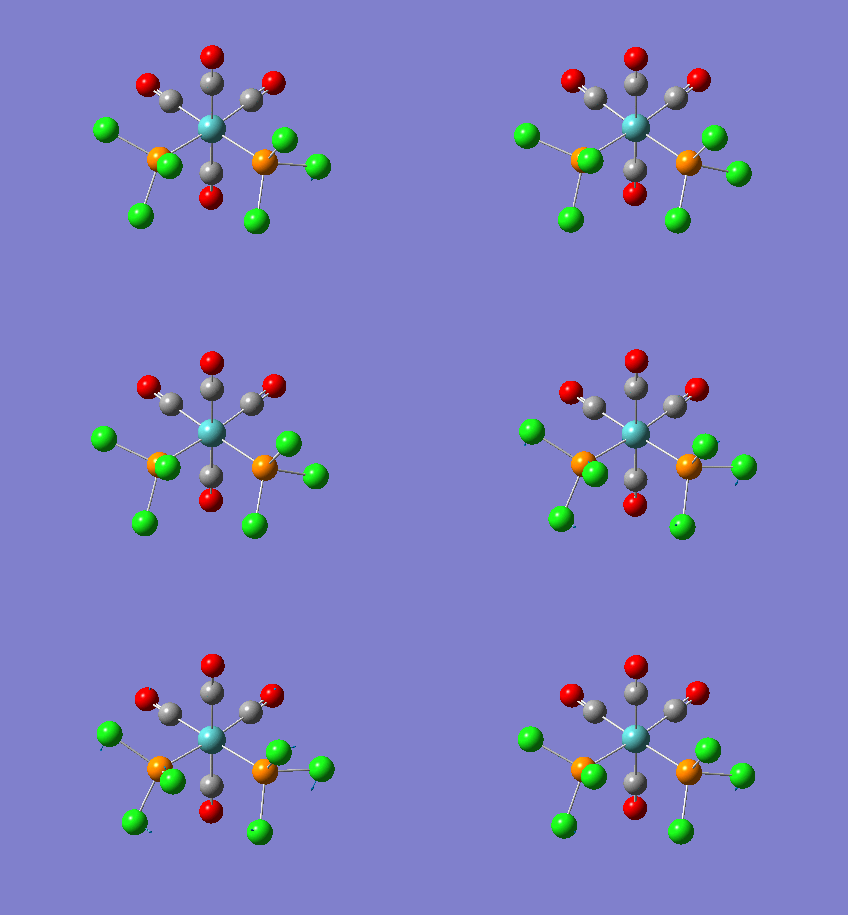
The vibrational modes of low frequency are occurring due to twisting motions around the Mo-P bond. These vibrational modes are of low energy and will occur at room temperature since there will be enough energy (KbT) to excite the molecules between vibrational levels. Thus, the isomers will be very quickly exchanging between energy levels so that at any one time, the molecule may experience either of the vibrational modes.
Comparison to literature values
The bond lengths and bond angles were compared with those found in literature to confirm if the optimisation process had calculated the minimum geometry.
| cis bonds | length (Å) | cis literature values | trans bonds | length (Å) | trans literature values |
| Mo-P | 2.48 | 2.52 | Mo-P | 2.42 | 2.50 |
| Mo-C | 2.02 | 2.03 | Mo-C | 2.06 | 2.01 |
| P-Cl | 2.12 | N/A | P-Cl | 2.12 | 1.84 |
| C=O | 1.17 | N/A | C=O | 1.17 | 1.16 |
| cis bonds | angle /o | trans bonds | angle /o | ||
| P-Mo-P | 94.29 | 97.54 | P-Mo-P | 91.63 | 92.00 |
| P-Mo-C | 89.37 | N/A | P-Mo-C | 89.22 | N/A |
| Cl-P-Cl | 99.61 | N/A | Cl-P-Cl | 99.84 | N/A |
| Cl-Mo-C | 89.93 | 92.1 | Cl-P-Cl | N/A | N/A |
The table shows that in general the two sets of values are in agreement with each other, signifying a good accuracy of the Gaussian calculations. The only significant difference is between the P-Cl bonds and the literature P-C bonds which is expected since the bonds in question are physically different.
Furthermore, in the cis isomer the equatorial Mo-C bond lengths were found to be very slightly shorter than the axial Mo-C bonds. This is due to the trans effect where electron withdrawing ligands that are trans to each other compete for electron density since. CO ligands in this case are electron withdrawing because strong backbonding occurs into the empty p orbital of the carbon.
The stretching frequencies of the C=O bonds for each isomer were compared to literature and from experimental data taken in 2nd year synthesis labs:
| Symmetry | Gaussian | Literature (Mo(CO)4(PCl3)2)[2]/ cm-1 | Experimental (Mo(CO)4(PPh3)2)/ cm-1 | Literature (Mo(CO)4(PPh3)2)[3]/ cm-1 | |
|---|---|---|---|---|---|
| Intensity | Frequency/ cm-1 | ||||
| A1(2) | 545 | 2019 | 2072 | 2014 | 2023 |
| A1(1) | 588 | 1952 | 2004 | 1917 | 1927 |
| B1 | 813 | 1942 | 1994 | 1903 | 1908 |
| B2 | 1605 | 1938 | 1986 | 1890 | 1897 |
| Symmetry | Gaussian | Literature (Mo(CO)4(PCl3)2)[4]/ cm-1 | Experimental (Mo(CO)4(PPh3)2)/ cm-1 | Literature (Mo(CO)4(PPh3)2)[3]/ cm-1 | |
|---|---|---|---|---|---|
| Intensity | Frequency/ cm-1 | ||||
| A1g | 5 | 2026 | N/A | N/A | N/A |
| B1g | 6 | 1967 | N/A | N/A | N/A |
| Eu | 1606 | 1940 | 1896 | 1893 | 1908 |
| Eu | 1606 | 1939 | 1896 | 1893 | 1902 |
The table shows that the values are in the same region for both the calculated and literature frequencies. However, they are not exactly the same for either isomer. In each case, the calculated values are slightly smaller indicating that the optimised structure actually gave a structure with weaker bonds. This is accounted for the replacement of the phenyl groups with Cl atoms instead which will have an overall effect on the C=O bond. Analysing the above table, it can be seen that the difference in calculated and literature values is less for the trans isomer. This may be because the C=O bonds are not affected by the replacement of phenyl groups to Cl atoms because the trans effect will not occur.
For the trans isomer, only two of the vibrational modes (2Eu) are IR active as explained previously which can be seen in this case. Since the two active modes are degenerate, these have the same vibrational energy and therefore only appear as one peak on the spectrum. The other two non IR active modes do not change the dipole moment of the molecule and therefore have extremely small intensities. The fact that any intensity is observed for these modes (which should have 0 intesities) indicates that the molecule is not completely symmetric. The cis isomer has 4 peaks as theorized earlier because there are 4 IR active modes of vibration.
Mini Project
Introduction
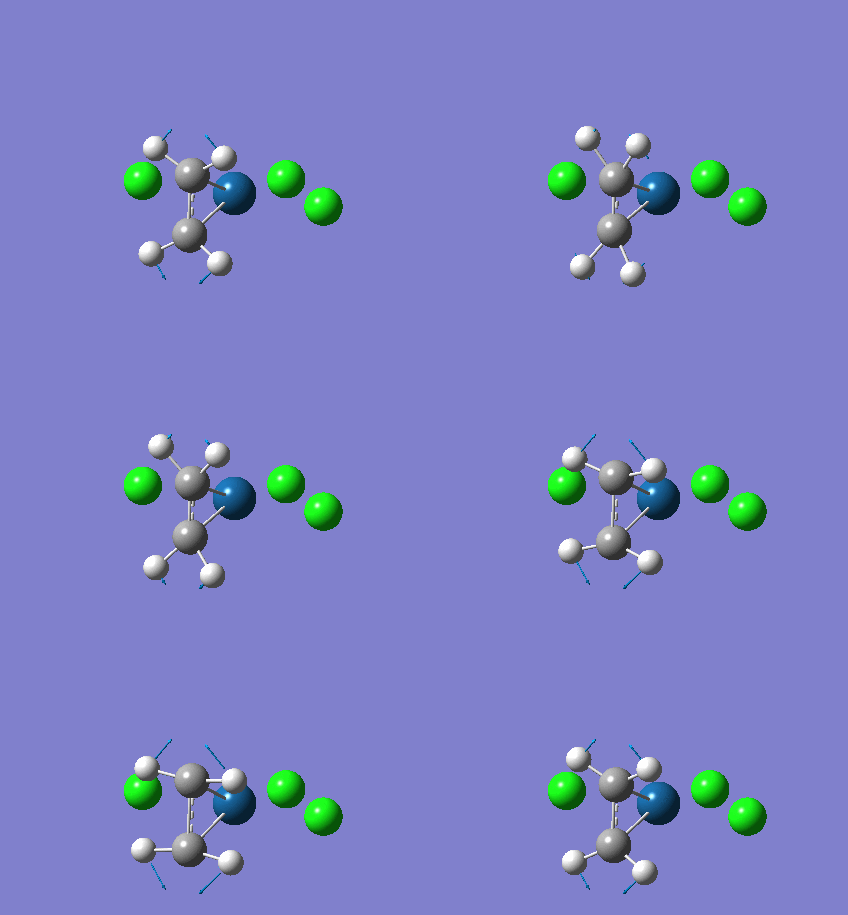
Organometallic compounds have becoming increasingly important towards the latter half of the 20th century. One of the first examples of these was Zeise’s salt (K[PtCl3(C2H4)]•H2O), which has a square planar geometry and was key in defining new concepts such as hapticity. Hapticity is a term to describe a ligand that has more than one atom bonded to the metal centre. In Zeise’s salt, it is understood that both carbons in the ethane ligand are bonded to the platinum, as described by Dewar-Chatt-Duncanson model. This haptcity was confirmed using x-ray diffraction in the 20th century. Changing the ligands, or tuning atoms on the ligands, can have a significant effect on the reactivity on Zeise’s salt and will be explored in this project.
Aim
The aim of this experiment is to investigate how the bond strengths, geometries and vibrational frequencies change with when the ligands, or atoms, are varied. As a result, the change in reactivity can be predicted. This will be done by using the following compounds: [PtCl3(C2H4)], [PtCl2(CO)(C2H4)], [Pt(PCl3)2(C2H4)], [Pt(PCl3)2(CH2=CHCN]. The first two compounds listed here will be analysed to see how the CO ligand effects the bond strength of the alkene through backbonding, and the last two will investigate how the CN group (instead of H on the alkene) will affect the alkene properties. In many literature reports, PPh3 is used as a ligand for two of the compounds. However, in this investigation PCl3 will be used instead because it would be much cheaper and quicker. The use of Cl units will give similar results because the stereoelectronics of Cl are very close to that of Ph.
Optimisation
The molecules were firstly drawn into guassview and then optimised twice to obtain geometries of minimum energies. For the first optimisation, the DFT/B3LYP calculation method was used along with a low level basis set and associated psedo poteintial (LANL2MB). This is so that an approximate optimized structure could be obtained to reduce the time necessary for the second optimisation. The "opt=loose" keyword was added so that the accuracy of the basis set matched the accuracy of the method and convergence limits used. These calculations took no longer than 10 minutes to run. Afterwards, a second optimisation was run with a more accurate basis set and pseudo potential (LANL2DZ). The electronic convergence was set to 9 by adding the keyword: "int=ultrafine scf=conver=9" which will increase the step size. The timing for these optimisations greatly varied, but on average took approximately 40 minutes per structure. The table below shows the data from the second optimisation:
| [PtCl3(C2H4)] | [PtCl2(CO)(C2H4)] | [Pt(PCl3)2(C2H4)] | [Pt(PCl3)2(CH2=CHCN] | |||||||||||||
|---|---|---|---|---|---|---|---|---|---|---|---|---|---|---|---|---|
| File type | .log | .log | .log | .log | ||||||||||||
| Calculation type | FOPT | FOPT | FOPT | FOPT | ||||||||||||
| Calculation method | RB3LYP | RB3LYP | RB3LYP | RB3LYP | ||||||||||||
| Basis set | LANL2DZ | LANL2DZ | LANL2DZ | LANL2DZ | ||||||||||||
| Charge | -1 | 0 | 0 | 0 | ||||||||||||
| Spin | Singlet | Singlet | Singlet | Singlet | ||||||||||||
| E(RB3LYP) | -242.81588341 a.u. | -341.04216941 a.u. | -300.51030474 a.u. | -392.72124637 a.u. | ||||||||||||
| RMS Gradient Norm | 0.00005140 a.u. | 0.00002511 a.u. | 0.00000209 a.u. | 0.00000066 a.u. | ||||||||||||
| Dipole moment | 5.7474 Debye | 7.4187 Debye | 4.3959 Debye | 3.7660 Debye | ||||||||||||
| Point Group | C1 | C1 | C1 | C1 | ||||||||||||
| Job cpu time | 0 days 0 hours 13 minutes 38.0 seconds | 0 days 0 hours 15 minutes 9.0 seconds | 0 days 4 hours 57 minutes 6.0 seconds | 0 days 3 hours 34 minutes 48.6 seconds | ||||||||||||
| DOI | Media:ryanPtCl3CH2CH2opt.out | Media:ryanPtCl2COCH2CH2.out | Media:ryanPt(PCl3)2CH2CH2part1_of_file.rtf Media:ryanPt(PCl3)2CH2CH2part2_of_file.rtf | DOI:10042/to-6947 | ||||||||||||
| Structure |
|
|
|
|
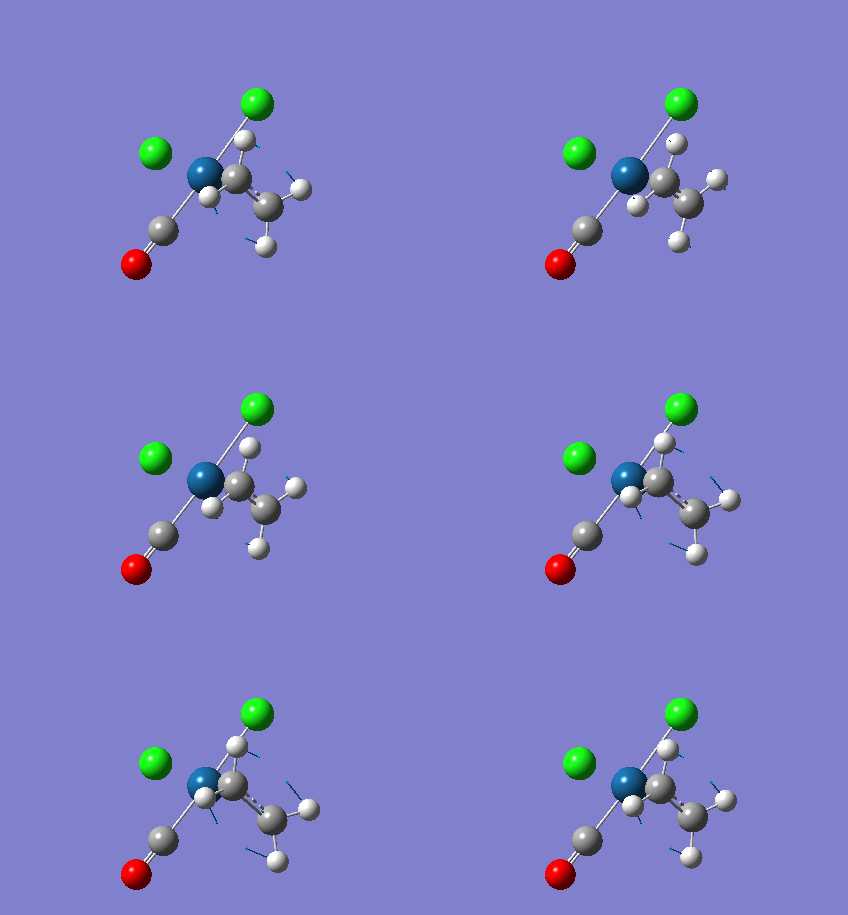
Here, the point groups are optimised to be of C1 symmetry but it is known that the complexes are in fact C2V. This is assuming that the ligands are classed as point charges in which the hydrogens on the alkene ligand are ignored. This discrepancy is attributed to the Gaussian structures originally drawn that were not completely symmetrical.
Dewar-Chatt-Duncanson model
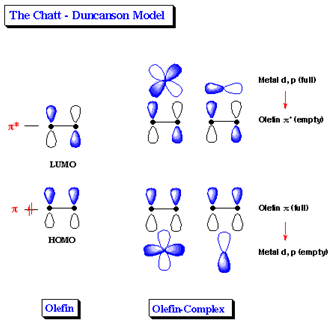
Before further analysis of data for the compounds is investigated, it is important to understand the bonding between the metal centre and the alkene. This special type of bonding is attributed by the Dewar-Chatt-Duncanson model, and is shown schematically below:
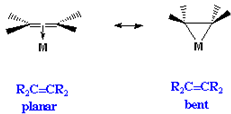
The HOMO of the alkene consists of a p orbital from each carbon atom that overlap constructively. This filled orbital donates electron density to a metal d and p orbital with similar symmetry. This creates a sigma bond. The LUMO orbital of the olefin involves two p orbitals that overlap deconstructively. This empty orbital accepts electron density from d and p orbitals from the metal, commonly known as pi-backbonding. As backbonding increases, the hybridisation of each carbon changes from sp2 character to sp3 character. This is shown below:
Hence, the alkene ligand changes from having predominatly double bond character to single bond character. Hence, analysing the C=C bond gives good indication on the M-(C=C) bond and the effects other substituents may have on the properties.
Analysis of bond lengths and angles
The optimised bond lengths and angles were compared to literature values to see whether the calculated optimisation was correct:
| Complex | Alkene bond length/ Å | Literature value alkene bond length/ Å | Alkene bond angle C=C-H/ o | Literature value alkene bond angle/ o |
|---|---|---|---|---|
| PtCl3CH2CH2 | 1.42 | 1.40 | 120.03 | |
| PtCl2(CO)CH2CH2 | 1.41 | 120.17 | ||
| Pt(PCl3)2CH2CH2 | 1.42 | 120.33 | ||
| Pt(PCl3)2CH2CHCN | 1.47 | 120.34 |
The literature values for the bond lengths are in close agreement with the calculated values confirming that the optimisations are reliable and accurate. As expected, the bond length of the C=C bond decreased when CO was substituted for Cl. This is because CO is a very good pi acceptor ligand and undergoes backbonding with the metal centre. Hence, some of the Pt electron density is being donated to CO which means less electron density is available to be backbonded to the olefin. Consequently, the M-(C=C) bond increases and the C=C bond decreases as the carbons become predominatly sp2 hybridised. This corresponds well with the calculated (C=C-H) bond angles because the angle increased for [PtCl2(CO)(C2H4)] meaning that the carbon atom mostly resembles a trigonal planar site, rather than the increased tetrahedral character observed for the carbon atoms in [PtCl3(C2H4)].
Furthermore, the bond length of C=C increased when changing from [Pt(PCl3)2(C2H4)] to [Pt(PCl3)2(CH2=CHCN)]. This is because the electron withdrawing CN group on the alkene ligand induces a larger partial positive charge on the adjacent carbon. Thus, it is more electrophilic and attracts electrons from the metal centre through backbonding. As a result, the increase in backbonding decreases the M-(C=C) bond and increases the C=C bond, which is observed in the calculations above. This also corresponds with the reported angles. The presence of the CN group makes the carbon atom more sp3 hybridised and therefore the angle decreases.
Frequency Analysis
A frequency analysis was taken for each complex to confirm that the optimisations found the geometries with minimum energy. Also, the frequencies of the C=C bonds can be analysed to see how the bond strength has changed with different substituents. This can be seen in the table below:
CCCCCCCCCCCCCCCCCCCCCCCCOOOOOOOOOOOOOOOOOOOOOOOOOOOOOOOOOOOOOOOMMMMMMMMMMMMMMMMMMMMMMMEEEEEEEEEEEEEEEEEEEEENNNNNNNNNNNNTTTTTTTTTTTTTTTTTTTTTTTTT
MO analysis of Zeise's salt
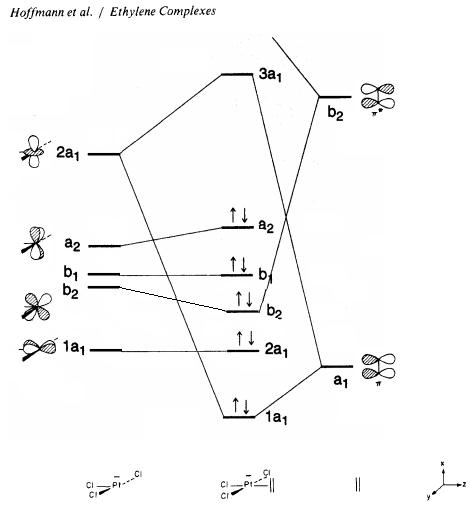
The frontier molecular orbitals were computed so that they can be compared with theoretical approaches used in literature. There MO diagram for Zeise's salt was found in literature. However, there are many varying diagrams that have been theorized, making the comparison to the calculated data particularly difficult. Nevertheless, it was observed that the two most common MO diagrams involve the metal d orbitals and the alkene pi and pi* orbitals as the frontier orbitals as found in Hoffman et al. It is apparent that the ordering of the computed MO’s is mixture of the two literature diagrams, and can be seen schematically below:
The frontier molecular orbitals produced are shown below. They are compared with the theoretical molecular orbitals.
| MO: 1a1 (HOMO-4) | MO: 2a1 (HOMO-3) | MO: b2 (HOMO-2) | MO: b1 (HOMO-1) | MO: a2 (HOMO) | MO: 3a1 (LUMO) |
|---|---|---|---|---|---|
 ] ] |
 |
 |
 |
 |

|
The theoretical molecular orbitals taken from the MO diagram are in good agreement with the calculated MO diagram. It is clear that the metal alkene σ-bond lies within the 1a1 (HOMO-4) orbital where the central lobe of the dz2 orbital constructively overlaps with the pi orbitals from the alkene ligand. Here, there is considerable mixing occurring in the MO with three chlorine atoms. This MO is considerably ligand based since it lies closer to the filled alkene AO.
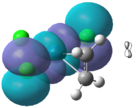
The 2a1, b1, and a2 orbitals do not overlap with the olefin and are therefore non bonding. The b2 MO is produced when the b2 AO from the PtCl3 and the antibonding orbital from the alkene overlap. The two orbitals are of similar symmetry, however there is a considerable energy difference which makes the stabilisation energy smaller. The antibonding MO in the diagram is 3a1 (LUMO). The orbital that undergoes backbonding with the metal centre is the LUMO+1 orbital which is not shown in the MO diagram. There is strong overlap between the pi antibonding of the alkene and a filled d orbital from the platinum. This orbital corresponds to the b2 atomic orbital from the PtCl3- and is shown below:
NBO Analysis
Below is summarised to NBO analysis for the four compounds:
| [PtCl3(C2H4)] | [PtCl2(CO)(C2H4)] | Pt(PCl3)2CH2CH2 | Pt(PCl3)2CH2CHCN | |
|---|---|---|---|---|
| Pt centre | -0.153 | 0.052 | ||
| C1 of alkene | -0.484 | -0.397 | ||
| C2 of alkene | -0.484 | -0.397 |
As expected the electron density on the carbon atoms decreases with the substitution of a Cl unit with a carbonyl ligand. This decrease is evident by the smaller negative values seen on each carbon atom in diagrams above. This is because of less backbonding to the metal centre in which the alkene will receive less electron density. As mentioned previously, this is because of the strong pi acceptor properties of the CO ligand which will compete for electrons from Pt. Consequently the Pt atom has a more positive charge. Because the carbons are more + charged, they are therefore more susceptible to nucleophilc attack.
NBO
PtCl3CH2CH2 Media:ryanPtCl3CH2CH2nbo.out
PtCl2COCH2CH2 [[Media:]]
Pt(PCl3)2CH2CH2 [[Media:]]
Pt(PCl3)2CH2CHCN [[Media:]]
Conclusion
Conclusion
References
- ↑ M.R. Bernejo et al., Polyhedron, 1988, 7, 2561-2567 DOI:10.1016/S0277-5387(00)83874-7
- ↑ ELmer C. Alyea and Shuquan Song, Inorg. Chem., 1995 34, 3864-3873 DOI:10.1021/ic00119a006
- ↑ 3.0 3.1 D. J. Darensbourg and R. L. Kump, Inorg. Chem, 1978, 17 2680-2682 DOI:10.1021/ic50187a062
- ↑ F. A. Cotton, Inorg. Chem., 1964, 3, 702-711 DOI:10.1021/ic50015a024

