Rep:Mod:nnnmmm
Module 3: Transition states and reactivity
The Cope Rearrangment
A Sigmatropic rearrangment is the the concerted migration of a group from one point of attachment to another point of attachment, during which one σ bond is broken and another σ bond is made. The Cope Rearrangement[1] is an example of a [3,3]-Sigmatropic pericyclic reaction. In the following module Gaussian is used with Hartree-Fock and Density functional methods to first optimise the reactant 1,5-hexadiene, find the transition state for the Cope rearrangement and run IRC calculations to link the transition state to one of the conformers of 1,5-hexadiene. The Cope rearrangement is shown below.

Optimizing the Reactants and Products
a)
Using GaussView a molecule of 1,5-hexadiene was drawn, the four central atoms were drawn with approximately an anti peri planer arrangement (a dihedral angle of about 180o), the structure was tidied with the clean function. The structure was then optimized using the Hartree Fock method and the 3-21G basis set. The energy of the optimized structure was obtained from the summary along with the point group and other important details. The central dihedral angle was found to be 177.0o which is slightky distorted from the ideal anti peri planer angle. This first optimization is shown as "anti 1 conformer" in the below table.
b)c)d)
This process was repeated except an approximately gauche conformation was drawn where the central dihedral angle was approximately 60o. The results from this optimization are shown as "Gauche 3 conformer" in the below table. Usually the gauche conformation for vinyl and alkyl complexes are found to be higher in energy than the anti conformations due to steric clashes between the larger groups. This can be seen by looking at the Newman projections for the two gauche conformations shown in the table below, clearly the double bonds are closer to each other than they are in the anti conformations and therefore a much a larger destabilising steric interaction is expected. However as can be seen from the above table the gauche 3 conformation is slightly lower in energy than the anti 1 conformation (by 0.16 kj/mol) indicating that there is some other effect other then sterics dominating. The energy difference is very small as expected as it is two conformations that are being looked out, both of which are low energy conformations and will be very close in energy. Theoretically there are 27 possible confirmations[2] for 1,5-hexadiene however when the symmetry and the enantiomerism of the conformations is taken into consideration there are only 10 distinct conformations, these 10 are shown in Appendix 1. Before the reasons for the relative stabilities of the two conformations already found are considered, other and hopefully lower energy confirmations of both the anti and gauche conformations were attempted to be found. This was done by varying the the central dihedral angle and the direction of the two double bonds. Other conformations were found two of which are shown in the below table. However no lower energy conformtions could be found, it was initially thought that anti 2 would be lower in energy then anti 1 and gauche 4 would be lower in energy than gauche 3 as the double bonds are further away from each other and pointing the opposite direction. However this is not the case and the lowest energy conformations of both the anti and the gauche seem to be where the double bonds are facing the same way, this is most easily seen in the Newman projections.
The fact that the direction of the double bonds seems to have an affect on the calculated energy it would be informative to calculate the Molecular orbitals for both the lowest energy gauche and lowest energy anti conformations (anti 1 and gauche 3). The Homo's for both conformations are shown below.
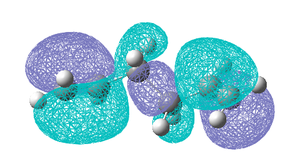
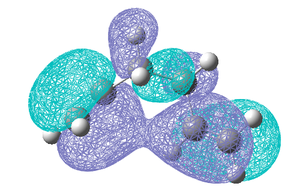
As can be seen above the HOMO of the gauche 3 conformation extents across both double bonds as it seems the two π orbitals are interacting and stabilising the molecule. This overlap is not observed in the anti 1 conformation and is likely to be one of the interactions overriding the steric repulsion and stabilising the gauche conformation. Based on this MO analysis it might be thought that when the π bonds are even more aligned i.e in a syn arrangement this overlap would be even larger and more stabilising, therefore a syn conformer was drawn in GaussView but on optimization it reverted back to a gauche conformation. Also it is possible that in the gauche forms there may be additionl attractive Van der Waals attractions between H atoms (also know as the gecko effect) stabilising the gauche conformation. Therefore it can be concluded that which conformation is the most stable is determined by a number of factors, namely steric effects and interaction of the two π orbitals of the HOMO, and the lowest energy conformation is obtained when a balance between these two effects is obtained. The conformations that have been found have been compared to those in the Appendix 1 the energies and structures were found to match well and the names given to each conformation correspond to this appendix.
e)f)
The anti 2 conformer with Ci symmetry was reoptimized using density functional theroy (DFT) with the B3LYP/6-31G* method (a higher theory method). The result of this optimization is shown here-
| - | HF/3-21g | B3LYP/6-31g(d) | Literature[3] |
|---|---|---|---|
| Energy/ Hartree | -231.6925 | -234.6117 | |
| Bond length C=C | 1.32 | 1.33 | 1.34 |
| Bond length CH2-CH) | 1.51 | 1.50 | 1.50 |
| Bond length (CH2-CH2 central) | 1.55 | 1.55 | 1.54 |
| Dihedral angle 1 (C=C-C-C) | -114.7 | -118.5 | |
| Dihedral angle 2 (C-C-C-C) | 180.000 | 180.000 | |
| Dihedral angle 3 (C-C-C=C) | 114.7 | 118.6 |
Using this higher level basis set and method has resulted in slightly different geometry, there is little variation in the bond lengths but the variation in dihedral angle is much larger. The DFT/B3LYP/6-31G* method gives the larger dihedral angle of 118o and proves that using this higher level theory does yield more accurate results. Although the energies are presented in the table a comparison between the two cannot be made as different methods have been used.
g)
To be able to compare the calculated energy terms with those of experimental values a frequency calculation needs to be run, this allows the necessary additional terms to be included as well confirming the conformer is a minimum on the potential energy surface. The frequency calculation was run with the same level of theory. As well as producing the vibrational modes of the structure which can be animated thermodynamic information can be obtained from the log file. More specifically the four energies shown in the table below are useful when looking into the thermodynamics of a reaction. The first energy is the potential energy at 0K and includes the zero point energy, the second value includes the energy at the defined temperature plus the contributions from vibrational, rotational and translational. The third includes a correction made for RT (H=E+RT) and is useful when looking at dissociation reactions, and the fourth includes a contribution from the entropy. Firstly these values were calculated at 298K and then the input file was edited to also calculate them at 0K, this was done by running a frequency calculation again with the same level of theory but adding the keywords Freq=ReadIsotopes and editing the the end of the input file to define the temperature pressure and masses of the atoms, this had to be edited as shown below.
350.0 1.0 temp pressure [scale]
12.0 isotope mass for atom 1
1.0 isotope mass for atom 2
1.0 isotope mass for atom 3
1.0 isotope mass for atom 4
2.0 isotope mass for atom 5
  blank line
So for 0K 1 atm and C=12 and H=1 this appeared as shown below.
0.0 1.0
12.0
1.0
1.0
12.0
1.0
12.0
1.0
1.0
12.0
1.0
1.0
12.0
1.0
12.0
1.0
1.0
This gave different energy values but on examining the log file the temperature was not actually set to 0k, it was still 298.15K. Therefore the different energy values must be due to something else. The method used above to calculate these energies at 0K can also be used to calculate the energies when one of the atoms is substitued for one of its isotopes hence the list of atoms and their masses that were added to the input file, but here we did not want to change any of the masses so each atom was set to the most common isotope as gaussview would normally use, however the masses that gaussian uses in these calculation is probably much more accurate than the values it was set to in the above calculation. Hence different less accurate energies were obtained. These results are shown under the "0K" column in the below table. In an attempt to obtain the energy values at 0K the same method was used but the temperature was set to 0.00001K. In the results the temperature now read 0K in the log file, and the energies from this calculation are are shown in the 0K column. Here is shown the energy values for all three calculations.
| Energies | 298.15 K (atomic units) DOI:10042/to-7124 | "0 K" (atomic units)DOI:10042/to-7123 | 0 K (atomic units) DOI:10042/to-7122 |
| Sum of electronic and zero-point energies | -234.4692 | -234.4688 | -234.4688 |
| Sum of electronic and thermal energies | -234.4619 | -234.4614 | -234.4688 |
| Sum of electronic and thermal enthalpies | -234.4609 | -234.4605 | -234.4688 |
| Sum of electronic and thermal free energies | -234.5008 | -234.5003 | -234.4688 |
All the energies are the same at 0K as expected as any thermal contributions will now be zero and the energy is equal to sum of the electronic and zero point energies. The first three energies are more negative at 0K, and it is only when the entropy is included that the molecule is more stable at a higher temperature. The vibrational frequencies and IR spectra are almost identical at 0K and 298K.
Optimizing the chair and boat transition states
Optimizing the chair transition state a)b)c)d)
Next the transition state structures of the Cope rearrangement will be optimized, the first method used to do this will be by optimzing to transition state (maximum on the poteintial energy curve) but computing the force constants only at the beginning of the calculation.
A CH2CHCH2 allyl fragment was drawn in GaussView and optimized using HF/3-21G level of theory. The optimized fragment was then pasted twice into a new file and the two optimized fragments were orientated so they looked roughly like the chair transition state as shown in Appendix 2 with the distances between the two terminal carbon atoms set to approximately 2.2 Å. The first method to be used (computing the force constants) works well as long as the initial guess of the transition state geometry is reasonable. This transition state optimization was carried out (along with a frequency calculation), to do this the option 'optimize to a minimum' needs to be changed to optimize to a TS (Berny)' and the force constants need to be calculated once. Also the keywords Opt=NoEigen were added to ensure that the calculation will not crash if more than one imaginary frequency is found during the optimization. The resulting geometry corresponds well to the transition state shown in Appendix 2 As expected there is an imaginary frequency at 818cm-1 and when this vibration is animated it is possible to see that this imaginary frequency illustrates where the bonds are broken and formed in the transition state. The results of this calculation are shown below under the column 'Optimised through a TS (Berny)'.
Secondly the transition state was optimized using the frozen co-ordinate method. This involved freezing the coordinates of the two sets of terminal carbons to be 2.2Å apart, it is between these atoms that the bonds are made and broken in the reaction. This was done using the Redundant Coordinate Editor on Gauusview, and the structure was optimized as if it were a minimum. Then another optimization was carried out this time to a transition state, with the freeze coordinates option changed to derivative and the force constants were not computed. The results of this optimization resulted in an almost identical geometry as achieved by the first method and again the results are displayed below.
The two methods employed here are essentially the same, the 2nd method just carries out the optimization in two steps, firstly as mentioned before the atoms where the bonds are made and broken are frozen and the rest of the structure is optimized to its lowest energy geometry then in the 2nd step the coordinates are unfrozen and allowed to relax into the transition state geometry. Where as in the first method these steps are carried out at the same time, because this is a small system and the initial guess of the transition state was quite good the correct results are obtained in the faster 1st method.
| Optimised through a TS (Berny) | Optimised through a frozen coordinate method | |||||||
| Optimised TS Structure | ||||||||
| Terminal C-C bond length (Å) | 2.02 | 2.02 | ||||||
| Energy (atomic units) | -231.6193 | -231.6193 | ||||||
| ΔE, TS (Berny) - frozen coordinate | 5.7 x 10⁻⁷ a.u | 1.50 x 10⁻³ KJ mol-1 | ||||||
| Imaginary frequency (cm-1) | -818 | -818 | ||||||
| Animation |
|
|
Optimizing the boat transition state e)
Next the boat transition structure will be optimized, this time using the QST2 method, this allows the reactants and the products of a reaction to be specified and the calculation will interpolate between the two structures to find the transition state between them. Firstly the optimized anti 2 structure of hexadiene was copied into a new window ,a second window was opened within the new window and the same molecule was pasted in again, one molecule for the reactants and one for the products. It is essential that the numbering of the atoms in each molecule is correct, the numbering of the products must correspond to that of the reactants as shown in the below diagram. This was done manually.

Now the QST2 calculation was run, this was run as an optimization and a frequency calculation, it was optimized to a transition state (TS (QST2)). The calculation failed this is because when the calculation linearly interpolated between the two structures it just translated the top allyl fragment and didn't rotate around any of the central bonds, therefore the reactant and product geometry's need to be modified so they are closer to that of the boat transition structure, this was done by setting the central dihedral angle to 0o and the internal C-C-C bond angle to 100o this was also done for the product molecule. Now the reactant and product looked as below. The correct numbering of the atoms can also be seen in this diagram.
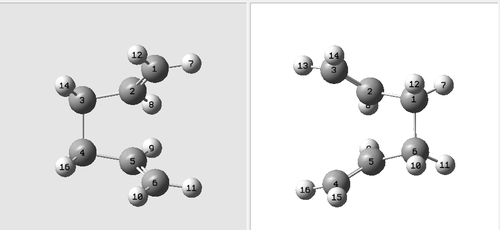
The QST2 calculation was then run to find and optimise the boat transition state and also calculate the frequencies, again the HF/3-21G level of theory was used. The results of this are shown below.
| Optimised through a QST2 method | ||||
| Optimised TS Structure | ||||
| Terminal C-C bond length (Å) | 2.14 | |||
| Energy (atomic units) | -231.6028 | |||
| Imaginary frequency (cm-1) | -840 | |||
| Animation |
|
There is an imaginary frequency at -840 cm-1 indicating that a transition state has been found. This vibration is animated above and is very similar to the imaginary frequency found for the chair transition states. The vibration shows one bond forming while the other is broken, which is what is expected for the transition state of the cope rearrangment. The QST2 method of optimizing the transition state is much more tedious than the TS(Berny) method used earlier, this is because the numbering of of the reactants and products had to exactly correspond to each other and the geometries must be close to that of the transition state, otherwise the optimization will fail.
Intrinsic Reaction Coordinate calculations f)
From looking at the chair and boat transition states it is not possible to tell which conformation of hexadiene the transition state formed from or is going to, i.e the conformation of the reactant and product. However the Intrinsic reaction coordinate (IRC) method can be used to follow the minimum energy pathway from the transition structure down to its local minimum on a potential energy surface.
Chair
This calculation was first run on the optimized transition chair structure as obtained earlier and it is hoped that the results will reveal or give some indication of the conformer of the reactant and product. The reaction coordinates were only computed in one direction as the Cope rearrangement is symmetric, the force constants were only calculated once and the number of points along the IRC was set to 50. The results of this are shown below.
| Calculate force constants once | |||
| Number of points along IRC | 24 | ||
| Structure at the last point of IRC | |||
| Energy (atomic units) | -231.6881 | ||
| IRC pathway | 
| ||
| IRC gradient | 
|
As only 24 points along the IRC were calculated and the calculation did not proceed up to 50 points, this indicates that the minimum geometry has been found. Also the gradient is very close to zero (0.0007) and the energy appears to have converged, hence why the calculation stopped at 24 points. The jmol file in the table above shows the geometry of the molecule at the 24th point, therefore this structure should resemble one of the conformations either found earlier or presented in Appendix 1. Clearly it is a gauche conformer but isn't either of the two gauche conformers found earlier on in this exercise. Therefore the table given in appendix 1 was examined, the conformer from the IRC calculation appears to be the the gauche 2 conformer with C2 symmetry, this can be more easily visualized by looking at the Newman projection shown here.

This conformer was not found earlier but the energy can be compared to that in the appendix. The energy from the calculation is -231.6881 Hartrees and the energy given in the appendix for this conformation is -231.69167 Hartrees, relatively this is quite a big difference indicating that the the geometry is not quite the same and perhaps the minimum point has not quite been reached. The script states that there are three things that can be done if the IRC calculation has not reached a minimum geometry, the first is increase the number of points but this is not relevant here as when 50 points were specified the calculation stopped at 24, so it doesn't matter how many points were specified the calculation would still stop at 24. Secondly it suggests taking the last point (geometry) from the IRC and run a normal minimization, this suggestion was tried first. The final geometry was optimized to a minimum using the HF/3-21g method. Thirdly the script suggests rerunning the IRC calculation but computing the force constants at every step, this method is most reliable and therefore will be carried out for comparison with the original method used. A summary of the three methods is presented below, the gauche 2 conformer was not found earlier therefore a full comparison of the geometry's found using the IRC method to that of the optimized conformer is not possible, however an energy comparison can be done from the appendix and a comparison of bond lengths can be done to the fully analysed anti 2 conformation as it is likely they will be very similar to that of the gauche.
| - | IRC calculate force constants once | Normal minimization from last point on IRC | IRC calculate force constants always DOI:10042/to-7125 | Values from appendix or obtained earlier |
|---|---|---|---|---|
| Energy/ Hartree | -231.6881 | -231.6917 | -231.6917 | -231.6917 |
| Bond length C=C /angstroms | 1.31 | 1.32 | 1.31 | 1.32 |
| Bond length CH2-CH /angstroms | 1.50 | 1.50 | 1.51 | 1.51 |
| Bond length CH2-CH2 central / angstroms | 1.56 | 1.55 | 1.55 | 1.55 |
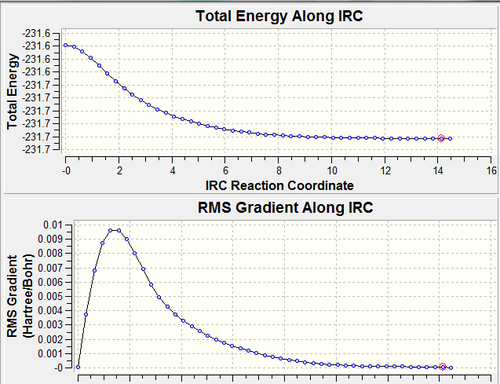
From examining the table above it can be seen that the three methods used don't product results that are much different, the changes in the geometry are minimal. The most noticeable difference is that of the energy it was mentioned earlier that the first IRC calculation when the force constants were only computed once appeared to reach the minimum geometry however the energy of this conformer did not match up with that in the appendix. The second method employed resulting in an energy exactly the same as in the appendix but the bond lengths and angles don't appear to have changed, this indicates that the first method got very close to but quite at the minimum point and because it was so close this simple optimization to a minimum reached the actual minimum geometry very quickly. The final calculation was carried out as it is known to be the most accurate and however the results are almost exactly the same as was previously obtained, however interestingly 47 points along the IRC were calculated this time. The IRC graphs and the final geometry (47th) are shown below for the calculation when the force constants were calculated at every step, it is clear that the total energy plateaus a lot sooner as does the gradient which also reaches a value much closer to zero. The more obvious plateau on both the graphs confirms that this final method is the most accurate and the resulting geometry of the product can be assigned most confidently as the minimum. In the resulting geometry of all three calculations the central CH2-CH2 bond isn't drawn by gaussview, this does not mean that the bond isn't there and cannot be used as a reason to say that the calculations have not completed.
Boat
The same process was carried out for the boat, firstly running a calculation when the force constants calculated once, then with them calculated always which still didn't appear to find a minimum so the number of points was increased from 50 to 80. The results are shown below.
| Force constants calculated once, 50 points along IRC DOI:10042/to-7206 | Force constants calculated always, 50 points along IRCDOI:10042/to-7207 | Force constants calculated always, 80 points along IRCDOI:10042/to-7108 | ||||||||||
|---|---|---|---|---|---|---|---|---|---|---|---|---|
| Structure at final point |
|
|
| |||||||||
| Energy/ Hartrees | -231.67903 | -231.68409 | -231.69265 | |||||||||
| Number of points along the IRC | 32 | 51 | 78 | |||||||||
| IRC pathway and gradient | 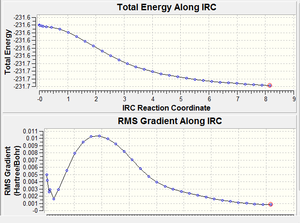 |
 |
 |
The first calculation stopped after 32 points, the total energy graph and gradient graph appear to be be reaching a plateau indicating the minimum energy product had been found. However when the final geometry was looked at it was found to be a syn conformer where the double bonds were aligned and the central dihedral angle is 0o. The steric clash between these two groups will be large and this is seen in the energy of the molecule which is much higher then any of the conformers found earlier or presented in Appendix 1. In an attempt to improve the calculation as the geometry obtained in the first is unlikely to be that of the product, a second calculation was run where the force constants were calculated at every step of the calculation, the number of points along the IRC was still 50. Calculating the force constants at every step reduces the approximation in the calculation, previously the force constants were calculated only once at the beginning and then these values were used at every point of the calculation however the force constants will change slightly each time so calculating them at very step produces more accurate results.
The final geometry here has moved out of the high energy syn conformer and the dihedral angle is now 15o, however the energy is still quite high and the geometry seems to be somewhere in between that of a syn and gauche conformer. Also the calculation ran to the full number of points that it was set to suggesting that it has not completed. This can also be seen from the graph of the RMS gradient along the reaction coordinate which appears to reach a plateau but then start increasing again. Therefore the IRC calculation was re-run but the number of points was increased to 80. This yielded a more sensible result and the graph of the gradient shows a flat section which then increases and plateaus so that first section was probably what was observed in the second calculation. The calculation stopped just short of the full 80 points at 78 indicting that it has completed. Interestingly the final molecule corresponds to a different conformer than was found in the IRC calculation on the chair transition state, here the product is in the gauche 3 conformer. The energy is found to be -231.69265 Hartrees and the energy of the gauche 3 conformer found in the initial exercise was -231.69266 Hartress, they are in excellent agreement and the central dihedral angle was found to be identical. It can be concluded that each of the transition states produce the product molecule in different conformers and if the energy difference between the different conformers was large then this would be a nice example of the kinetic product being the gauche 2 conformer from the more stable chair transition state and the thermodynamic product being the gauche 3 conformer as the more stable product from the less stable transition state. However the energy difference between the conformers is very small and it is likely that they can easily convert between at room temperature.
Calculating the activation energies g)
One final calculation was carried out on the HF/3-21G optimized chair and boat transition structures. This was an optimization to a transition state (berny) and a frequency calculation at the higher level of theory DFT/B3LYP/6-31G(d). It was this level of theory that was used to optimize the different conformers of the hexadiene therefore reoptimizing at this level will allow the activation energies to be calculated. Also to compare the two levels of theroy the anti 2 conformer of hexadiene was optimized with the HF/3-21G this will allow the activation energies to be calculated at both levels and then compared to literature. Firstly the chair transition states will be looked at after the minimization at each level of theory to see what effect this has on the geometry.
| HF/3-21G | DFT/B3LYP/6-31G(d) DOI:10042/to-7127 | ||||||
|
|
Clearly the geometry's are slightly different with the largest difference being that of the terminal C-C bond forming/breaking distance, which is calculated to be smaller in the second optimization. A higher level of theory will give more accurate results therefore this second geometry can be considered to be closer to that of the real chair transition state. Furthrmore the imaginary frequency using the DFT was found to be -565 cm-1 compared to -818cm-1 in the HF calculation, this lower frequency indicates a gentler gradient of the the potential energy curve about the maximum found of the transition state, indicating a better optimization. This can be confirmed by calculating the activation energies, this is done by comparing the energys of the transiotion states to that of the of the reactant. As previously established by the IRC calculations it is infact the the gauche 2 conformer that the transition state proceeds to in the forward direction therefore it ia most likely as the reaction is symmetrical that this is the conformer that will also be found in the backwards direction, therefore ideally it should be the energy of this conformer that is used to calculate the activation energies. However this conformer has not been optimized at either level of theory and is therefore not convenient to use, instead the anti2 conformer will be used as it has been studied in most detail. To allow a full comparison of the two levels of theory this anti conformer had to be optimized at the HF/3-21G level of theory. Along with this optimixation calculations frequcney calculations were done so that the thermochemistry data could be obtained. The energies obtained for both transition states and the reactant at both levels of theory are presented below.
| HF/3-21G | HF/3-21G | HF/3-21G | B3LYP/6-31G* | B3LYP/6-31G* | B3LYP/6-31G* | |
| Electronic energy | Sum of electronic and zero-point energies | Sum of electronic and thermal energies | Electronic energy | Sum of electronic and zero-point energies | Sum of electronic and thermal energies | |
| at 0 K | at 298.15 K | at 0 K | at 298.15 K | |||
| Chair TS
D space file for DFT calc.DOI:10042/to-7127 |
-231.61932 | -231.46670 | -231.46134 | -234.55698 | -234.41493 | -234.40901 |
| Boat TS
D space file for DFT calc.DOI:10042/to-7126 |
-231.60280 | -231.45093 | -231.44530 | -234.54309 | -234.40234 | -234.39601 |
| Reactant (anti 2)
D space file for the HF calc.DOI:10042/to-7129 |
-231.69024 | -231.53832 | -231.53111 | -234.61171 | -234.46920 | -234.46091 |
Now these energies have been calculated the activation energies can be obtained. To calculate the activation energy at 0K the value of the "Sum of electronic and zero point energies" for the reactant was taken from this energy of each tansition state (at the same level of theroy). The same process is carried out at 298.15K by using the "Sum of the electronic and thermal free energies". The results are shown below and converted to kcal/mol so a they can be compared to literature values.
| HF/3-21G | HF/3-21G | B3LYP/6-31G* | B3LYP/6-31G* | Experimental | |
| - | at 0 K | at 298.15 K | at 0 K | at 298.15 K | at 0 K |
| Activation Energy to the Chair TS/Hartrees | 0.07162 | 0.06977 | 0.05427 | 0.05190 | - |
| Activation Energy to the Chair TS/ Kcal/mol | 44.9 | 43.8 | 34.1 | 32.6 | 33.5 ± 0.5 |
| Activation Energy to the Boat TS/ Hartrees | 0.08739 | 0.08581 | 0.06686 | 0.06490 | |
| Activation Energy to the Boat TS/ Kcal/mol | 54.8 | 53.8 | 42.0 | 40.7 | 44.7 ± 2 |
The first thing to note is the similarity of the activation energies to the ones given in the scipt when the higher level of theroy is employed, the chair activation energy is only 0.1 kcal/mol of when the error of the literture value is taken into condsideration and such a small difference can be put down to errors in the calculation. The boat activation energy is slightly further off but still very close. The fact the the DFT method gives lower activation energies and closer to that literature indicates that this method found the actual transition state. It is also clear that the chair transition state is lower in energy than the boat transition state and hence the activation energy is a lot lower this suggests that the kinetic pathway for this reaction would be via the chair transition state and not the boat, this is most likley a result of the the larger steric repulsions present in the boat transition state. The different variation from the litertaure values for the boat and chair may be due to the difference methods emplsyed to optimise the transition states.
Conclusion
The symmetric Cope reaaragment was investigated, first the reactant molecules were optimized to find some low energy conformers, then two possible transition states were optimized and compared. IRC calculations were run to link the optimized transition state to one of the conformers of the product and finally the activation energies were calculated. Three different methods to optimized the transition states were employed and the two levels of theory were tried for comparison. From this it can be concluded that the gauche 3 conformer of hexadiene is the most stable as a result of the balance between sterics and favourable orbital overlap, the chair transition state is lower in energy than the boat thus the activation energy to the chair is lower, furthermore better results were obtained when calculating the activation energies using the DFT/B3LYP/6-31G method than with the HF/31-G method, however there was litle change in the geometry's therefore it is good to run a low level calculation to get the rough geometry then run a calculation at a higher levelto get a more fine tuned geometry and more accurate energy values . The two methods used to optimize the chair transition state produced similar accurate results and the the QST2 method used to optimize to the boat was a lot more time consuming. The IRC calculations showed the product to be the gauche 2 conformer which is surprising as this is not the lowest energy conformer of hexadiene that exists.
Diels Alder
A Diels Alder reaction is a type of cycloaddition reaction in which a cyclic organic molecule is created from a diene and a dieneophile, the reaction is pericyclic meaning it is concerted and proceeds in one step. Here the diene being investigated is 1,3-butadiene and the dieneophile is ethylene. The mechanism is shown below, however does not fully illustrate it. What can not be seen is that the reactants approach each other on approximately parallel planes and the new bonds form as a result of overlap of the π orbitals.[4]. More specifically the HOMO of the diene and the LUMO of the dieneophile, these two orbitals can only overlap if they have the same symmetry to allow a significant amount of overlap density. Also when the diene and dieneophile and are substituted it is likely that there will be secondary orbital interactions controlling the regiochemistry of the reaction, this will also be investigated by considering the reactants Maleic Anhydride with Cyclo-1,3-hexadiene.

Butadiene and ethylene
Optimizing the Reactants

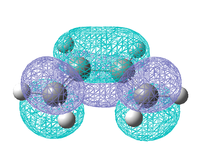
Firstly the prototypical Diels Alder reaction between and will be investigated. Both reactants were optimized using the AM1 semi-emperical method and the HOMO's and LUMO's were plotted. As mentioned before it is important to consider the symmetry of the molecular orbitals as this is what decides whether a reaction is allowed or not. It is known that ethylene approaches butadiene from above as shown in this diagram. Therefore each computed molecular orbital will be assigned as symmetric or antisymmetric with respect to this plane of symmetry. The results are shown below.
.
| Cis-butadiene HOMO |
Cis-butadiene LUMO |
Ethylene HOMO |
Ethylene LUMO | |
|---|---|---|---|---|
| Molecular Orbital |  |
 |
 |

|
| Energy / Hartree | -0.343 | 0.017 | -0.387 | 0.052 |
| Symmetry (wrt plane) |
Antisymmetric | Symmetric | Symmetric | Antisymmetric |
The HOMO of butadiene is antisymmetric as is the LUMO of ethylene therefore as long as these two orbitals are close enough in energy they will interact. The same principle applies to the HOMO of the ethylene and the LUMO of butadiene which are both symmetric. To confirm if it is these orbitals interacting the transition needs to be found and its molecular orbitals computed. The HOMO's of both reactants are the π orbitals and the LUMO's are the π* orbitals.
Optimizing the transition state
It is known the transition state has an envelope structure so that the overlap of the π orbitals is maximised therefore as an initial guess of the transition state the optimized butadiene and ethylene were pasted into the same gaussview window. The ethylene was placed above the butadiene and slightly angled away, the distance between the carbon atoms where the sigma bonds are formed was approximately 2.1 angstroms. The first method tried was to optimize to a transition state (TS berny) calculated the force constants once using the semi-empirical AM1 level of theory. Secondly the frozen coordinate method was employed to break down the optimization into two steps, the C-C bond forming distances were set to 2.1 angstroms and an optimization to a minimum was carried out, the bond were then unfrozen and a TS berny optimization was carried out. This method was carried out at the semi-empirical AM1 and DFT/B3LYP/6-31-G* level of theory. The results from each optimization is shown below, frequency calculations were also carried out.
| Method | Semi-empirical/AM1 optimize to Berny TS | Semi-empirical/AM1 optimized through frozen coordinate method | DFT/B3LYP/6-31G(d)optimized through frozen coordinate method DOI:10042/to-7128 | |||||||||
|---|---|---|---|---|---|---|---|---|---|---|---|---|
| Optimized transition state |
|
|
| |||||||||
| Energy /Hartrees | 0.11162 | 0.11163 | -234.54389 | |||||||||
| C-C bond forming/breaking distance/ angstroms | 2.1 | 2.1 | 2.3 | |||||||||
| Imaginary frequency / cm-1 | -956 | -956 | -523 | |||||||||
| Animation of vibration |
|
|
|
The first thing to note is that the first two calculations produce almost identical results, where as the higher level of theory produces a slightly different geometry most noticeably the bond forming distance is increased to 2.3 angstroms form 2.1 angstroms. All the imaginary frequencies found correspond to the bond forming process of the reaction and the bond forming is found to be synchronous. The lowest positive frequency of each of the optimizations did not correspond to any bond forming in the transition but to the rotation of the ethene molecule in the opposite direction to the butadiene molecule about the plane of symmetry of the molecule.
Typically a C-C single bond is 1.544 angstroms, a C-C double bond is 1.338 angstroms[5] and the van der waals radius of carbon is 1.70 angstroms[6]. These values can be used to characterise the bonds in the transition state. The bonds that were originally double bonds are now longer indicting that they are starting to take on some single bond character, the same applies for the single bond in butadiene which in the above transition states now had a length somewhere in between that of a single and double bond. Also the new sigma bonds that are forming can be considered, in all the methods this length is quite a bit longer than a single bond but less than the sum of two van der waals radius for carbon indicting that a bond forming process has started.
Molecular orbitals of the transition state
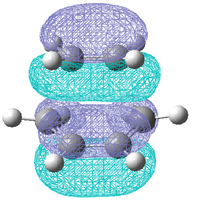
| semi emperical AM1 LUMO | semi empirical AM1 HOMO | semi empirical AM1 HOMO-1 | |
|---|---|---|---|
| Molecular Orbital |  |
 |
|
| Symmetry | symmetric | antisymmetric | symmetric |
| DFT/B3LYP/631-G* LUMO | DFT/B3LYP/631-G* HOMO | DFT/B3LYP/631-G* HOMO-1 | |
|---|---|---|---|
| Molecular Orbital | 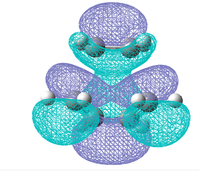 |
 |
|
| Symmetry | symmetric | symmetric | antisymmetric |
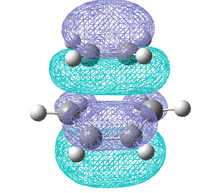
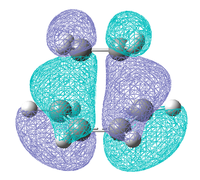
Looking at the results from the AM1 calculation it can be seen that the LUMO is symmetric is made up of the HOMO of ethylene and the LUMO of butadiene and the HOMO is made up of the HOMO of butadiene and the LUMO of ethylene. This result is expected as only molecular orbitals of the same symmetry can overlap. Pericylic reactions follow a set of rules determined by orbital symmetry. This reaction has 6 π electrons therefore under thermal conditions is only allowed if it proceeds via a Huckel transition state, this means the the new bonds must form suprafacially, i.e on the same face of the ethene and the same face of the butadiene. By examining the HOMO this can be seen to be true here, there are no twists in either of the molecules and there is a lot of electron density where the new bonds will form on the same side of each molecule. These pericyclic rules arise from orbital symmetry, for a reaction to proceed the HOMO of one of the reactants must have the same symmetry as the LUMO of the other reactant to allow the two to overlap and new bonds to be formed.
The HOMO-1 orbitals are shown as when the calculation was run at the higher level of theory the position of the HOMO and the HOMO-1 reversed, now the HOMO is symmetric and and it is the HOMO-1 which is result of the HOMO of butadiene and the LUMO of ethylene. This shows that the ordering of molecular orbitals that are close in energy is sensitive to the basis set and level of theory used. The reason for this ordering may also have something to do with the different bond forming distances found for each of the methods.
Cycloaddition of Cyclohexa-1,3-diene and Maleic Anhydride
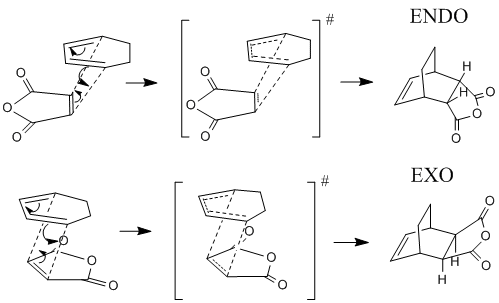
Now the Diels Alder reaction between Cyclohexa-1,3-diene and Maleic Anhydride will be investigated. Maleic anhydride is the dieneophile and the π bonds of the substituents on the dieneohpile can interact with the new π bond being formed, this interaction can control the regiochemistry of the reaction. By studying the two possible transition states it will be possible to determine the most stable transition state and hopefully the reasons for this extra stability. The reaction mechanism indictaing the two transition states is shown below.
Optimization of reactants
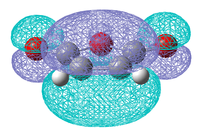
As in previous exercises the reactant molecules must first be optimized, these are quite simple molecules so it was done at the semi-empirical AM1 level of theory. The HOMO and LUMO of each molecule was also plotted.
| DOI:10042/to-7191 | DOI:10042/to-7192 | ||
|---|---|---|---|
| HOMO | LUMO | HOMO | LUMO |
 |
 |
 |

|
| Symmetric | Antisymmetric | Antisymmetric | Symmetric |
As was found for the prototypical Diels Alder reaction the HOMO for both molecules are the π bonds and the LUMOs are the π* antibonding orbitals. Also considering the symmetry of the each orbital it is expected that it is the HOMO of maleic anhydride that will interact with the LUMO of cyclohexadiene and vice versa to create the HOMO and LUMO of the transition state.
Optimizing the transition state
An initial guess was made of the transition states by pasting the optimized reactant molecules into the same window and positioning them over each other like shown in the diagram showing the reaction mechanism. The terminal bond distances were about 2.1 angstroms. In previous exercises freezing the bond forming distances, optimizing to a minimum and then unfreezing and optimizing to a transition state (TS berny) produced identical results as just optimizing to a transition state straight away. Therefore the frozen coordinate method will not be employed here as it is more time consuming and doesn't produce any more accurate results for these small systems. The initial guess of both the endo and exo transition states were optimized to a transition state using the semi-empirical AM1 method to obtain a rough geometry of the transition state. These optimized transitions were then subjected to the same calculation but with the higher level of theory DFT/B3LYP/6-31G* to obtain more accurate results. The results of these optimizations are shown below.
| - | Exo | Endo | ||||||||||||||
|---|---|---|---|---|---|---|---|---|---|---|---|---|---|---|---|---|
| Semi-empirical/AM1 DOI:10042/to-7148 | DFT/B3LYP/6-31G* DOI:10042/to-7149 | Semi-empirical/AM1 DOI:10042/to-7150 | DFT/B3LYP/6-31G* DOI:10042/to-7151 | |||||||||||||
| Structure |
|
|
|
| ||||||||||||
| Energy /Hartrees | -0.05042 | -612.97931 | -0.05150 | -612.68340 | ||||||||||||
| C-C bond forming distance /angstroms | 2.17 | 2.29 | 2.16 | 2.27 | ||||||||||||
| Imaginary frequency /cm-1 | -812 | -448 | -806 | -447 | ||||||||||||
| Imaginary frequency animation |
|
| ||||||||||||||
The endo and exo transition states were located and confirmed by the presence of an imaginary frequency, animating the imaginary frequency showed the expected transition state for each and the synchronous formation of both bonds can be seen. It is clear from these results that different C-C bond forming distances are calculated, DFT methods show significantly longer bond distances, this is just a result of using different levels of theory and the higher level of theory can be considered to be more accurate. The C-C bond forming distance is longer in the exo transition state than it is in the endo giving the first indication that the endo transition state is more stable as the terminal carbon atoms are closer and the forming bond will be more formed. As was seen in the prototypical Diels alder reaction the C-C bonds that are either are in the process of becoming a single bond from a double bond or the other way round have a bond length in between that of a typical single or double bond. Also the imaginary frequency is lower for the endo transition state with both levels of theory indicating a flatter potential energy surface around the transition state maximum, this indicates that the endo transition state would be lower in energy and easier to reach from the reactants. Finally it can be seen that the endo transition state is lower in energy than the exo transition state, the possible reasons for this will be discussed in the next section, however one can be seen here, on the AM1 optimized structures the distance between the oxygen atom in the ring and the hydrogen atom opposite it are shown. This distance is almost 1 angstrom longer in the endo transition state due to the sp2 carbon atoms as opposed to the sp3 in the exo transition state, hence there must be more steric repulsion in the exo transition state giving it a higher energy. A similar argument could be made for the hydrogen atoms on the other side of the molecule but hydrogen atoms are much smaller then oxygen therefore if there is any different in distance it is unlikely to cause much steric repulsion. Therefore the first reason for the higher energy exo transition state is due to the strain present. Shown in the table below are the activation energies that were computed from the optimized transition states, the reactants had previously only been optimized with semi-empirical method so they were reoptimized at the DFT level used in the transition state calculations.
| - | Exo | Endo |
|---|---|---|
| Sum of the reactant energies at 0K /Hartrees | -612.517064 | |
| Transition state energy at 0K cell / Hartrees | -612.498014 | -612.502142 |
| Activation Energy /Hartrees | 0.028831 | 0.024698 |
| Activation Energy / kcal/mol | 18.1 | 15.5 |
The activation energy at 0K is found to be almost 3 kcal/mol less to the endo transition state.
Molecular Orbitals of the transition states
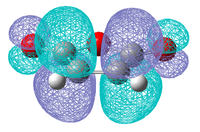
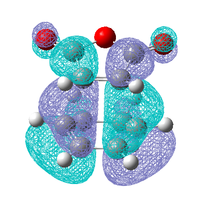
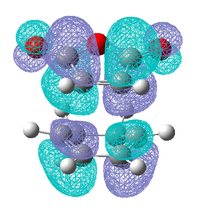
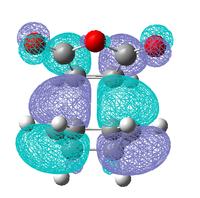
There are a number of reasons why the endo transition state is lower in energy than the exo and the first thing that will be considered is the HOMO's and LUMO's of both transition states.
| Exo | Endo | ||
|---|---|---|---|
| HOMO | LUMO | HOMO | LUMO |
 |
 |
 |
|
| Antisymmetric | Antisymmetric | Antisymmetric | Antisymmetric |
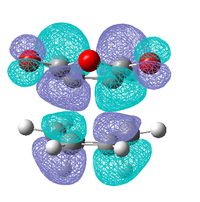
As in the prototypical Diels Alder the HOMO's of both transition states are made up of the HOMO of the diene and the LUMO of the dieneophile, this is expected as both MO's are antisymmetric so can overlap well. However the LUMO does not appear to made up from the symmetric LUMO of the diene and the HOMO of the dieneophile as was seen before, this indicates that are some other orbital interactions occurring that need to be considered.
Secondary orbital overlap
There are many examples in literature where the main reason given for the formation of the endo product over the exo product is the presence of secondary orbital interactions[7]. So much interest has been shown in this type of reaction as the formation as the endo product as the only product is unusual because it is unusual for only isomer of a reaction to be be produced and the fact there is indicates that there is something controlling it, also because it is known that the exo isomer product is more stable than the the endo product. This is because there is less steric hinderence when the maleic anhydride group sits on the same side of the ring as the bridging group. Therefore when the reaction is under thermodynamic control the exo product is formed but as seen from the above calculations the endo transition state is more stable so when under kinetic control the endo product is favoured.
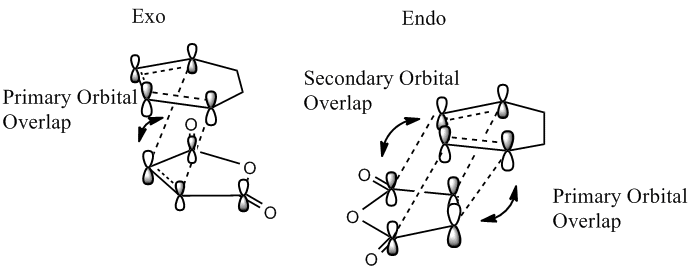
This secondary orbital interaction that stabilises the endo transition state can be seen in the below diagram. It involves an interaction between the carbonyl groups of the dieneophile and the developing π bond at the back of the diene, and only in the endo transition state do the two reactants approach each other with the correct orientation for this to occur. To clarify these secondary overlap interactions do not lead to bonds but are stabilising interactions. The frontier molecular orbitals have been used to derive the below diagram, and from this it is expected that this overlap might be observed in the HOMO of the endo transition state, however this is not the case, as previously seen the HOMO of the endo and exo transition states both have a nodal plane where this interaction is expected to occur.
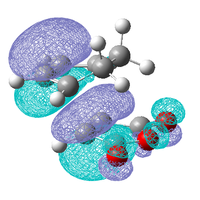
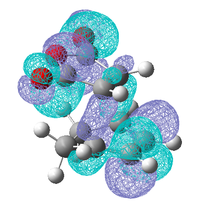
As these interactions were not observed in the HOMO and LUMO the molecular orbitals close in energy to the HOMO and the LUMO were examined, the HOMO-1, LUMO+1 and the LUMO+2 are shown below.
| Exo | ||
|---|---|---|
| HOMO-1 | LUMO +1 | LUMO +2 |
 |
 |
|
| Endo | ||
| HOMO-1 | LUMO +1 | LUMO +2 |
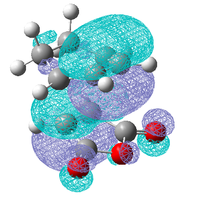 |
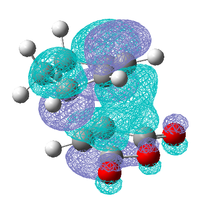 |
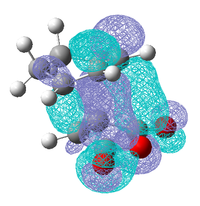
|
These three molecular orbitals demonstrate excellently why the endo transition state is more stable. In the HOMO-1 the π orbital of the developing π bond can be seen clearly and this orbital has the same phase (on the side of the maleic anhydride) as the parts of the orbital located around the oxygen atoms, this is like the interaction illustrated above. The LUMO orbitals were looked at for demonstrative purposes only, these orbitals wont have any effect on the energy of the transition state as they are empty but they show nicely how overlap possible in the endo transition state. Especially in the LUMO+2 of the endo transition state where the orbital spreads between the forming π bond and the oxygen atoms as is the case in the LUMO+1. From examining these orbitals of the exo transition state none of these interaction are present as the reactants are not aligned so it is possible.
It can be concluded that although frontier molecular orbital theory is useful in rationalising why the Endo transition is more stable, the calculated molecular orbitals show that no such interaction is present in the HOMO of the transition state as predicted, it does however appear in molecular orbitals close in energy. This could be due to level of theory use as it had been previously seen using a different level of theory changes the ordering of the orbitals.
Conclusion
In this module computational techniques have been successfully used to model reaction pathways and locate transition states. Such calculations reveal important information such as which of two possible transition states is lower in energy and what product they correspond to. Thermochemistry data was also obtained to calculate values such as the activation energy. By looking at the transition state which is primarily what has been carried out here some important information about a reaction can be missed, a lower activation energy doesn't necessary correspond to a lower energy product, therefore finding the lowest energy transition state only find the kinetic reaction pathway and provides no information on the thermodynamic pathway. The calculations were successful and gave accurate results similar to that of literature. However there is one major downfall to these calculations is that the initial guess of the transition states used for the input of the calculations must be quite close to the actual transition state otherwise the calculation will fail, therefore these methods are not of any use for reactions where the geometry of the transition state is completely unknown, however these methods are very successful at refining the structures of already known geometry's.
References
- ↑ A.C. Cope, E.M. Hardy, J. Am. Chem. Soc., 1940, 62, 441: DOI:10.1021/ja01859a055
- ↑ Benjamin W. Gung, Zhaohai Zhu, Rebecca A. Fouch,J. Am. Chem. Soc, 1995, 6, 1783. DOI:10.1021/ja00111a016
- ↑ György Schultz and István Hargittai, Journal of Molecular Structure, 1995, 346, 63-69: DOI:10.1016/0022-2860(94)09007-C
- ↑ M. V. Basilevskii, A.G. Shamov, V. A. Tikhomirov, "J. Am. Chem. Soc", 1977, "99 (5)", 1369. DOI:10.1021/ja00447a014
- ↑ M.J. Dewar and H.N. Schmeising, "Tetrahedron", 1960, "11", DOI:10.1016/0040-4020(60)89012-6
- ↑ A. Bondi, "J. Phys. Chem", 1964, "68", 441 DOI:10.1021/j100785a001
- ↑ Ian. Fleming, Frontier Orbitals and Organic chemical reaction, John Wiley and Sons Ltd., 1976, p.106-109


