Rep:Mod:nm1916
NH3
What is the molecule?
NH3
What is the calculation method?
RB3LYP
What is the basis set?
6-31G(d,p)
What is the final energy E(RB3LYP) in atomic units (au)?
-56.55776873 Hartree
What is the RMS gradient?
0.00000485 Hartree
What is the point group of your molecule?
C3V
N-H Bond length
1.01798 Å
H-N-H Bond Angle
105.741°
NH3 Item Table
        Item               Value     Threshold  Converged?
 Maximum Force            0.000004     0.000450     YES
 RMS     Force            0.000004     0.000300     YES
 Maximum Displacement     0.000072     0.001800     YES
 RMS     Displacement     0.000035     0.001200     YES
NH3 Molecule |
The optimisation file is linked to here
IR Info & Display Table
How many modes do you expect from the 3N-6 rule?
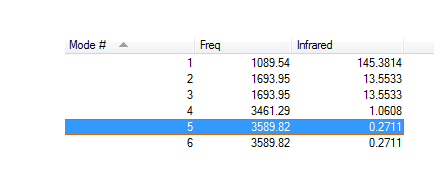
6
Which modes are degenerate (ie have the same energy)?
Modes 2+3 and 5+6 are degenerate
Which modes are "bending" vibrations and which are "bond stretch" vibrations?
Modes 1,2,3 are bends and 4,5,6 are stretches.
Which mode is highly symmetric?
Mode 4
One mode is known as the "umbrella" mode, which one is this?
Mode 1
How many bands would you expect to see in an experimental spectrum of gaseous ammonia?
2 Bands, The one at 1089.54 wavenumbers amd the two degenerate modes at 1693.95 will superimpose to give double the intensity. The other modes have too small of an intensity to be visible.
Extra IR Info
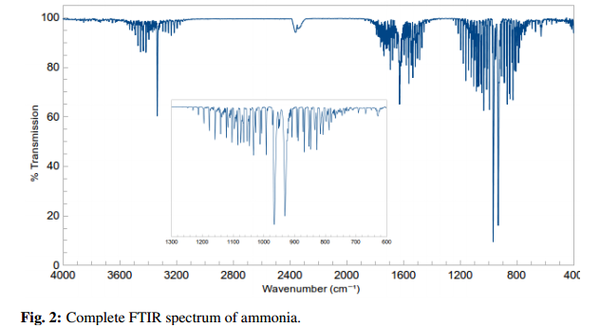
The IR spectra from the experimental data is shifted slightly to lower wavenumbers from literature values observable in the diagram above 1. This could be due to the scaling factor Guassian uses. For IR data Gaussian assumes a harmonic potential which would differ from vibrational levels in a ammonia molecule in real life. One way to possibly improve this would be to get Gaussian to take the scaling factor into account or get it to model a morse potential instead of a harmonic oscillator.
Also there is an extra peak in the IR spectrum than I predicted, this is due to the intensity being higher than I thought would be visible in an IR spectrum at around 3500 wavenumbers.
Charge Distribution on the NH3 Molecule
The nitrogen atom has a charge of -1.125eV and the H atoms have a charge of 0.375eV.
This is what we would expect as the nitrogen is more electronegative than the hyrodgen therefore would have a more negative charge distribution as it has a greater affinity for the electrons.
Also Ammonia is a neutral molecule and the overall positive and negative charge cancel out therefore leaving a neutral molecule.
N2
What is the molecule?
N2
What is the calculation method?
RB3LYP
What is the basis set?
6-31G(d,p)
What is the final energy E(RB3LYP) in atomic units (au)?
-109.52412868 au
What is the RMS gradient?
0.00000060 Hartree
What is the point group of your molecule?
D∞h
N-N Bond length
1.10550 Å
N-N Bond Angle
180°- Linear
N2 Item Table
         Item               Value     Threshold  Converged?
 Maximum Force            0.000001     0.000450     YES
 RMS     Force            0.000001     0.000300     YES
 Maximum Displacement     0.000000     0.001800     YES
 RMS     Displacement     0.000000     0.001200     YES
N2 Molecule |
The optimisation file is linked to here
IR Info
From the 3N-5 we would predict one peak in the IR spectra. However as it is a homodinuclear molecule there will be no change in dipole moment therefore no peak will be observed in the IR spectrum. This fits with the value from Gaussian as it suggests there should be a N-N triple bond stretch at 2457.33 wavenumbers however the intensity of this peak is 0 like expected.
Charge Information
Since both of the atoms in the N2 triple bond are the same they will have the same eleectronegativty therefore have the same affinity for electrons therefore both have a charge of 0. This also fits with the idea that the N2 molecule is a neutral molecule.
H2
What is the molecule?
H2
What is the calculation method?
RB3LYP
What is the basis set?
6-31G(d,p)
What is the final energy E(RB3LYP) in atomic units (au)?
-1.17853936
What is the RMS gradient?
0.00000017
What is the point group of your molecule?
D∞h
H-H Bond length
0.74279Å
H-H Bond Angle
180°- Linear
H2 Item Table
         Item               Value     Threshold  Converged?
 Maximum Force            0.000000     0.000450     YES
 RMS     Force            0.000000     0.000300     YES
 Maximum Displacement     0.000000     0.001800     YES
 RMS     Displacement     0.000001     0.001200     YES
H2 Molecule |
The optimisation file is linked to here
IR Info
As a homodinuclear molecule we expect 1 peak visible in the IR spectrum from the 3n-5 rule. However there will be no change in dipole moment for the H-H stretch therefore will not appear in the IR spectra. This fits with Gaussians prediction that there should be a peak at 4465.68 however the intensity of the peak is 0.
Charge Info
The charge on both hydrogen atoms is 0. This is because they are the same atom therefore have the same electronegativty which means they both have the same affinity for electrons. The overall charge of the molecule is 0 which means the molecule has no overall charge.
Haber Bosch Process
E(NH3)=-56.55776873 Hartree
2*E(NH3)=-113.1155375 Hartree
E(N2)=-109.52412868 Hartree
E(H2)=-1.17853936 Hartree
3*E(H2)=-3.53561808 Hartree
ΔE=2*E(NH3)-[E(N2)+3*E(H2)]= -0.05579074 Hartree = -147.48kj/mol
Expect Ammonia to be more stable than the gaseous reactants as the energy change is negative therefore will be more stable.
F2
What is the molecule?
F2
What is the calculation method?
RB3LYP
What is the basis set?
6-31G(d,p)
What is the final energy E(RB3LYP) in atomic units (au)?
-199.49825218 Hartree
What is the RMS gradient?
0.00007365 Hartree
What is the point group of your molecule?
D∞h
F2 Bond length
1.40281 Å
F2 Bond Angle
180°- Linear
Item table
   Item                    Value       Threshold    Converged?
 Maximum Force            0.000128     0.000450     YES
 RMS     Force            0.000128     0.000300     YES
 Maximum Displacement     0.000156     0.001800     YES
 RMS     Displacement     0.000221     0.001200     YES
F2 |
The optimisation file is linked to here
IR Info
Flourine is a homodinuclear molecule therefore it would be expected to observe 1 peak from the 3N-5 rule. However there will be no visible peaks observed in its IR spectrum due to their being no change in dipole moment when the molecule vibrates. Gaussian predicts a stretch at 1065.09 wavenumbers however the intenisty of the stretch is 0.
Charge Information
As Flourine is a homodinuclear molecule both of the flourine atoms have the same electronegativity therefore have the same affinity for electrons in the bond which results in the relative charge on both atoms being 0. This also fits with our idea that flourine is not a charged molecule as the overall charge of the molecule is 0.
Flourine Orbitals
Non-Bonding Orbitals
Both of these orbitals are non bonding orbitals with the diagram on the LHS orbitals in phase and the diagram on the RHS orbitals out of phase. They are both the lowest in energy orbitals as they are not involved in bonding. Both orbitals are almost degenerate only differing by 0.0007au.
S Orbital Overlap In Phase
This is a molecular orbital formed between the overlap of the 2S orbital from both of flourine atoms in phase creating the σ bond. It is relatively low in energy as would be expected for from the overlap of 2 2s orbitals. As they are from the same atom the σ bond is not polarised.
S Orbital Overlap Out of Phase
Above is the σ* orbital formed when 2 2s orbitals of different phase overlap. It is higher in energy than the σ molecular orbital however still lower in energy than any of the p orbital overlap. There is a region of no electron density in between the two flourine atoms
P Orbital Overlap
Above are 2 degenerate π orbitals formed from the overlap of 2 2p orbitals in phase. These orbitals are much higher in energy than the σ orbitals formed from the overlap of 2s orbitals. They are degenerate as they are the same kind of atomic orbital combining with the same phase only in different spatial orientations.
Bibliography
1 Infrared Spectroscopy and Interferometry as Methods for Structural Determination of Ammonia, https://www.ocf.berkeley.edu/~jmlvll/lab-reports/FTIR-NH3/FTIR-NH3.pdf, accessed March 2017


