Rep:Mod:nht10
This computational laboratory involes the use of the program Gaussian, by using different basis sets and methods, one can look at the structures, bondings and molecular orbitals of different molecules in depth. In this experiment the molecules BH3, TlBr3 and BBr3 were analysed, and then a mini-project was conducted on ionic liquids, mainly considering [N(CH3)4]+, [P(CH3)4]+ and [S(CH3)3]+.
Week 1
Analysis of the BH3 molecule
BH3 Optimisation using the 3-21G basis set
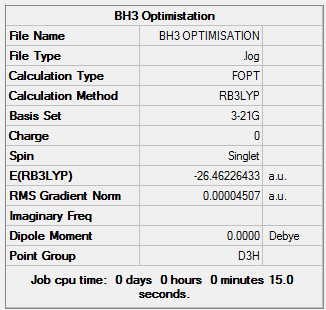
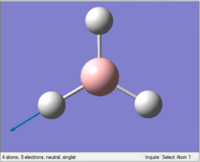
The BH3 molecule belongs to the D3h point group, it was first optimised using the B3LYP method, on the 3-21G basis set. This optimisation gives the following results
BH |
Summary:
         Item               Value     Threshold  Converged?
 Maximum Force            0.000090     0.000450     YES
 RMS     Force            0.000059     0.000300     YES
 Maximum Displacement     0.000352     0.001800     YES
 RMS     Displacement     0.000230     0.001200     YES
 Predicted change in Energy=-4.580970D-08
 Optimization completed.
    -- Stationary point found.
BH3 Optimisation using the 6-31G basis set
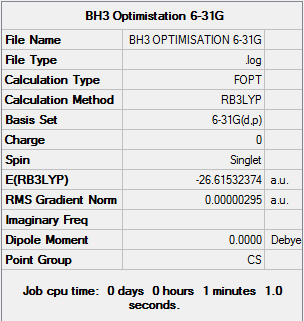
The output file from the 3-21G basis set was further optimised using the 6-31G basis set on the same method, giving the following results
File:BH3 OPTIMISATION 6-31G.LOG
BH |
         Item               Value     Threshold  Converged?
 Maximum Force            0.000006     0.000450     YES
 RMS     Force            0.000004     0.000300     YES
 Maximum Displacement     0.000024     0.001800     YES
 RMS     Displacement     0.000015     0.001200     YES
 Predicted change in Energy=-1.980661D-10
 Optimization completed.
    -- Stationary point found.
Frequency analysis of BH3
By doing a further frequency calculation on the molecule, one can find the low frequencies of the molecule
 Low frequencies ---  -19.0010    0.0007    0.0009    0.0009   12.0258   12.0968
 Low frequencies --- 1162.9746 1213.1729 1213.2338
The table below summarizes the vibrations of BH3
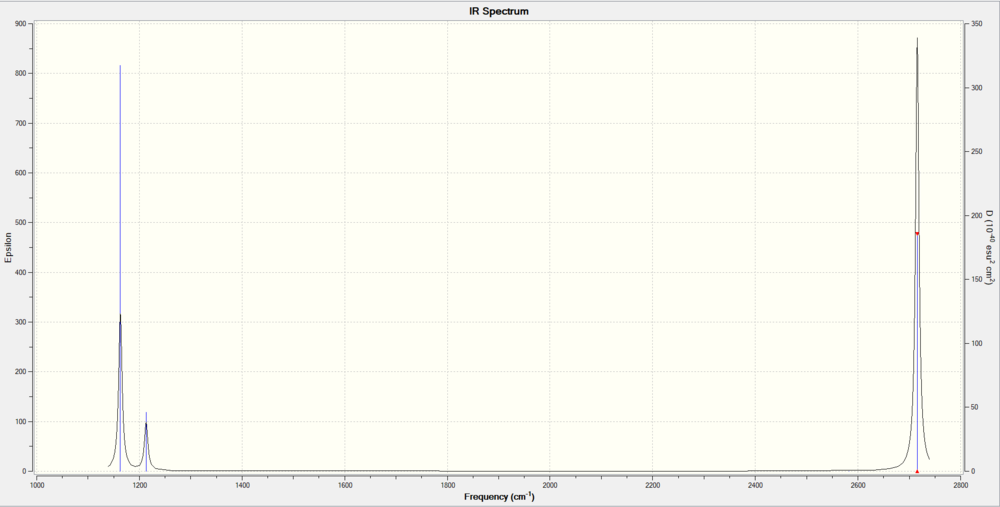
These vibrations give rise to the peaks on the IR spectrum
The IR spectrum of BH3 shows 3 peaks with frequencies 1163cm-1, 1213cm-1, 2715-1 Although having 6 vibrational modes, the IR spectrum only shows 3 peaks, this is due to vibrational modes number 2 and 3 having the same frequencies, causing them to overlap on the IR spectrum. The same reason applies to vibrational modes number 5 and 6. Vibrational mode number 4 has a motion of symmetrical stretching, which is IR inactive due to no net change in dipole moment of the vibration. Overall these vibrational modes give 3 visible peaks on the IR spectrum
For the full frequency analysis please see File:NICHOLASTSANG BH3 FREQ.LOG
MO Analysis of BH3
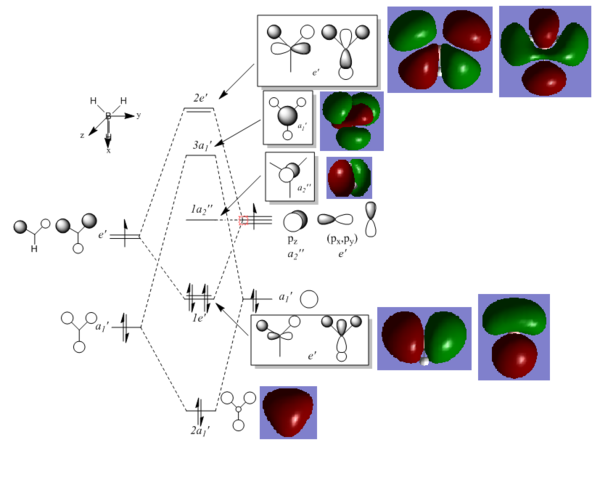
The checkpoint file from the 6-31G BH3 optimisation was used to compute the molecular orbitals. An MO diagram of BH3 was then constructed to give the LCAOs. The LCAOs were taken and compared with the MOs computed by Gaussview.
It can be seen that the LCAOs and MOs are very similar, only by a small difference that MOs are more "merged" together and LCAOs aren't. This indicated that qualitative MO theory is very useful since it doesn't require computational work and still gives accurate results.
Full NBO population analysis:
D-space link: [1]
Analysis of TlBr3
TlBr3 Optimisation
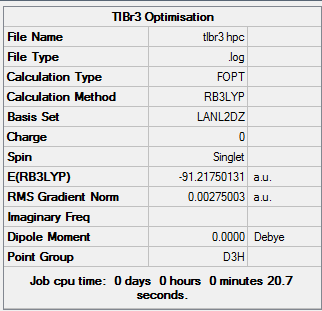
The TlBr3 optimisation calculation was run on the HPC using the 6-31G(d,p) basis set, the output file was then downloaded and analysed. TlBr3 belongs to the D3h point group.
BH |
         Item               Value     Threshold  Converged?
 Maximum Force            0.000002     0.000450     YES
 RMS     Force            0.000001     0.000300     YES
 Maximum Displacement     0.000022     0.001800     YES
 RMS     Displacement     0.000014     0.001200     YES
 Predicted change in Energy=-6.084115D-11
 Optimization completed.
    -- Stationary point found.
By looking into the output file on Gaussview, the bond distance of Tl-Br in TlBr3 was found to be 2.65095 and the bond angle was found to be 120 degrees
D-space link:[2]
Frequency Analysis of TlBr3
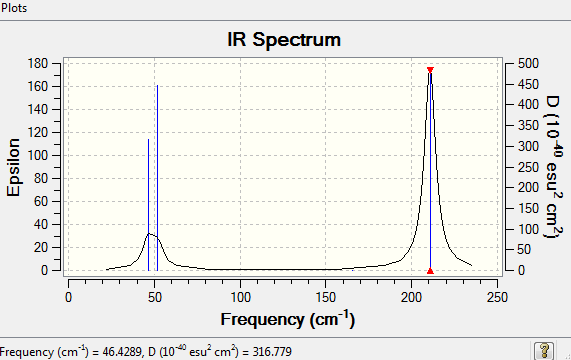
The frequency calculation of TlBr3 gives the low frequencies:
 Low frequencies ---   -3.4213   -0.0026   -0.0004    0.0015    3.9367    3.9367
 Low frequencies ---   46.4289   46.4292   52.1449
D-space link:[3]
These vibrational modes give rise to the IR spectrum below. Similar to the BH3 spectrum, though having 6 vibrational modes, only 2 peaks showed up in the IR spectrum. This is due to vibrational modes 1,2 and 3 overlapped with each other, and modes 5,6 also overlapped with each other because the frequencies are so similar. Vibrational mode 4 is IR inactive since there is no overall net dipole. Hence these vibrational modes only gave 2 peaks on the spectrum.
For the full frequency analysis please see File:NICHOLASTSANG TLBR3 FREQUENCY.LOG
BBr3 Analysis
BBr3 Optimisation
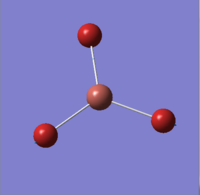
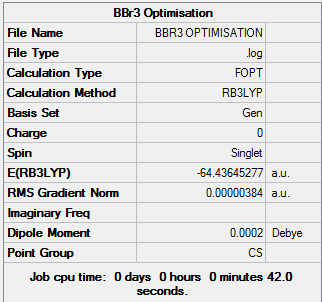
BBr3 belongs to the D3h point group and was computed using a 6-31G(d,p) basis set, by looking into the Gaussian output file the B-Br bond length in BBr3 was found to be 1.93397Å and the bond angle was 120 degrees
BBr |
         Item               Value     Threshold  Converged?
 Maximum Force            0.000008     0.000450     YES
 RMS     Force            0.000005     0.000300     YES
 Maximum Displacement     0.000036     0.001800     YES
 RMS     Displacement     0.000024     0.001200     YES
 Predicted change in Energy=-4.098023D-10
 Optimization completed.
    -- Stationary point found.
Comparison
Comparison of bond lengths between BH3, BBr3, and TlBr3
The optimised models of the molecules BH3, BBr3, and TlBr3 were studied in Gaussview and the bond lengths were tabulated.
| Molecule | Bond Length (Å) |
|---|---|
| BH3 | 1.19232 |
| BBr3 | 1.93397 |
| TlBr3 | 2.65095 |
From the table, BBr3 has a longer bond length than BH3, and TlBr3 has a longer bond length than BBr3.
To explain the difference in bond length of the molecules, firstly one needs to study the factors that affect the bond length. The factors are 1. The size of the atom 2. Multiplicity of the bonds 3.Type of hybridisation[1] Since the hydrogen atom and bromine atom are also single bonded to the central atom, the only factor that affects the bond length is the size of the atom, hence the difference in bond length between BH3 and BBr3 is due to the bromine atom being a much larger atom than hydrogen, therefore having a larger orbital size mismatch with the boron central atom, which is relatively small in size. This orbital size mismatch causes the B-H bond length (1.19232Å) to be much smaller than the B-Br bond length (1.93397Å).
Thallium and Bromine are in the same group (group 13), both of the atoms have 3 valence electrons. TlBr3 has a longer bond length than BBr3, this is due to Thallium is a much larger atom than Boron is, hence having a larger ionic radii, which leads to a longer bond length in TlBr3 (2.65095Å) than in BBr3 (1.93397Å). Therefore changing the ligand or the central atom to a larger atom will lead to an increase in bond length.
Comparison of vibrational frequencies between BH3 and TlBr3
| Vibrational Mode | BH3 (cm-1) | TlBr3(cm-1) |
|---|---|---|
| 1 | 1162.97 | 46.43 |
| 2 | 1213.17 | 46.43 |
| 3 | 1213.23 | 52.14 |
| 4 | 2582.28 | 165.27 |
| 5 | 2715.43 | 210.69 |
| 6 | 2715.46 | 210.69 |
From the tabulated values, it can be observed that the BH3 molecule is having significantly higher vibrational frequencies than the TlBr3 molecule. By applying Hooke's Law to IR spectroscopy, the factors that affect IR absorption frequencies can be summarized as[2]:
1. stronger bonds absorb at higher frequencies.
2. weaker bonds absorb at lower frequencies.
3. bonds between lighter atoms absorb at higher frequencies.
4. bonds between heavier atoms absorb at lower frequencies.
Hence it can be deduced that TlBr3 will absorb at much lower frequencies than BH3 since Thallium is much heavier than Boron, and Bromine atoms are much heavier than Hydrogen atoms.
The IR spectrum these molecules give are very similar, both of the spectra have 2 intense peaks far apart. This is because both of the molecules belong to the same point group D3h, hence having the same vibrational modes that overlap with each other, and giving a spectrum with similar pattern.
The A1 and E' modes happen to have higher energy than the A2 and E' modes, this is due to A1 and E' vibrations are sterically unfavourable, giving an increase in vibrational energy, and hence by the equation E=hf, this leads to higher frequencies.
There happens to be a re-ordering of vibrational modes between BH3 and TlBr3, this is believed to be caused by TlBr3 being a much larger molecule, certain vibrational modes are less favourable and some became more favourable due to steric reasons, hence the re-ordering of the modes.
NH3 Analysis
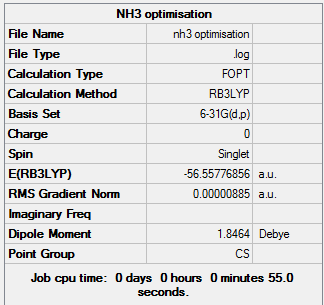
NH3 belongs to the D3h point group, it was computed using the 6-31G(d,p) basis set.
NH |
Summary of optimisation:
    Item               Value     Threshold  Converged?
 Maximum Force            0.000024     0.000450     YES
 RMS     Force            0.000012     0.000300     YES
 Maximum Displacement     0.000091     0.001800     YES
 RMS     Displacement     0.000053     0.001200     YES
 Predicted change in Energy=-1.629951D-09
 Optimization completed.
    -- Stationary point found.
Frequency Analysis:
Low frequencies ---  -26.9385   -0.0014   -0.0009    0.0006   13.5447   28.1657
 Low frequencies --- 1089.5521 1694.1012 1694.2078
For the full frequency analysis please see: File:NICHOLASTSANG NH3 FREQ.LOG
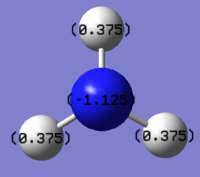
The charge distribution on NH3 was investigated and shown in the picture below, with red being negatively charged and green being positively charged
The specific charge on each atom on NH3
From the above data it is clear that the nitrogen atom is more electronegative, therefore having an overall negative charge on nitrogen and overall positive charge on the hydrogen atoms.
Full Population Analysis: File:NH3 MO.LOG
NH3BH3 Analysis
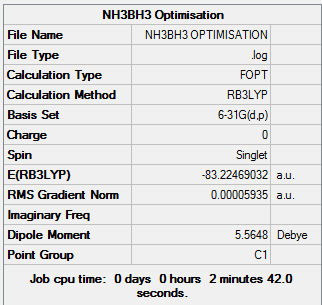
NH3BH3 belongs to the point group C3v, it was computed using the 6-31G(d,p) basis set.
For the full optimisation file:
NHBH |
Optimisation Summary:
 Item               Value     Threshold  Converged?
 Maximum Force            0.000121     0.000450     YES
 RMS     Force            0.000057     0.000300     YES
 Maximum Displacement     0.000508     0.001800     YES
 RMS     Displacement     0.000294     0.001200     YES
 Predicted change in Energy=-1.611643D-07
 Optimization completed.
    -- Stationary point found.
Low frequencies ---   -0.0011   -0.0009   -0.0008   18.5248   23.7751   41.0186
 Low frequencies ---  266.2845  632.2308  639.8256
For the full frequency analysis please see:
Association Energy of NH3BH3
Using the energies calculations from previous sections one can calculate N-B bond energy in NH3BH3 E(NH3BH3) = -83.22469032 a.u.
E(NH3) = -56.55776856 a.u.
E(BH3) = -26.61532374 a.u.
Bond Association Energy(H3N-BH3):
ΔE = E(NH3BH3)-[E(NH3)+E(BH3)]
  = -83.22469032 + 83.1730923
  = -0.05159802 a.u.
  = -135 kJ/mol
Week 2 Mini-Project - Ionic Liquids: Designer Solvents
This project investigates ionic liquids, which is also termed as designer solvents. All the calculation in this section was computed using the 6-31G(d,p) basis set
[N(CH3)4]+ Analysis
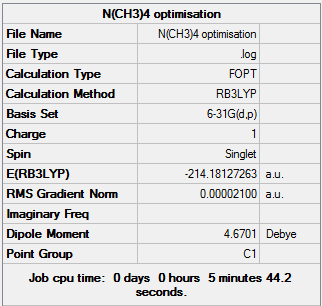
[N(CH3)4]+ obtains a tetrahedral structure with respect to the central nitrogen atom, it belongs to the Td point group
D-space link:[4]
[N(CH)] |
Summary of optimisation:
Item               Value     Threshold  Converged?
 Maximum Force            0.000074     0.000450     YES
 RMS     Force            0.000017     0.000300     YES
 Maximum Displacement     0.001400     0.001800     YES
 RMS     Displacement     0.000371     0.001200     YES
 Predicted change in Energy=-5.619443D-08
 Optimization completed.
    -- Stationary point found.
Low frequencies ---  -13.0368   -0.0009   -0.0005   -0.0003    6.1595   11.9610
 Low frequencies ---  179.8900  278.8645  285.7057
For the full frequency analysis please see:
D-space link:[5]
MO Analysis of [N(CH3)4]+
D-space link:[6]
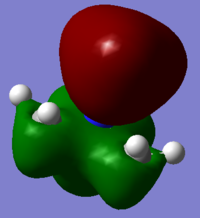
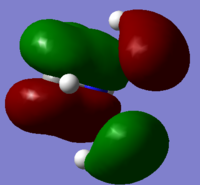
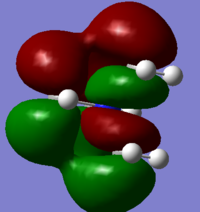
5 molecular orbitals ranging from highly bonding and highly antibonding were chosen to visualize
Highly Bonding (7): The H AOs and carbon AOs have good overlap, top and bottom part of the molecule also have good in-phase overlap with a nitrogen p-orbital, which gives good overall bonding. There is one node plane that can be observed.
Bonding (12): p-orbital from nitrogen overlaps with another 2 p-orbitals from 2 of the carbons, hydrogen AOs on the 2 carbons also have good overlap with the N AO and C AOs. The other 2 methyl groups have good in-phase overlap on their own but slightly out of phase overlap with the nitrogen AO. 2 nodal planes can be observed on this MO.
Slightly Bonding (20):Nitrogen AO has good overlap with 2 of the carbon AOs (p-orbitals), but antibonding interaction with the remaining 2 carbon AOs. 2 nodal points and 1 nodal plane can be observed from the MO.
Slightly Antibonding (22):The H AOs interact out of phase with the carbon AOs, and the carbon AOs seemed to have anti-bonding interaction with the central nitrogen atom, and bonding interaction with each other. This gives an overall diffuse and anti-bonding molecular orbital. 4 nodal points can be observed.
Highly Antibonding (34):H AOs from different carbon atoms have slightly bonding interaction, nitrogen and carbon atoms have strong antibonding interaction, out of phase interaction is also significant between the carbon AOs and H AOs. 4 nodal points and 1 nodal plane can be observed from this overall antibonding MO.
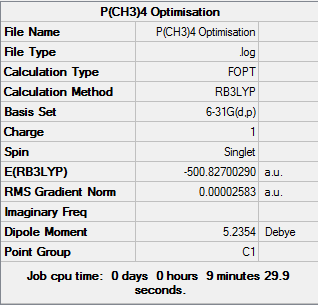
[P(CH3)4]+ Analysis
[P(CH3)4]+ obtains a tetrahedral structure with respect to the central phosphorus atom, it belongs to the Td point group.
D-space link:[7]
[P(CH)] |
Summary of optimisation:
Item               Value     Threshold  Converged?
 Maximum Force            0.000148     0.000450     YES
 RMS     Force            0.000033     0.000300     YES
 Maximum Displacement     0.000959     0.001800     YES
 RMS     Displacement     0.000312     0.001200     YES
 Predicted change in Energy=-1.849677D-07
 Optimization completed.
    -- Stationary point found.
Low frequencies ---  -16.6325   -0.0026   -0.0013    0.0011    4.1777   16.1823
 Low frequencies ---  153.2983  183.0747  190.9495
For the full frequency analysis please see:
D-space link:[8]
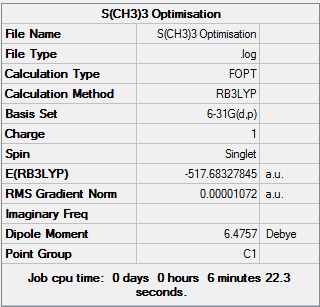
[S(CH3)3]+ Analysis
[S(CH3)3]+ obtains a trigonal pyramidal structure with respect to the central sulphur atom, it belongs to the C3v
D-space link:[9]
[S(CH)] |
Summary of optimisation:
Item               Value     Threshold  Converged?
 Maximum Force            0.000039     0.000450     YES
 RMS     Force            0.000009     0.000300     YES
 Maximum Displacement     0.000580     0.001800     YES
 RMS     Displacement     0.000168     0.001200     YES
 Predicted change in Energy=-1.526646D-08
 Optimization completed.
    -- Stationary point found.
Low frequencies ---  -13.3650  -11.3564    0.0024    0.0027    0.0040   22.9103
 Low frequencies ---  158.5489  194.0799  198.4863
For the full frequency analysis please see:
D-spcae link:[10]
Comparison
For the full population analysis of the 3 molecules:
[N(CH3)4]+
D-space link:[11]
[P(CH3)4]+
D-space link:[12]
[S(CH3)3]+
D-space link:[13]
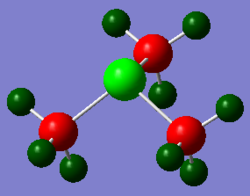
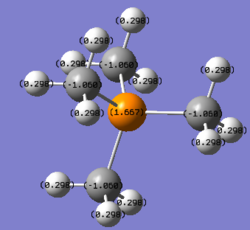
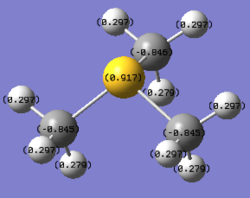
Comparison between Charge Distribution Across the Trio of Cations
| Type | [N(CH3)4]+ | [P(CH3)4]+ | [S(CH3)3]+ |
|---|---|---|---|
| Colour |  |
 |
|
| Number |  |
 |
|
(Red colour indicates negative charge and green colour indicates positive charge)
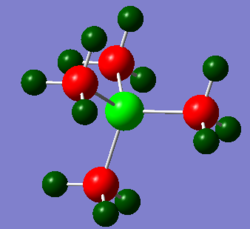
From the table, it can be observed that [N(CH3)4]+ has a negatively charged nitrogen atom and negatively charged carbon atoms. Which carbon atoms (-0.483) are more negatively charged than the nitrogen atom (-0.295). The molecule has an overall +1 positive charge with the positively charged hydrogen atoms (0.269).
[P(CH3)4]+ has a similar structure to [N(CH3)4]+ but the Phosphorus central atom is positively charged (1.667). This is due to the carbon atom being more electronegative than phosphorus, and nitrogen more electronegative than carbon. Since there are 4 carbon atoms surrounding the phosphorus atom in [P(CH3)4]+ and the molecule being overall electron deficient, phosphorus became very positively charged.
Despite the sulphur atom being slightly more electronegative than the carbon atom according to the Pauling scale[3](2.58 on S to 2.55 on C)[S(CH3)3]+ have a positive charge on sulphur (0.917) and negative charge on its carbon atoms (-0.846). This can be rationalized by treating the electron being removed from the molecule to give the overall +1 charge was located on the sulphur atom lone pair, the localized electron density then causes the sulphur to have a net positive charge, and the carbon atoms draw electron density from the hydrogen atoms to obtain a negative charge.
Conventional Depiction of [NR4]+
[NR4]+ was often described as:
On the diagram the nitrogen was marked as positively charged, however the NBO population analysis tells that the nitrogen centre is in fact negatively charged, therefore it seems the conventional description of the [NR4]+ is invalid.
Relative Contribution of the C and Heteroatom to the C-X bond
| Atom | C-N | C-P | C-S |
|---|---|---|---|
| Carbon | 34% (21% s character, 79% p character) | 60% (25% s character, 75% p character) | 49% (20% s character, 80% p character) |
| Heteroatom | 66% (25% s character, 75% p character) | 40% (25% s character, 74% p character) | 51% (17% s character, 82% p character) |
By looking at the contributions to the C-X bonding and the charge on the central heteroatom, it was found that the more positively charge the central atom is, the more carbon contributes to the bonding.
Influence of Functional Groups
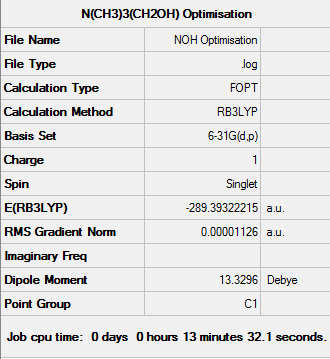
[N(CH3)3(CH2OH)]+ Analysis
D-space link:[14]
[N(CH)(CHOH)] |
Item               Value     Threshold  Converged?
 Maximum Force            0.000039     0.000450     YES
 RMS     Force            0.000007     0.000300     YES
 Maximum Displacement     0.000499     0.001800     YES
 RMS     Displacement     0.000149     0.001200     YES
 Predicted change in Energy=-1.277886D-08
 Optimization completed.
    -- Stationary point found.
Frequency Analysis of [N(CH3)3(CH2OH)]+
The full frequency analysis can be found here:
D-space link:[15]
Low frequencies --- -127.7555  -11.3869   -0.0014   -0.0014   -0.0009    7.0926
 Low frequencies ---   10.2145  130.6157  215.1083
Charge Distribution on [N(CH3)3(CH2OH)]+
Full NBO population analysis can be found here
D-space link:[16]
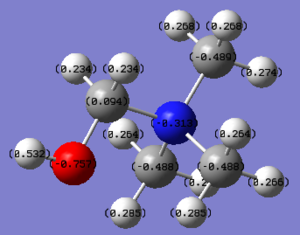
The OH on [N(CH3)3(CH2OH)]+ acts as an electron donating group. Although the carbon adjacent to the oxygen is positively charged due to the highly electronegative oxygen atom, the nitrogen atom (-0.313) and the carbon atoms (-0.489) adjacent to the nitrogen atom gained electron density, when compared to [N(CH3)4]+ (-0.295 on N and -0.483 on C).
[N(CH3)3(CH2CN)]+ Analysis
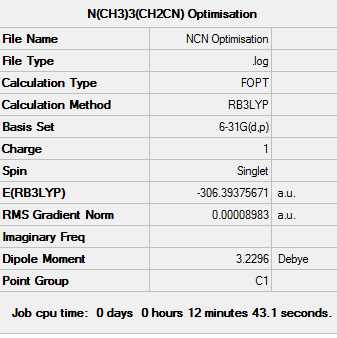
D-space link:[17]
[N(CH)(CHCN)] |
Item               Value     Threshold  Converged?
 Maximum Force            0.000202     0.000450     YES
 RMS     Force            0.000043     0.000300     YES
 Maximum Displacement     0.001185     0.001800     YES
 RMS     Displacement     0.000353     0.001200     YES
 Predicted change in Energy=-3.206300D-07
 Optimization completed.
    -- Stationary point found.
Frequency Analysis of [N(CH3)3(CH2CN)]+
The full frequency analysis of [N(CH3)3(CH2CN)]+ can be found here:
D-space link:[18]
Low frequencies ---  -12.9656   -7.7171   -0.0008   -0.0006    0.0003    8.4668
 Low frequencies ---   91.0809  154.2796  207.8594
Charge Distribution of [N(CH3)3(CH2CN)]+
The full NBO population analysis can be found here:
D-space link:[19]
The CN group on [N(CH3)3(CH2CN)]+ acts as an electron withdrawing group due to the electronegative nitrogen. The CN group causes the adjacent carbon (-0.358) and the central nitrogen atom (-0.289) to have less electron density, compared to [N(CH3)4]+ (-0.295 on N and -0.483 on C). The methyl hydrogen atoms has decreased electron density (0.271-0.282 on [N(CH3)3(CH2CN)]+, 0.269 on [N(CH3)4]+. Although CN being an electron withdrawing group, the methyl carbons have gained electron density (-0.485 on [N(CH3)3(CH2CN)]+, -0.483 on [N(CH3)4]+)
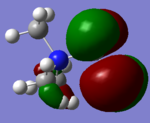
Comparison of HOMO/LUMO
| MO Type | [N(CH3)4]+ | [N(CH3)3(CH2OH)]+ | [N(CH3)3(CH2CN)]+ |
|---|---|---|---|
| LUMO |  |
 |

|
| HOMO |  |
 |

|
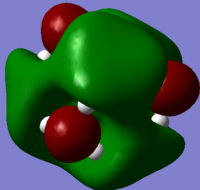
From the table a significant change of electron density on the LUMO/HOMO was observed after the addition of a functional group. On the [N(CH3)3(CH2OH)]+ HOMO, there's very few electron density around the central nitrogen atom, most electron density are centred around the functional group OH. Whereas on the LUMO there is an increase in electron density around the central nitrogen atom and less around OH.
On the [N(CH3)3(CH2CN)]+ HOMO there is very few electron density around the central nitrogen atom, most of them around the functional grouop CN, on the LUMO it can be found that electron density was slightly "dragged" towards the functional group.
The energies of the LUMO/HOMO can be compared
| MO Type | [N(CH3)4]+ | [N(CH3)3(CH2OH)]+ | [N(CH3)3(CH2CN)]+ |
|---|---|---|---|
| LUMO | -0.13305 | -0.11993 | -0.18176 |
| HOMO | -0.57929 | -0.46628 | -0.50043 |
Looking at [N(CH3)3(CH2OH)]+, the addition of the electron donating OH group raised the energy of the HOMO from -0.57929 to -0.46628, making the structure more readily to lose an electron, hence overall a better electron donor (lewis base)and will be more susceptible to electrophilic attack.
Consider [N(CH3)3(CH2CN)]+, the addition of the CN electron withdrawing group lowers the LUMO energy from -0.13305 to -0.18176, making the molecule more likely to accept electrons, hence a better electron acceptor (lewis acid) and will be more susceptible to nucleophilic attack.
References
- ↑ http://www.newagepublishers.com/samplechapter/000568.pdf
- ↑ http://employees.csbsju.edu/cschaller/Principles%20Chem/structure%20determination/IRSubtle.htm
- ↑ L. Pauling, The Nature of the Chemical Bond, Cornell Univ., USA, 3rd ed., 1960.

