Rep:Mod:nads8788
Module 2 - Inorganic
BH3 Introduction Module
| before optimisation | after optimisation | |
|---|---|---|
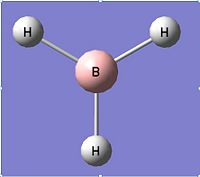 |
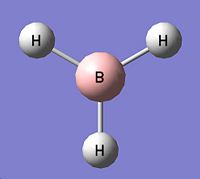
| |
| B-H bond length=1.5Å H-B-H angle = 120° |
B-H bond length=1.19435Å H-B-H angle = 120° |
| BH3 optimisation summary | |
|---|---|
| File type Calculation Type Calculation Method Basis Set Energy Dipole Moment Point Group Calculation Time |
.log FOPT RB3LYP 3-21 G -26.46226438 a.u. 0 Debye D3H 25 seconds |
The first molecule investigated was that of BH3. The molecule was drawn in Gaussview and the bond lengths set to 1.5Å for all B-H. This structure can be seen to the left. The H-B-H angle at this point was 120°. A B3LYP/3-21G optimisation was then carried out using Gaussian which gave the following optimised structure (left). This resulted in a new H-B bond of length 1.19435Å and a H-B-H angle of 120°. Whilst the bond angle had not changed, it is obvious that during the optimisation the bond lenth had decreased to give a lower energy molecule.
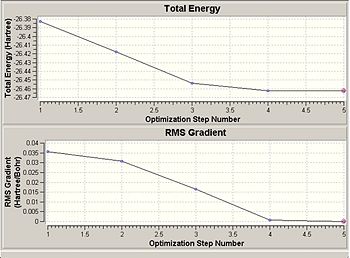
A summary of the optimisation calculation is shown above, and to the right is a graph showing the calculated total energy of BH3 as it optimises its structure. Below the energy graph is the differential. As the calculation took a total of 25 seconds, and there are 5 points on the graph, we can see that each energy calculation took 5 seconds.
Gaussian works to find the lowest energy conformation by altering the conformation of the molecule and calculating its energy. It does this until it's changes no longer affect the energy of the conformation i.e. until it has reached the lowest energy possible. The energy minima can be found by taking the differential of the energy graph, and when this equals 0, it shows the energy is no longer changing. This is shown more generally with the energy potential graph below, which shows that the lowest energy is at the equilibrium conformation (eqm bond length), and this energy minima is found when the gradient is equal to 0.
Below is a diagram of the BH3 molecule at each step of the calculation. We can clearly see the H atoms being brought closer to the central B atom as the energy becomes optimised. At the energy minimum we can see the full optimised structure, including bonds.
A chemical bond is generally defined as an attraction between two atoms, and the sharing of electrons between the two bring about a stable energy conformation. It can therefore be suggested that the lack of bonds on some of the structures shown on Gaussview shows that the programme believes there to be insufficient attraction and electron sharing to define the interaction as a bond. However, there may still be an interaction between the atoms, but they will just not be at the most stable energy possible.

BCl3
| BCl3after optimisation |
|---|
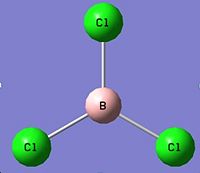
|
| B-Cl bond length=1.86592Å Cl-B-Cl angle = 120° |
| BCl3 optimisation summary | |
|---|---|
| File type Calculation Type Calculation Method Basis Set Energy Dipole Moment Point Group Calculation Time |
.log FOPT RB3LYP LanL2MB -69.43928112 a.u. 0 Debye D3H 12 seconds |
BCl3 was drawn in Gaussview as carried out previously, and its conformation and energy optimised using the B3LYP/LanL2MB method. The LanL2MB basis set was used due to the presence of the Cl, and so will take into account pseudo potentials. This gave a B-Cl bond angle of 1.86592Å, and again an angle of 120°. The optimisation summary can be seen to the right.
The summary to the right also shows that the molecule has no overall dipole and D3H symmetry.
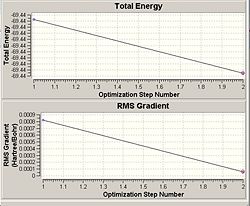
As shown on by the energy graph to the right, the calculation was carried out in 1 step, going straight from the unoptimised to the lowest energy conformation in the 12 seconds that the calculation took. This suggests that the molecule was very much close to the correct optimised sructure, and therefore was also close to the lowest possible energy.
Small Molecule - H2O
| H2O after optimisation |
|---|
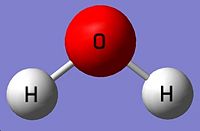 |
| O-H bond length=0.99683Å H-O-H angle = 103.991° |
| H2O optimisation summary | |
|---|---|
| File type Calculation Type Calculation Method Basis Set Energy Dipole Moment Point Group Calculation Time |
.log FOPT RB3LYP 3-21 G -75.97396515 a.u. 2.2381 Debye C2V 16 seconds |
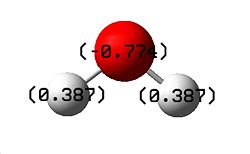
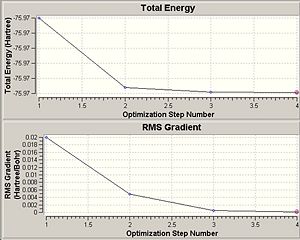
Another small molecule, H2O, was chosen and drawn in Gaussview. The molecule was first optimised using the B3LYP/ 3-21G optimisation, which was calculated in 16 seconds, and gave an energy of -75.97396515 a.u. It has also been shown to have C2V symmetry as expected. In addition, unlike both BH3 and BCl3, H2O has a dipole moment of 2.2 Debye. The charge associated with the atoms is symmetrical, and can be seen in the diagram below, along with the energy diagrams.
 |
 |
| H2O optimisation summary 2 | DOI:10042/to-1180 |
|---|---|
| File type Calculation Type Calculation Method Basis Set Energy Dipole Moment Point Group Calculation Time |
.log FREQ RB3LYP 6-31G(d) -76.40896328 a.u. 2.0949 Debye C2V 1 min 32 s |
A second more accurate calculation was then carried out using the scan service. The B3LYP/6-31G(d) optimisation was carried out in 1 min 32 seconds, and the calcuation results shown to the right. The results for this have also been published. A freqency analysis was also carried out which gave the following vibrations:

The co-ordinates of the atoms (O=1, H=2&3) can be seen below:
Standard orientation: --------------------------------------------------------------------- Center Atomic Atomic Coordinates (Angstroms) Number Number Type X Y Z --------------------------------------------------------------------- 1 8 0 0.000000 0.000000 0.119693 2 1 0 0.000000 0.761574 -0.478771 3 1 0 0.000000 -0.761574 -0.478771 --------------------------------------------------------------------- |
Vibrational Analysis and Molecular Orbitals of BH3
Vibrational Analysis
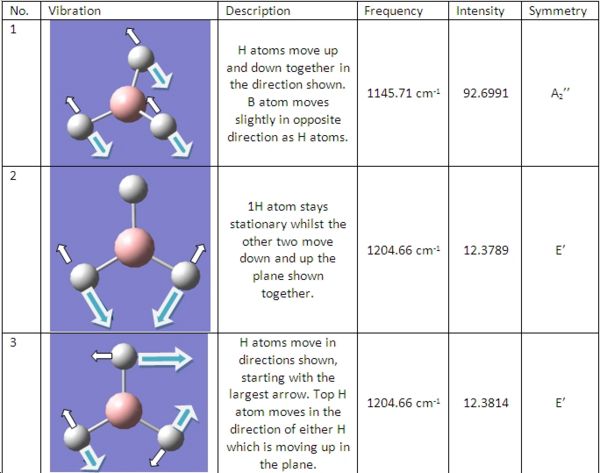
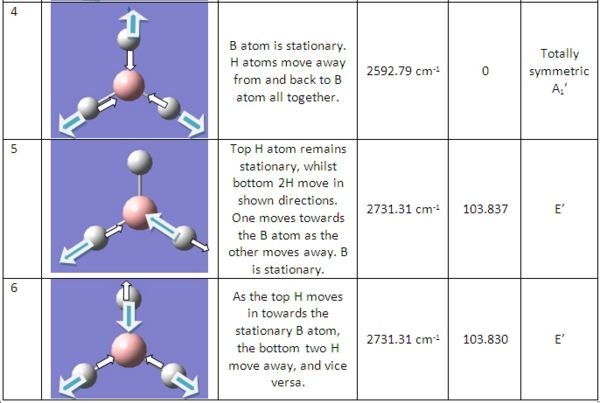
The BH3 molecule previously optimised was then used for the following vibrational and molecular orbital analysis. This was saved in Gaussview, followed by a "freq" calculation along with adding the instruction "pop=full" to the calculation. This ensures all electron density is considered and allows for the calculation of molecular orbitals later.
The frequency calculation resulted in 6 vibration of BH3, which are shown on the right. These result in the following IR spectra shown below:
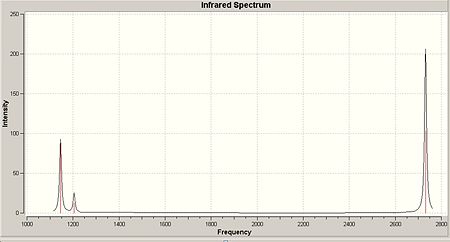
As shown in the calculated IR spectrum, there are only 3 peaks shown, whereas there are 6 distict vibrations possible with this molecule. We can account for the loss of two of these peaks due to the fact that both vibration numbers 2&3 and 5&6 are of the same energy. Thus, they will join peaks and show 1 peak on the IR. The last vibration, number 4, is not shown on the IR due to the fact that it is totally symmetric. Infra-red spectroscopy relies on a dipole being present dueing the vibration, and due to the fact that the molecule is symmetrical, it means it has no dipole, and thus is not detected on IR.
Molecular Orbitals
|
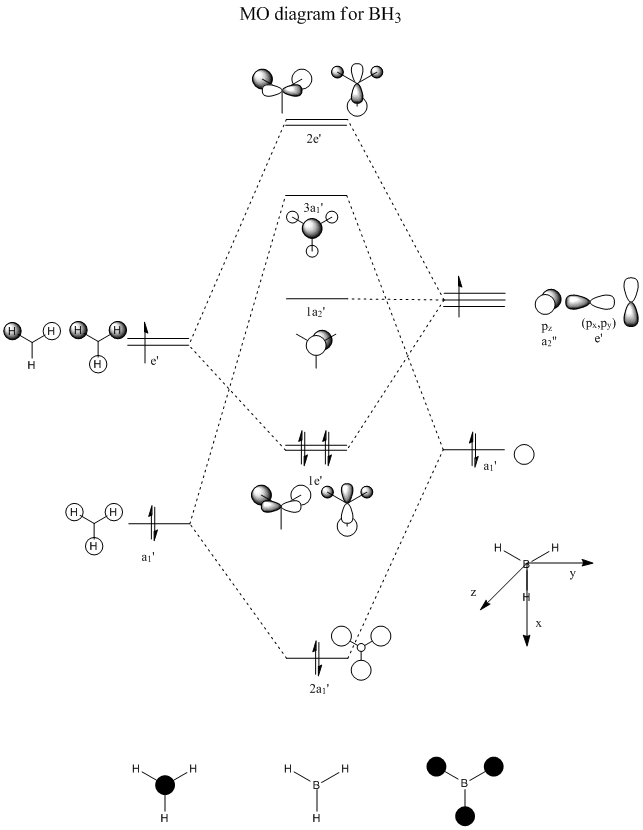
To the left is a molecular orbital diagram worked out for a molecule of BH3. We can see the orbitals from both the H and the B which combine to give the predicted MOs that can be seen in the centre of the diagram. The s oritals all in phase of the 3 H combine with the 2s orbital on the B, giving the largest splitting. Then, two other degenerate 3H orbitals combine with the px and py orbitals of the boron, to give 2 degenerate bonding and 2 degenerate anti-bonding orbitals. The pz orbital is non-bonding, and so does not change its molecular orbital.
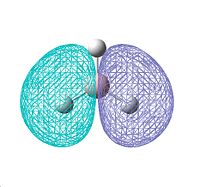
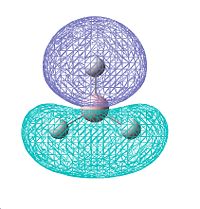
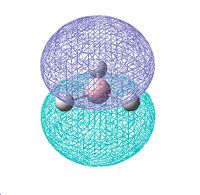
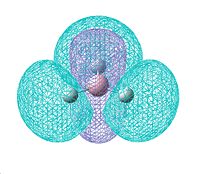
Molecular orbitals were calculated on Gaussview using the more accurate 6-31G method, which gave the following molecular orbitals shown in the table below. It was initially tried using the less accurate basis set of 3-21G, which surprisingly gave the MO6 (3a1' on MO diagram) at a higher energy than the two degenerate MOs 7 and 8 (2e' on diagram). This suggests that these 3 molecular orbitals may be close in energy as the two different basis sets calculated them to be in different positions. However, due to the 6-31G method being the most accurate, we shall take these MOs.
Comparing the calculated molecular orbitlas with the predicted we can see definite similarities in shape, along with the relative energies being in the order of those predicted. The "lobes" of the molecular orbitals calculated do agree wth those predicted, in the fact that there are in the correct places and orientation. In some predicted, eg for MO 7, the predicted showed 3 lobes of the dark phase orbital, whilst in the actual calculated these areas of same phase have merged all into 1 area spanning the width of the molecule.
Organometallic Complexes
Isomers of the molecule Mo(CO)4(PMe3)2 were investigated. The two isomers of cis and trans were drawn in gaussview and their energies calculated and structures optimised 3 times, with each optimisation being of greater accuracy, by improving the basis sets. The jmols of the structures shown are from the most accurate optimisation model, which is the advanced.
Trans-Mo(CO)4(PMe3)2
| Advanced Optimisation of trans conformer | |||
|---|---|---|---|
|
| B3LYP/LanL2MB optimisation (trans) | B3LYP/LanL2MB optimisation (trans) published | Advanced optimisation (trans) published | ||||||
|---|---|---|---|---|---|---|---|---|
|
|
|
The first optimisation resulted in no bonds being shown between the P and the Mo. After subsequent optimisations, the bond was then shown in Gaussview, showing that the bond length had become shorter. From this, the P-Mo bond length was investigated, along with the C-O triple bond and the Mo-C bond.
| Bond | B3YLYP/LanL2MB Optimisation (Å) | B3LYP/LanL2DZ Optimisation(Å) | Advanced Optimisation (Å) |
|---|---|---|---|
| Mo - P | 2.65025 | 2.39 | 2.39 |
| Mo - C | 2.04657 | 2.06 | 2.06 |
| C-O triple | 1.20462 | 1.11540 | 1.11540 |
It is clearly shown that the P-Mo bond length decreases in length as the optimisations increase in accuracy. This means the whole PMe3 group to to move in towards the central metal atom, making the Mo-C bond longer, and the C-O triple bond shorter. This shows that during the optimisation less electron density is kept in the Mo-C bond, as there is more around the C-O triple bond. From now on, it can be seen that the Advanced calculation which includes the d orbitals of the P atoms, was the most accurate, and thus all comparisons shall be made using these optimisations.
Cis-Mo(CO)4(PMe3)2
| Advanced Optimisation of cis conformer | |||
|---|---|---|---|
|
| B3LYP/LanL2MB optimisation (cis) | B3LYP/LanL2MB optimisation (cis) published | Advanced optimisation (cis) published | ||||||
|---|---|---|---|---|---|---|---|---|
|
|
|
It is shown that the calculated cis isomer has a very similar calculated energy than the trans-isomer, around -773 a.u. However, unlike the trans- isomer, the cis has a significant dipole over the whole complex, calculated to be 9.094 Debye. This is due to the asymmetry of the molecule in comparison to the trans-, which has practically no overall dipole due to the fact that the positions of the ligand on the molecule cancel out the dipole.
| Bond | Trans isomer(Å) | Cis isomer(Å) |
|---|---|---|
| Mo - P | 2.39 | 2.74478 |
| Mo - C | 2.06 | trans- to PMe3 group: 1.99148 cis- to PMe3 group: 2.05066 |
| C-O triple | 1.11540 | trans- to PMe3 group: 1.20701 cis- to PMe3 group: 1.20393 |
For the cis- isomer there are 2 different Mo-C and C-O triple bonds, depending on whether the ligand in question is trans or cis to the PMe3 group. The Mo-C bond trans to PMe3 is shorter than the Mo-C cis to PMe3. This will be due to the interactions of the larger pMe3 group making the Mo-C bond cis to it longer. The C-O triple bonds remain very similar, with just 0.004Å difference between the two bond lengths for the cis- isomer.
When comparing the total energies of the complexes, using the advanced optimisations, we can calculate the cis-isomer to be more stable than the trans by 167.4kJ/mol. This is not a high energy difference, but does suggest the cis-isomer to be the more stable of the two.
Calculating the energies of both isomers it has been shown that the cis- is the most stable of the 2 isomers, with a stabilisation of 167kJ/mol more than the trans.
Investigating Vibrations
| Trans- IR spectrum DOI:10042/to-1274 | Cis- IR spectrumDOI:10042/to-1275 |
|---|---|
 |
|
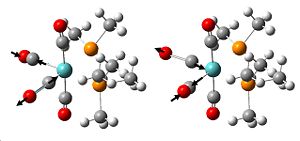
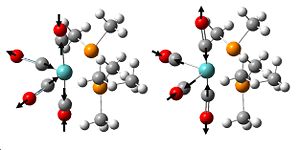
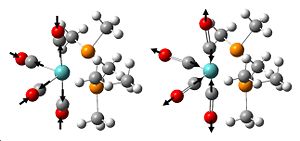
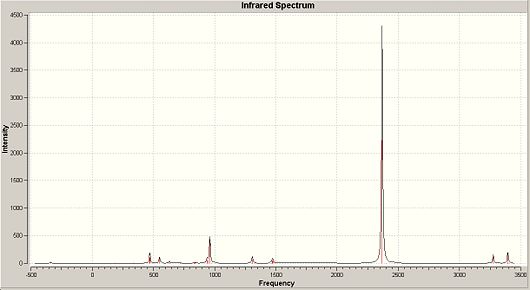
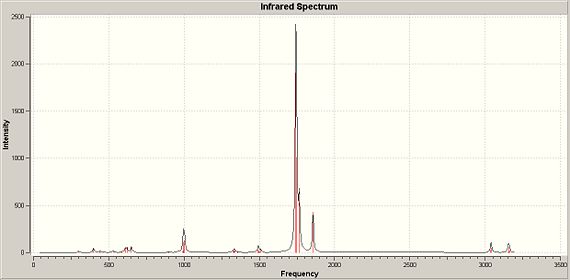
As shown above, the main difference between the two isomers is the C-O triple bond vibrations. In the trans-isomer, there is only 1 main vibration, shown by the very large peak around 2368cm-1, whilst with the cis- conformation we can see 3 main IR peaks at around 1742/7cm-1, 1765cm-1 and 1856cm-1. An explanation for this can be associated to the symmetry of the isomers. As IR depends on the change in dipole of the molecule to bring about a peak on the spectrum, a degree of asymmetry is required. With the trans isomer, there is a greater degree of symmetry when comparing to the cis, which results in fewer C-O triple bond vibrations shown on the spectrum. i.e. some of its vibrations will bring about no change in dipole, and so are not detected. The trans- isomer has one peak, made up of 2 degenerate vibrations, whilst the cis isomer has 3 peaks, made up of 4 vibrations of which 2 are degenerate. These vibrations are shown below, along with the 2 vibrations for the trans which due to a symmetrical vibration have no dipole change and thus are not shown on IR:
The small inaccuracy with the degeneracies is due to the Mo complex not been entirely best optimised, but this is as accurate as the programme can make it, with this basis set.
The C-O triple bond vibrations all occur above for trans and below for cis, around the stated frequency for the vibration of carbon monoxide, a free C-O triple bond. This frequency has been given to be 2143cm-1 [1] This suggests that the C-O triple bond on the trans- isomer is of higher energy than a normal C-O triple bond, whilst the cis- is of lower energy. This agrees with the calculated bond lengths of the C-O triple bond, as the bond on the trans- isomer is not only shorter than the cis- C-O triple bond showing it to be a stronger bond, but it is closest to the bond length of carbon monoxide which is 1.128Å. [1]
Ammonia
Symmetry and Optimisation
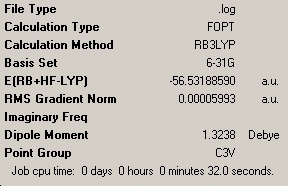
Ammonia, NH3, usually has symmetry point group C3V. However, in the next part of the project, varying geometries in which NH3 has different symmetry point groups are to be investigated. A molecule of NH3 was first drawn in Gaussview and optimised using the B3LYP/6-31G optimisation. This gave the expected point group of C3V as shown in the summary below.
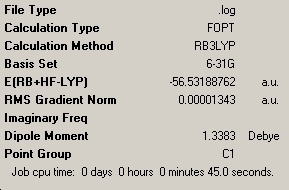
A new molecule was drawn, and one N-H bond length made longer, causing a change in the point group of the molecule. As Gaussview runs its optimisation calculations maintaining the symmetry of the molecule drawn, we can say that the molecule cannot "break symmetry" during the optimisation. This resulted in a different optimised structure which had C1 symmetry, once again shown below.
The last NH3 molecule made was that with point group D3h, which was aided in the calculation by adding a "dummy atom". This molecule is seen to be completely flat and in one plane.
| C3V NH3 Summary | C1 NH3 Summary | D3h NH3 Summary | |||||||||
|---|---|---|---|---|---|---|---|---|---|---|---|
 |
 |

| |||||||||
|
|
|
The initial symmetry of the molecule has made a difference to the final stucture observed, as we can see the angle from the H-N-C3 axis changes with each symmetry element. With the highest symmetry D3h molecule we can see a large angle as the N-H bonds are all in the same plane i.e. it is flat. As we go from the C1 to the C3V the molecule becaomes increasingly less planar and the H become closer together. In addition to this we can also see that the more symmetrical D3h molecule took longer to calculate (1min 42s) in comparison to C1 (45s) and C3V (32s). Thus we can conclude that the more symmetrical the molecule, the longer it takes to optimise its structure. Any high symmetry molecule therefore can be expected to take a longer time to have its optimisation calculated. In addition, high symmerty molecules also present the problem with the fact that Gaussview doesnt change the symmetry during the optimisation. Therefore, if the molecule is drawn inaccurately enough for Gaussview not the recognise the symmetry, it may not give the most optimised structure possible in the output.
Whilst the energies of all 3 geometries are very similar ≈-56.5 a.u., the lowest energy geometry of the NH3 molecule is that with symmetry C1, the lowest symmetry geometry. This is where one of the N-H bonds was a different length to the other two in the molecule. This extra energy stabilisation is most likely due to this change in bond length, which may bring about changes in the electron denisties of the molecule and making it more stable. However, this different bond length does not occur naturally, and so the second most stable geometry with C3V point group is the one we observe. Looking at the energy difference between the 3 geometries, there really is not that much difference. C1 geometry is -0.00451586kJ/mol more stable than C3V and -0.907714115kJ/mol more stable than the D3h conformation, which is slightly more significant a difference.
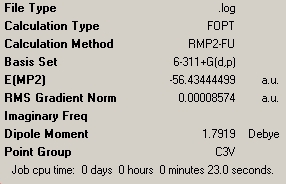
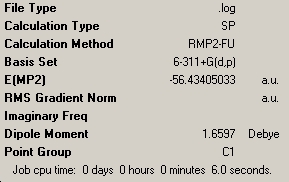
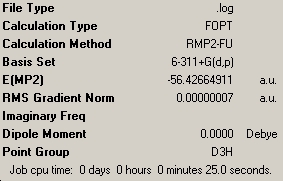
Below shows the summaries of more optimisations of all 3 geometries, using the more accurate basis set of 6-311+G(d,p):
| C3V NH3 | C1 NH3 | D3h NH3 |
|---|---|---|
 |
 |
|
[2]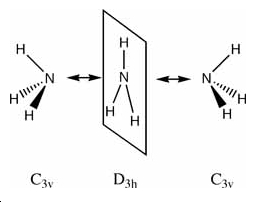 |
As shown above, these calculations were a lot quicker compared to the lower level ones carried out previously. This is due to the fact that the new optimisation was carried out following the previous optimisation, and thus the molecules were already very much optimised. The C1 geometry was quickest with a calculation tie of 6 seconds, showing it to be mainly optimised after the previous calculation. The C3V and D3h optimisations took 23 and 25 seconds respectively.
The NH3 molecule goes through continuous conversion of its geometry, with the two extremes of its inversion being the C3V and the D3h geometries of the molecule, as shown in the diagram. Thus, from calculating the difference between these two optimised energies, it is possible to calculate the energy barrier height to inversion. This was calculated to be 20.46808294 kJ/mol.
The experimentally determined barrier is 24.3 kJ/mol
[2] making the calculated value inaccurate by 3.83kJ/mol, which is not too great a value. This inaccuracy is attributed to the inaccuracy of the optimisation and the basis set.
Ammonia Inversion
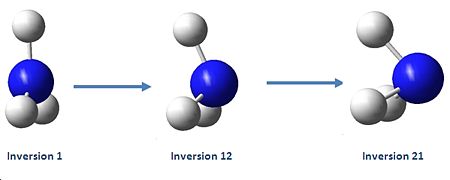
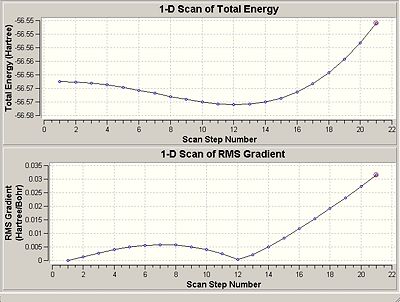
Above is a diagram showing the two extremes of the ammonia inversion, which in the calculation consisted of 21 steps. Inversion 1, starting at angle from the H-N-C3 axis of 90°, shown in the eigenvalue data below under A1, is the first extreme. Going from this, at step 12 we reach the minimum total energy of the molecule and thus this is the optimised structure we want. This inversion 12 has an angle to the H-N-C3 axis of 68°. The energy minima is shown in the energy graphs below. After this inversion 12, the angle continues to decrease, and we see the energy of the molecule increasing up to the last inversion at 21, where the angle is 50°.
   Summary of Optimized Potential Surface Scan
                          1         2         3         4         5
    EIGENVALUES --   -56.56750 -56.56765 -56.56806 -56.56874 -56.56962
          R1            .99867    .99867    .99929   1.00002   1.00102
          A1          90.00000  88.00000  86.00000  84.00000  82.00000
          T1         120.00000 120.00000 120.00000 120.00000 120.00000
                          6         7         8         9        10
    EIGENVALUES --   -56.57067 -56.57182 -56.57300 -56.57410 -56.57505
          R1           1.00232   1.00388   1.00570   1.00776   1.01005
          A1          80.00000  78.00000  76.00000  74.00000  72.00000
          T1         120.00000 120.00000 120.00000 120.00000 120.00000
                         11        12        13        14        15
    EIGENVALUES --   -56.57572 -56.57603 -56.57585 -56.57509 -56.57365
          R1           1.01254   1.01525   1.01814   1.02124   1.02454
          A1          70.00000  68.00000  66.00000  64.00000  62.00000
          T1         120.00000 120.00000 120.00000 120.00000 120.00000
                         16        17        18        19        20
    EIGENVALUES --   -56.57142 -56.56833 -56.56431 -56.55930 -56.55321
          R1           1.02805   1.03178   1.03574   1.03995   1.04447
          A1          60.00000  58.00000  56.00000  54.00000  52.00000
          T1         120.00000 120.00000 120.00000 120.00000 120.00000
                         21
    EIGENVALUES --   -56.54594
          R1           1.04941
          A1          50.00000
          T1         120.00000
|
Ammonia Vibrations
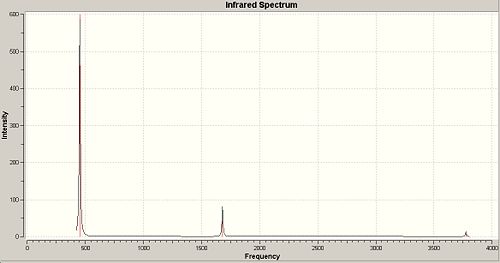
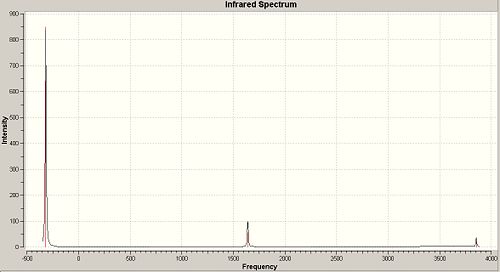
A frequency calculation was then carried out on the B3-LYP/6-31G optimised c3V and D3h geometries of ammonia, which gave the following IR spectra:
| C3V NH3 IR | D3h NH3 IR |
|---|---|
 |
|
 |

|
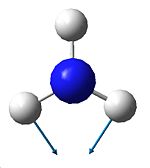
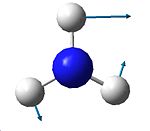
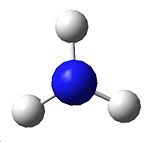
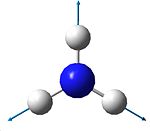
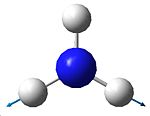
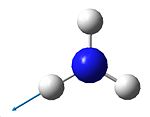
The vibrations are analogous to those of BH3 and can be seen below. There are 6 possible vibrations, of which there are 2 pairs of degenerate vibrations, no.2&3 and 5&6. However, one of the frequencies for the D3h NH3 is a negative frequency, and thus is not possible. This results with C3V having 6 vibrations, and D3h having 5. Although we can note that 1 of these 5 vibrations, no4, on the D3h ammonia will not be seen on IR due to it being sompletely symmetric, and thus would bring about no dipole. Due to the H atoms being at more of an angle on the C3V ammonia this vibration is detected on its IR. It can also be seen that the vibrations for both molecules are basically the same relating to the movement of the H atoms, however they are at different energies.
| 1 | 2 | 3 | 4 | 5 | 6 | |
|---|---|---|---|---|---|---|
| C3V | 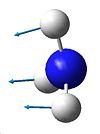 |
 |
 |
 all H atoms towards N |
 |
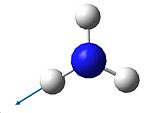 right H atom towards N |
| D3h | 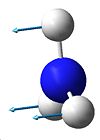 |
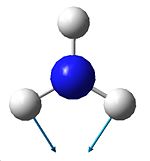 |
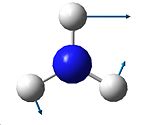 |
 |
 |
 right H atom towards N |
compare the calculated frequencies for the C3v structure to those obtained experimentally (you will have to look them up). The C3v structure is the ground state structure, ground state structures always have all positive frequencies.
The D3h structure is a transition state structure, transition states always have only one negative frequency, what is the value of negative frequency?
which vibration in the C3v and D3h structures "follows" the inversion reaction path?
Mini-Project: Stability of B2X4 derivatives
B2Cl4, a common boron halide with the formula B2X4, can be either planar or staggered depending on whether it is in the solid or gas phase. Metathesis reactions of this molecule gives a set of B2X4 derivatives. The thermal stability of these increases with increasing tendancy for the X group to form a π bond with B. [3]
| B2Cl4 < B2F4 < B2(OR)4 << B2(NR2)4 |
Therefore, this project shall be investigating the relative stability of these 4 compounds, where R=Me to maintain relatively small substituents for quicker calculations. In addition, the another common boron halide, B4Cl4 will be investigated. For all optimisations, the method B3-LYP will be used, with increasing accuracy of the basis set from 3-21G to 6-31G, to finially 6-311G.
B2Cl4
| Structure | Optimisation Summary DOI:10042/to-1344 | Orientation of charge (nbo) | |||
|---|---|---|---|---|---|
|
 |
|
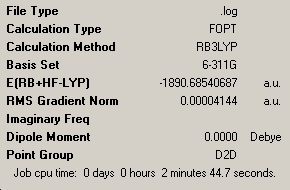
A molecule of B2Cl4 was drawn in Gaussview, and optimised using the B3-LYP/3-21G method initally, folloew by the 6-31G, and finially 6-311G basis set. It would have been more accurate to use the pseudo potential basis set LanL2DZ, but this would have meant it would not be possible to compare the results with the other X groups of OMe and NMe2, as the pseudo potential basis set is unsuitable.
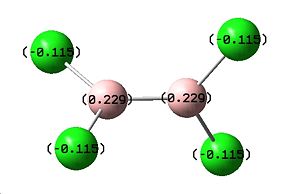
Above we can see the results of the B3LYP/6-311G optimisation, along with the nbo charge calculation, showing the degree of charge associated with each atom in the molecule. The code for this calculation is shown below:
# opt b3lyp/6-311g pop=(nbo,full) geom=connectivity
This calculation gave a total energy of 1890.68 a.u., which is very close to a calculated value (-1890.76958a.u.)for the same molecule in a journal[4], showing the calculation to be relatively accurate. The nbo showed that there is a negative charge on the Cl of -0.115 and +0.229 on the B.
We can also see that the lowest energy optimisation is the staggered D2d conformation of the molecule, which is known as the most stable conformation in the gas phase. [3] This gives the dihedral Cl-B-B-Cl angle of exactly 90°.
A frequency analysis was then carried out on the previous optimisation which generated the IR spectrum below:
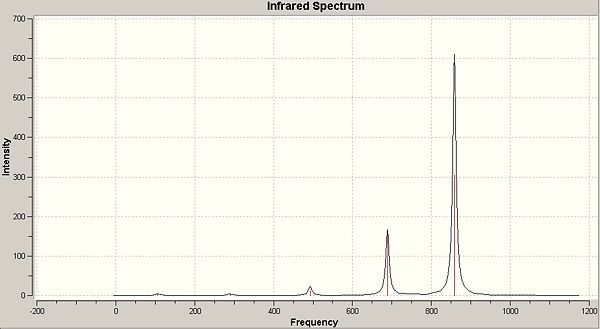
|
| DOI:10042/to-1343 |
Script used:
# freq b3lyp/6-311g pop=(nbo,full) geom=connectivity
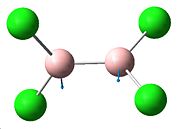
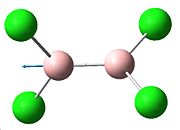
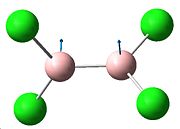
As we are investigating the degree of π bonding in the B-Cl bond, we only need to investigate the vibrations of this bond, which will make it easier when trying to compare later, as for the larger molecules, there will be a greater number of totasl vibrations for the molecule. The specific vibrations we want to look at are shown below, and relate specifically to the B-Cl bond.
| Vibration no. | 11 | 10 | 9 | 8 | 7 |
|---|---|---|---|---|---|
| Vibration | 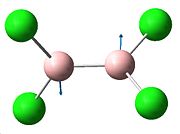 |
 |
 |
 |

|
| Frequency (cm-1) | 858.38 | 858.38 | 688.64 | 429.697 | 492.697 |
| Intensity | 305.355 | 305.355 | 167.866 | 11.9564 | 11.9564 |
| Experimentally observed (cm-1) [5] | 6-31G calc from journal(cm-1) [5] | 6-311G calculated vibrations (cm-1) |
|---|---|---|
We can determine the accuracy of these vibrational results by comparing them to the literature, which includes both the experimental results along with another Gaussian 6-31G calculation results. These show that whilst the calculated literature values are closer to those experimentally, when comparing to those calculated myself, the 6-311G calculated vales are still close enough to the experimental to be considered sufficiently accurate. They are especially close to those of the experimental at the lower frequencies, where they are more accurate than the journals calculated values. There is some deviation from the experimental at the higher frequencies, but they are still close enough. It would only be possible to get these values close to the experimental by using a more accurate optimisation.
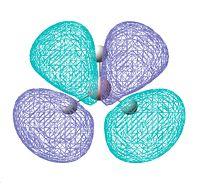
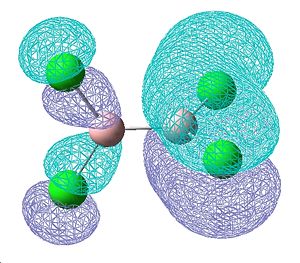
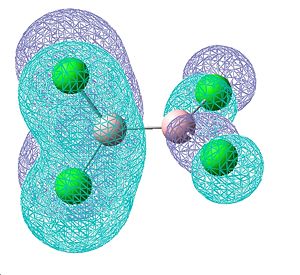
The molecular orbitals were also visualised to investigate the degree of electron density that seems to contribute towards an increasing double bond. These MOs shown below are those that were found to contain some double bond character, with 2 π-style lobes over the B-Cl bond. They are bonding orbitals and thus contain electrons. The first two MOs are degenerate, as they consist of the same molecular orbitals, just on the other side of the molecule. These show the greatest degree of π-bonding, but however also show on the other end of the molecule some degree of δ anti-bonding, which most likely aids in cancelling out this double bond character. The third of these orbitals also shows some double bond character in a different plane of the molecule, however a small proportion of the electon density seems to be away from the bond, so this delocalisation is not just orientated on the B-Cl bond.
| Molecular orbitals showing π bonding character | ||
|---|---|---|
 |
 |
|
| Relative energies: -0.403 | -0.403 | -0.380 |
B2F4
| Structure | Optimisation Summary DOI:10042/to-1345 | Orientation of charge (nbo) | |||
|---|---|---|---|---|---|
|
 |
|
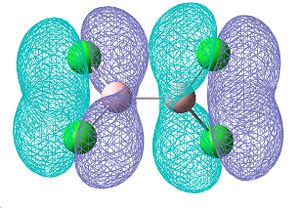
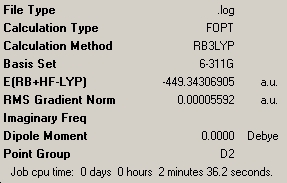
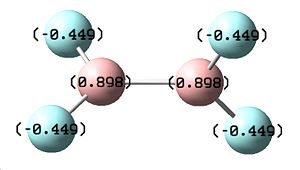
The molecule of B2F4 was drawn in Gaussview and its energy optimised using the same method as previously used for the B2Cl4 molecule. The following results were obtained, as shown above, showing this molecule to be less energetically stable, as it has an energy of -449.34 a.u., with a greater charge disrtibution on both the F atom (-0.449) and the B (+0.898) shown by the nbo analysis. This extra charge agrees with the theory suggested, as there is more charge arounf the B-F bond, however this molecule was calculated to be less energetically stable compared to B2Cl4 which is the opposite to that expected.
It can also be noted that there has been a loss in the degree of symmetry of this molecule compared to B2Cl4, as the point group has changed from D2d to D2 showing a loss of δd and S4 symmetry elements. However, there is no dipole within this molecule, just like B2Cl4 as there is sufficient symmetry that the dipoles cancel each other out.
Below we can see the calculated IR spectrum, along with the associated vibrations:

|
| DOI:10042/to-1342 |
| Vibration no. | 2 | 3 | 5 | 6 | 7 | 9 | 10 | 11 |
|---|---|---|---|---|---|---|---|---|
| Vibration |  |
 |
 |
 |
 |
 |
 |

|
| Frequency (cm-1) | 168.776 | 168.776 | 506.829 | 610.806 | 610.806 | 1072.86 | 1264.98 | 1264.98 |
| Intensity | 10.3552 | 10.3552 | 56.3408 | 45.8563 | 45.8563 | 316.857 | 223.76 | 223.76 |
Whilst the vibrations are very similar to those of B2Cl4 in the directions that the atoms move, the frequecy of these vibrations are higher, showing them to be of a higher energy. This higher energy can be attributed to an increasing degree of double bond character resulting in higher energy bonds.
| Molecular orbitals showing π bonding character | |||
|---|---|---|---|
 |
 |
 |

|
| Relative Energies: -0.560 | -0.517 | -0.517 | -0.493 |
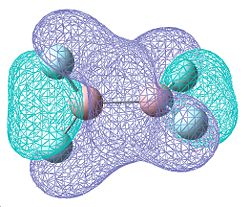
The MOs above are different to those calculated for B2Cl4. The two degenerate molecular orbitals now have no degree of δ antibonding character and are now completely π bonding for the entire of the molecule, which would suggest a greater amount of double bond character. The MO at -0.493a.u. is the same as that seen for B2Cl4, but now we have another which is more in phase ay -0.560a.u. This along with the fact that the B-F bond length is shorter than the B-Cl bond length (1.34939Å B-F versus 1.79614Å B-Cl) shows an increasing tendancy for more double bond character.
B2(OMe)4
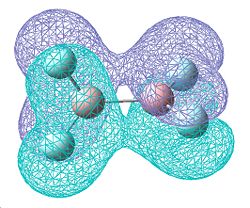
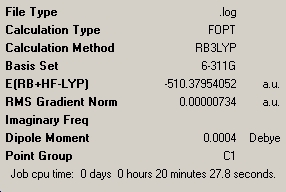
The next molecule investigated was that of B2(OMe)4. It is expected that this molecule will have a greater degree of double bond character and will be more thermally stable than the previous two. The results of the B3-LYP/6-311G optimisation can be shown below, along with the nbo charge distribution results.
| Structure | Optimisation Summary DOI:10042/to-1339 | Orientation of charge (nbo) | |||
|---|---|---|---|---|---|
|
 |
|
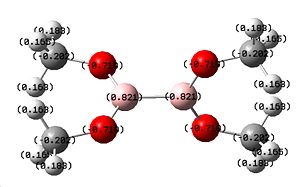
The nbo charge analysis has shown that there is a greater charge on the X atom compared to the previous two molecules, showing greater electron density on the O atom, along with a slight increase in electron density on the B atom, making it less positive. The overall total energy of -510.37a.u. makes this molecule more energetically stable compared to B2F4 as expected. We can also see the introduction of a very small dipole of 0.0004 Debye due to the loss of symmetry shown by the point group C1.
|
| DOI:10042/to-1336 |
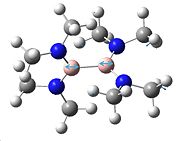
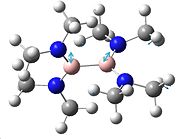
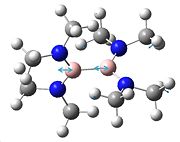
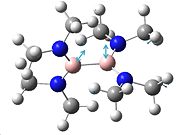
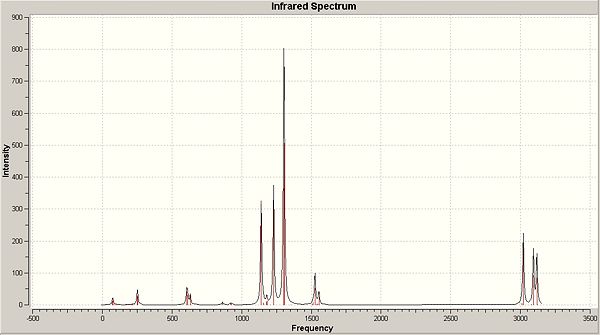
This IR spectrum is much more complicated than previously due to the presence of a greater number of atoms, and thus a greater number of possible vibrations. For this project, a lot of the vibrations have been omitted due to them not being involved in the B-O vibrations. Thus, only those that interest us have been included, and these can be seen below:
| Vibration no. | 17 | 19 | 21 | 22 | 23 | 34 | 35 |
|---|---|---|---|---|---|---|---|
| Vibration |  |
 |
 |
 |
 |
 |

|
| Frequency (cm-1) | 605.662 | 631.143 | 864.747 | 919.773 | 923.448 | 1302.14 | 1304.34 |
| Intensity | 41.7526 | 30.816 | 9.3609 | 4.7464 | 3.0498 | 364.513 | 506.029 |
The intensties of the vibrations are lower than usual due to other vibrations taking over, such as the C-H stretches which have not been included in the table above, as we are only looking at B-O vibrations. The vibration frequencies are again slightly higher showing a higher energy vibration, and thus greater double bond tendancies. There is still the similarity in the fact that the position and directions of the vibrations are very similar to those previously seen.
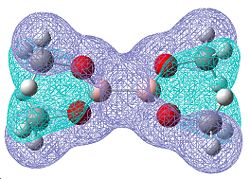
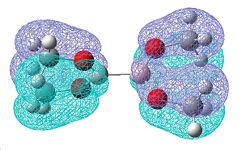
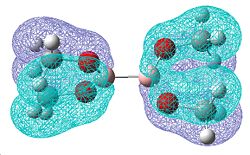
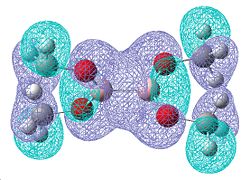
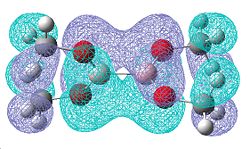
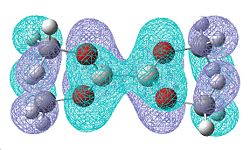
| Molecular orbitals showing π bonding character | |||
|---|---|---|---|
 |
 |
 |
|
| Relative Energies: -0.472 | -0.463 | -0.463 | -0.359 |
 |
| ||
| -0.331 | -0.329 |
Once again, there is a greater number of bonding molecular orbitals which have a significant degree of π bonding character, as there are now 6 possible π bonding orbitals compared to the 4 for B2F4, and the 3 for B2Cl4. This can be related to a greater amount of double bond character for the B-O bond.
B2(NMe2)4
| Structure | Optimisation Summary DOI:10042/to-1341 | Orientation of charge (nbo) | |||
|---|---|---|---|---|---|
|
 |
|
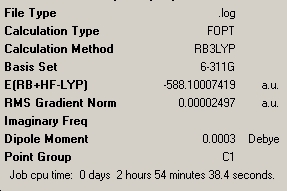
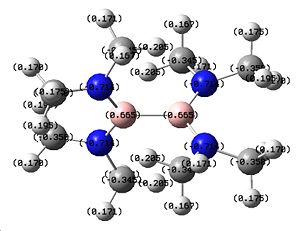
The energy of -588.100a.u. makes this molecule more stable than the previous B2F4 and B2(OMe2)4, agreeing with the theory that these groups make the molecule more stable. However, none have come close to being as energetically stable as the B2Cl4 molecule which is unexpected. Once again there is relatively high charge distribution around the N and B, and additionally the B has less positive charge on it, suggesting it to have greater electron density around the atom.
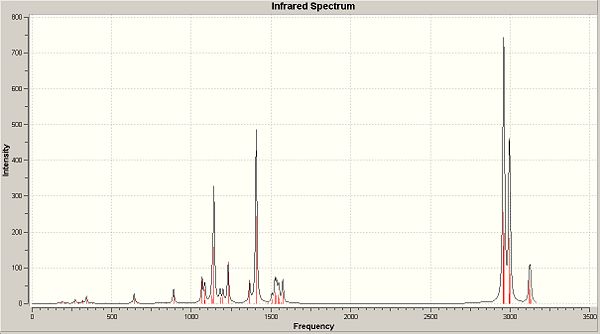
We can also see a complete loss of symmetry down to the point group C1, which will obviously have an effect on the number of vibrations found for the B-N bond. The IR was calculated and can be seen below:
|
| DOI:10042/to-1337 |
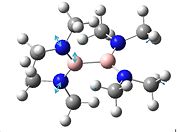
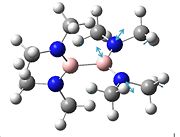
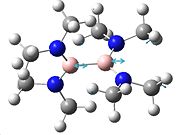
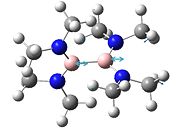
The vibrations below once again corresspond to those involving the B-N bond. They are generally of higher frequency and thus higher energy compared to those previously. The degree of displacement of the atoms shown on the molecule when seen in Gaussview is generally smaller than previously observed, due to the fact that there is a bulkier group surrounding the centre of the molecule. This restricts its movement and may account for the slightly lower intensities observed for some of the vibrations:
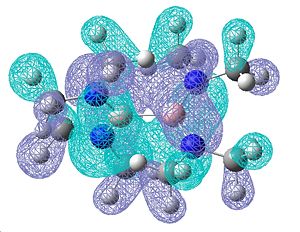
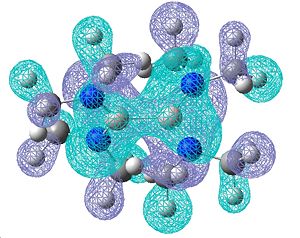
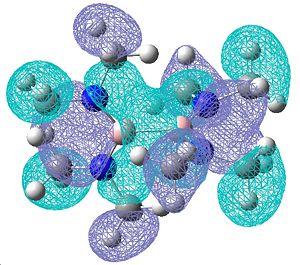
Once again, the molecular orbitals obtained do show a good degree of π bonding character, however these look a lot more complicated due to the presence of the NMe2. Below are shown the most obvious double bonding character MOs, showing a lot of electron density over the B-N bond:
| Molecular orbitals showing π bonding character | ||
|---|---|---|
 |
 |
|
| Relative Energies: -0.247 | -0.247 | -0.460 |
Conclusions
| bond | bond length (Å) | X-B-B-X dihedral angle |
|---|---|---|
| B-Cl | 1.79614 | 90° |
| B-F | 1.34939 | 90° |
| B-O | 1.38078 | 82.341° |
| B-N | 1.44197 | 89.968° |
It is suggested that there is greater thermal stability due to increasing double bond character of the series of B2X4 from Cl, F, OR to NR2. This series was investigated using R=Me, and it has been found that generally, the series has agreed with that suggested when looking at the total energy, charge distribution, vibrations, molecular orbitals and geometry of the molecules.
We can start by comparing the bond lengths of B-X (X=Cl, F, OMe, NMe2), which shows that whilst the B-Cl bond length is the longest as expected as it's bond is the most sigma like, the other 3 are quite similar to each other. The B-N bond length is longer than expected, but this may be due to the relatively bulky substituent, compared to the other molecules, which caused the B-N bond to be slightly stretched and thus made longer. The dihedral angles for both Cl-B-B-Cl and F-B-B-F being 90° accounts for the high symmetry of the molecules. This loss of symmetry on the other 2 resulted in a smaller dihedral angle along with a greater number of vibrarions in the IR.
In relation to the stability of the molecules, we can say that it agrees with the theory. Omitting the high energy value for B2Cl4, we can see a clear trend from F to NMe2 showing them to become more stable. (From -449.34a.u. for F, to -510.37a.u. for OMe, to finally -588.100a.u. for NMe2) The charge distribution also shows a decrease in positive charge on the boron atom from Cl to NMe2 suggesting a greater degree of negative electron density present on the atom.
When looking specifically at the IR spectra calculated for B2X4 we can see that as we go along the groups from Cl to NMe2 we can see a general increase in the frequency of the vibrations, correlating to a higher energy vibration. This higher energy means that the bond is stronger, and thus suggests the exisitence of double bond character on the B-X bonds.
The molecular orbitals calculated also agree with the suggested theory, due to the presence of more MOs with double bond character as we go along the group. This increasing number of bonding MOs with π bonding character means that there is an increase in the amount of electron density in these double bonding areas. This causes the δ bond to become more π-like by having more energy and becoming a shorter bond.
Whilst the results do agree with theory, there are some results that do not agree, such as the very negative total energy for B2Cl4, and the longer B-N bond of B2(NMe2)4. This could be investigated further by changing the R groups present, and changing them to more bulky substituents such as tBu, or adding on an electron donating substituent such as pyridine.
B4Cl4
B4Cl4 was then investigated, looking at its relative stability in comparison to B2Cl4. A molecule of B4Cl4 was drawn in Gaussview and the molecule optimised using the 3 previous optimisations with the last being a B3-LYP/6-311G optimisation with pop="full" and an nbo analysis. It was discovered however only at this point that the symmetry of the molecule was incorrect, as it should be Td. Therefore, a new molecule was drawn, and before the calculations were carried out, the symmetry was set in Gaussview to Td. This enabled the optimisations to be carried out correctly as Gaussview maintains the symmetry of the molecule. The following results were obtained:
| Structure | Optimisation Summary DOI:10042/to-1356 | Orientation of charge (nbo) | |||
|---|---|---|---|---|---|
|
 |
|
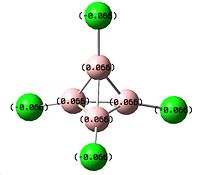
We can see that this conformation is more stable than B2Cl4 with its total energy being -1940.35a.u. in comparison to B2Cl4 with -1890.69a.u. We can also see the expected symmetry point group of Td showing very high symmetry of this molecule. Additionally, the charge distribution is exactly equal, with a relatively small amount of charge on each atom (+0.066 on the B atoms, -0.066 on the Cl atoms). This can most likely be attributed to the high symmetry of the molecule.
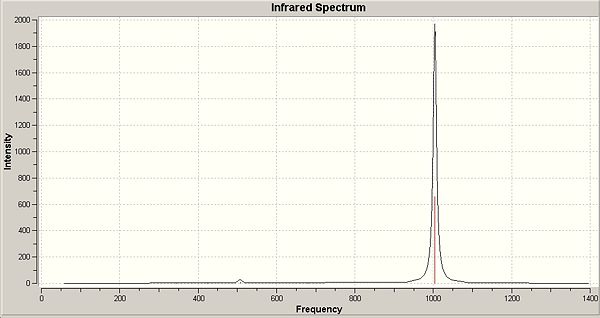
The IR was calculated as carried out previously for the other molecules, resulting in a relatively simple spectrum:
 |
| ||||||||||||||||||
| DOI:10042/to-1357 |
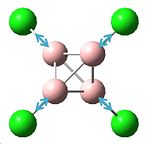
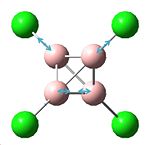
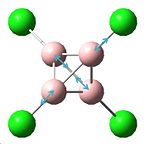
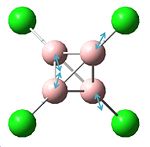
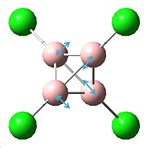
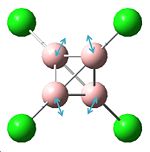
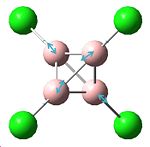
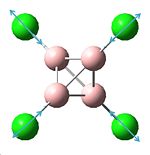
The table to the right of the spectrum shows the calculated vibration frequencies using the B3-LYP/6-311G frequency calculation compared to the experimental values. As shown, all the vibrations are relatively close to those of the experimental, and thus shows that the optimisation was relatively accurate. The main peak on the spectrum is that of a B-Cl stretch at 1003.89cm-1, of which there are 3 associated vibrations.
In the table below we can see all the vibrations for the B-B and B-Cl stretches, including those which are symmetrical and thus have intensity 0. There are 4 triplet degenerate states of vibrations due to the hig symmetry of the molecule:
Looking at the B-B stretches for B4Cl4, we can see that they have frequencies of 681.236, 507.745 and 344.481cm-1. These values are significantly lower than the B2Cl4 B-B stretch which is at 1143.29cm-1, showing the B-B bonds to be stonger in B2Cl4 due to them being higher frequency and thus higher energy. However, if we do this same comparison when looking at the B-Cl stretches we see the opposite relationship. B4Cl4 has B-Cl stretches at 1365.53 and 1003.89cm-1 which are higher frequency than the B2Cl4 stretches which are at 858.38, 668.64 and 384.32cm-1. Thus the B-Cl bonds have higher energy and thus are stonger in B4Cl4.
By looking at bond lengths we can also see this relationship. B4Cl4 has a B-B bond length of 1.68265Å, which is 0.02147Å longer than the B-B bond in B2Cl4, showing it to be weaker. Also, the B-Cl bond in B4Cl4 is 1.77219Å, which is 0.02395Å shorter than that in B2Cl4, showing it to be a stonger bond.
This character of B4Cl4 having stronger B-Cl bonds than B-B bonds has lead it to be descirebed as "4 B-Cl dimers loosely bonded together in a boron tetrahedron" [6]
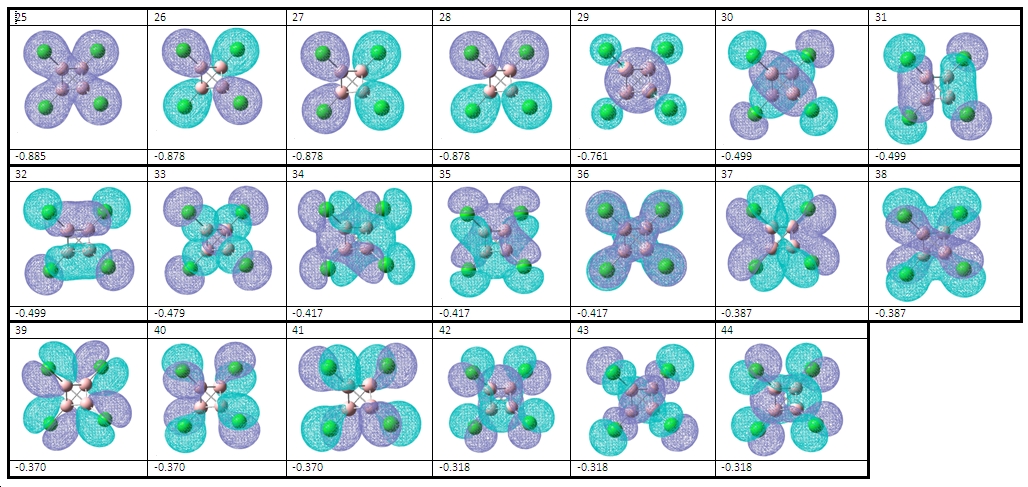
The molecular orbitals agree with this theory, as we can see more MOs involved in B-Cl bonding than B-B bonding. For example, we can see at least 9 MOs which have a complete lack of electon density around the centre of the molecule where the B-B bonds are situated.
References
- ↑ 1.0 1.1 J. Chem. Phys. 22, 381 1954; DOI:10.1063/1.1740078
- ↑ 2.0 2.1 http://www.ch.ic.ac.uk/hunt/teaching/teaching_comp_lab_year3/9c_nh3_method.html
- ↑ 3.0 3.1 Shriver & Atkins; Inorganic Chemistry; Oxford University Press 2006
- ↑ J. Mol. Structure; 635; 2003; 211–219 DOI:10.1016/S0166-1280(03)00458-5
- ↑ 5.0 5.1 J. Mol. Structure; vol 380, issues 1-2, 1996; p43-53DOI:10.1016/0022-2860(95)09185-8
- ↑ 6.0 6.1 Spectrochimica Acta Part A; vol 58, Issue 10, 2002, 2299-2309 DOI:10.1016/S1386-1425(01)00728-4


