Rep:Mod:mw1409Module2
MO analysis of BH3
BH3 optimisation
Using Gaussian, the geometry and energy of a BH3 molecule was optimised. This was done by an FOPT calculation using the RB3LYP method. The basis set used was 3-21G. The gradient was checked to ensure that the molecule was optimised. This had a value of 0.00021a.u., this is smaller than 0.001a.u. and confirms that the optimisation was completed successfully. The output text file was also checked to confirm that the job had converged.
Borane optimised structure |
The point group of BH3 was determined to be D3h as expected. The optimised B-H bond distance was calculated as 1.19Å and the optimised H-B-H bond angle was 120.0o.
BH3 vibrational analysis
The optimised BH3 molecule was submitted for a frequency analysis calculation, using the same basis set and calculation method as above. The energy of the structure after optimisation and after vibrational analysis were compared to ensure that the structure was the same. For both parts the energy was given to be -26.46226338a.u. which means that they were identical to 8 d.p. Although not an accurate calculation of energy of the molecule, it nonetheless confirms that the structure remained the same following the vibrational analysis.
In the output file generated by the frequency calculation, data for the motions of the centre of mass of the molecule could be found. These correspond with the three translational and three rotational degrees of freedom of a non-linear molecule.
In BH3 these low frequencies are found to be between -67cm-1 and 0.3cm-1. These are not accurate as there is a systematic error of about 10% in the values reported (this will be explained later on) however it does show that the low frequencies are much smaller in value than the vibrations reported in the output. The first vibration reported has a frequency of 1144cm-1 which means that the low frequency magnitudes are less than 5% of the vibrational frequencies. Although normally the low frequencies should be within the range ±10cm-1 as a low level method was used in this case, the values are reasonably small.
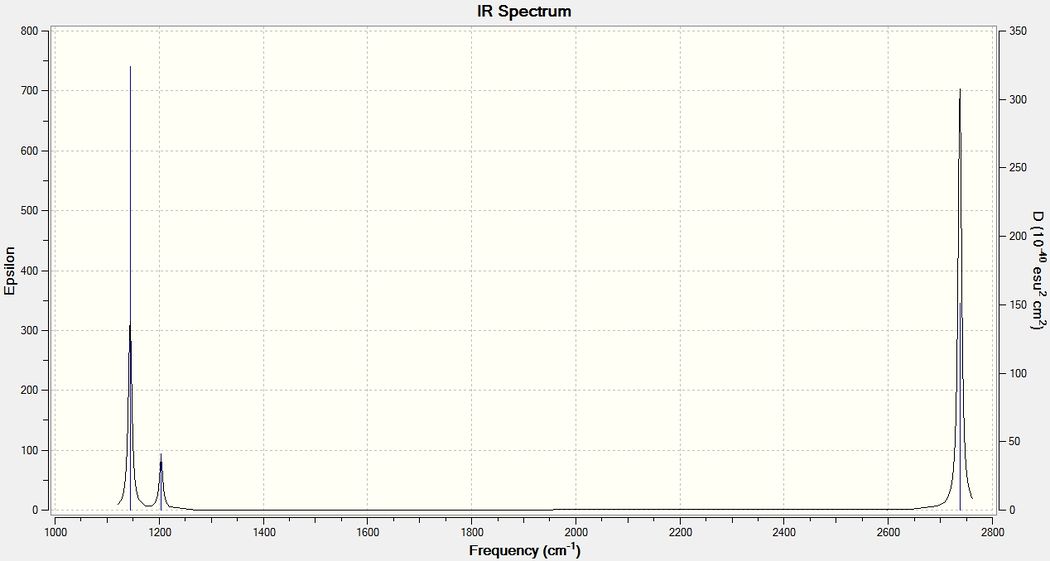
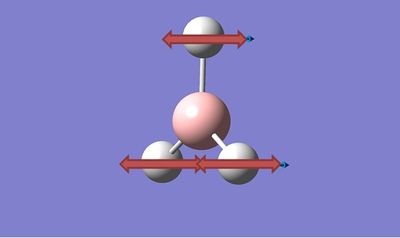
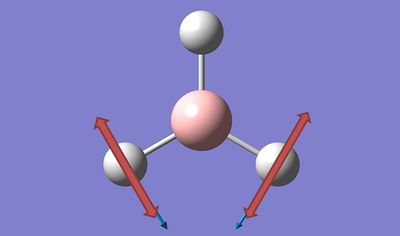
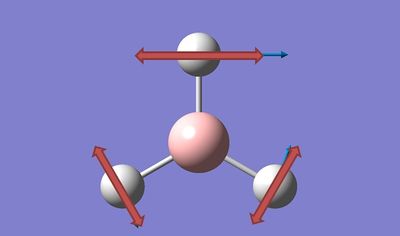
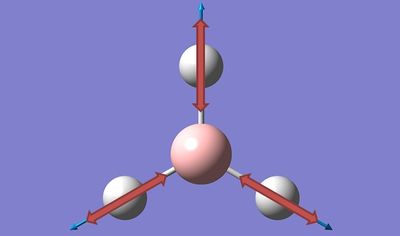
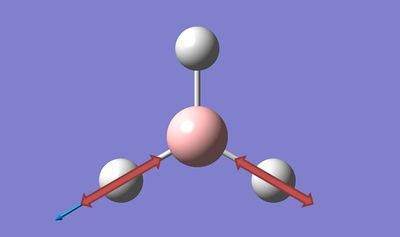
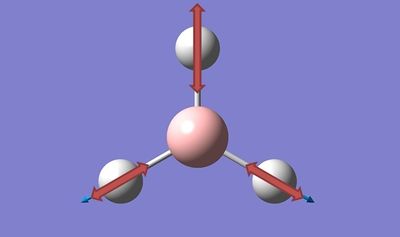
From the calculations, it is clear that there are 6 different vibrational motions for the BH3 molecule. However, looking at the IR spectrum generated above there are only 3 peaks visible. This is because vibration 2 and 3 have the same frequency and 5 and 6 have the same frequency so they are not observed as separate peaks. In addition vibration 4 has an intensity of 0 meaning that it doesn't show up on the spectrum. This occurs because for a compound to be IR active there needs to be a change in the dipole moment corresponding with the vibration. As Vibration 4 is completely symmetrical, there is no change in dipole moment and hence the transition is not observed by IR analysis.
Molecular Orbitals of BH3
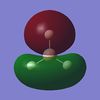
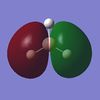
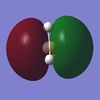
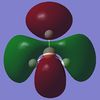
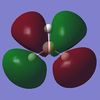
The optimised BH3 molecule was then submitted for MO analysis. This time an SP calculation was done, keeping the method (RB3LYP) the same. The basis set however was changed to 6-31G for this calculating which gives a slightly higher level of accuracy. However the energies obtained by the calculation here is no longer comparable to the optimised energy using the 3-21G basis set. The calculation was selected to do a full NBO analysis and the keywords "pop=full" were used to calculate the MOs. The completed population analysis can be found here: DOI:10042/to-9554 . The calculated MOs were visualised on Gaussview and those from HOMO-3 to LUMO+3 are shown below. The HOMO-3 corresponds with the 1s atomic orbital of the B atom. It can be seen that the unoccupied MOs are generally more diffuse than the occupied MOs and on further investigation, looking at the higher energy MOs their form can get increasingly odd.
 |
 |
 |
 |
 |
 |
 |
 |
The MO diagram below shows the Linear Combination of Atomic Orbitals for BH3 with the corresponding MO determined from the MO calculation. In general, the correlation between the two representations is good to a low level approximation. The most significant difference is in that the molecular orbitals, a bonding interaction results in a combining of the orbitals and an antibonding interaction results in a visible node, whereas in the LCAO representation, the orbitals retain their original shape and the interactions between orbitals on B and on H are less clear.
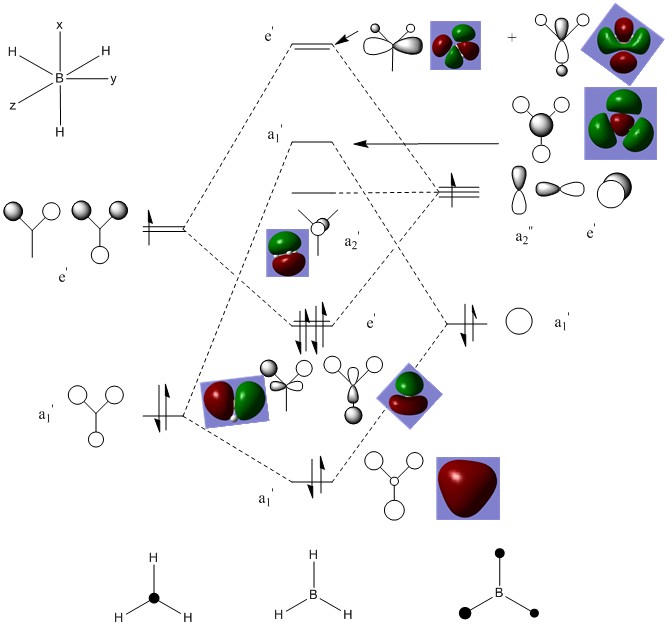
The 'real' MOs generated also give a much better idea of electron distribution across the whole molecule rather than isolated on individual atoms. Another main difference is the 'real' MOs show the distorting effect of antibonding interactions on the orbitals, especially in the LUMO+3 orbital where the LCAO equivalent implies that the orbitals of opposite phase can occupy the same area of space, a situation that would obviously be very high in energy and unfavoured. This qualitative MO picture provided by the MO analysis calculation is therefore very useful in observing the real bonding situation.
NBO analysis of BH3
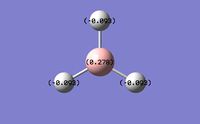

When the the MO calculation was run, a full NBO analysis of the BH3 molecule was also requested.
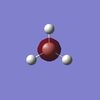
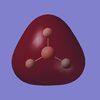
On viewing the molecule in Gaussview, showing the charge distribution, the Lewis basic hydrogen atoms are coloured red and the Lewis acidic boron atom is coloured green. This shows in a qualitative way that the H atoms are negatively charged and the B atom is positively charged. The NBO charges are show on the image to the left. The charges on the H atoms was calculated to be -0.093 and the charge on the B atom was 0.278 giving an overall neutral molecule.
Within the Gaussian output file, the Summary of Natural Population Analysis give these values to a greater accuracy as 0.27816 for B and -0.09272 for H. It also gives the valency of the atoms as 2.72 for B and 1.09 for H. This implies that the bond order in BH3 is slightly greater than 1 for H and slightly less that 3 for B.
 Summary of Natural Population Analysis:

                                       Natural Population
                Natural  -----------------------------------------------
    Atom  No    Charge         Core      Valence    Rydberg      Total
 -----------------------------------------------------------------------
      B    1    0.27816      1.99954     2.72230    0.00000     4.72184
      H    2   -0.09272      0.00000     1.09256    0.00015     1.09272
      H    3   -0.09272      0.00000     1.09256    0.00015     1.09272
      H    4   -0.09272      0.00000     1.09256    0.00015     1.09272
 =======================================================================
   * Total *    0.00000      1.99954     6.00000    0.00046     8.00000
Looking further, the Bond orbital/ Coefficients/ Hybrids section in the output file gives a more detailed picture of the bonding in BH3.
     (Occupancy)   Bond orbital/ Coefficients/ Hybrids
 ---------------------------------------------------------------------------------
     1. (1.99854) BD ( 1) B   1 - H   2
                ( 45.36%)   0.6735* B   1 s( 33.33%)p 2.00( 66.67%)
                                            0.0000  0.5774  0.0000  0.0000  0.0000
                                            0.8165  0.0000  0.0000  0.0000
                ( 54.64%)   0.7392* H   2 s(100.00%)
                                            1.0000  0.0001
     2. (1.99854) BD ( 1) B   1 - H   3
                ( 45.36%)   0.6735* B   1 s( 33.33%)p 2.00( 66.67%)
                                            0.0000  0.5774  0.0000  0.7071  0.0000
                                           -0.4082  0.0000  0.0000  0.0000
                ( 54.64%)   0.7392* H   3 s(100.00%)
                                            1.0000  0.0001
     3. (1.99854) BD ( 1) B   1 - H   4
                ( 45.36%)   0.6735* B   1 s( 33.33%)p 2.00( 66.67%)
                                            0.0000  0.5774  0.0000 -0.7071  0.0000
                                           -0.4082  0.0000  0.0000  0.0000
                ( 54.64%)   0.7392* H   4 s(100.00%)
                                            1.0000  0.0001
     4. (1.99954) CR ( 1) B   1           s(100.00%)
                                            1.0000  0.0000  0.0000  0.0000  0.0000
                                            0.0000  0.0000  0.0000  0.0000
     5. (0.00000) LP*( 1) B   1           s(100.00%)
The first bond (BD) is between the Boron atom (1) and H atom (2). The figures show that the B-H bond is 45.36% contributed from the B atom and 54.64% from the H. The B orbital contribution is 33.33% s and 66.67% p, indicating an sp2 hybridised orbital while the H contribution is 100% s. Bond two and three above also show the same distribution, showing the Boron forms 3 sp2 hybridised orbitals which have a bonding interaction with the H 1s orbitals. Orbital 4 shows the core (CR) 1s non-bonding orbital of Boron while orbital 5 represents the lone pair orbital (LP) of boron which is unoccupied.
The section titled "Second Order Perturbation Theory Analysis of Fock Matrix in NBO Basis" shows the significant mixing effects between molecular orbitals.
Second Order Perturbation Theory Analysis of Fock Matrix in NBO Basis

     Threshold for printing:   0.50 kcal/mol
                                                                              E(2)  E(j)-E(i) F(i,j)
         Donor NBO (i)                     Acceptor NBO (j)                 kcal/mol   a.u.    a.u.
 ===================================================================================================

 within unit  1
   4. CR (   1) B   1                / 10. RY*(   1) H   2                    0.70    7.42    0.064
   4. CR (   1) B   1                / 11. RY*(   1) H   3                    0.70    7.42    0.064
   4. CR (   1) B   1                / 12. RY*(   1) H   4                    0.70    7.42    0.064
Since for BH3, none of the values in the E(2) column are greater than 20kcal/mol, they are not of interest in this case.
Structural Analysis of TlBr3
TlBr3 optimisation
Since TlBr3 is composed of heavy atoms, Tl which has 81 electrons and Br which has 35, the structure and behaviour cannot be modelled without using a pseudo-potential. This allows the core electrons to be modelled in a general way and relies on the assumption that it is the valence electrons that are responsible for the bonding interactions. Without using a pseudo-potential, the calculations become to complicated. Before optimisation, the symmetry of the molecule was set to be trigonal planar D3h and the tolerance reduced so that it was very tight (within 0.0001).
The optimisation was done with an FOPT calculation using the RB3LYP method. The basis set used was LanL2DZ. This is a medium level basis set which is not as accurate as others but meant that the calculation wouldn't take too long. The completed TlBr3 optimisation file can be found here: DOI:10042/to-9749
TlBr optimised structure |
The optimised Tl-Br bond length was found to be 2.65Å and the optimised Br-Tl-Br bond angle was found to be 120.0o. The Tl-Br bond length for TlBr is reported as 2.6182Å in literature[1] This is smaller than that obtained by calculation but is quite close and with the addition of two more Br it is expected that the Tl-Br bonds will be weaker than that where Tl is bonded to a single Br and hence they will be longer. The energy of the optimised molecule was -91.218a.u. and the RMS Gradient Norm was just 0.00000090a.u. The optimised molecule, as would be expected from the symmetry, did not have a dipole moment and had a D3h point group. The job cpu time was 38seconds.
TlBr3 frequency analysis
The optimised structure was submitted to frequency analysis using the same method and basis set. This is important as if the basis set and method is different, the parameters set for the calculations are different which means that they cannot be compared. The frequency analysis means that it can be confirmed that the optimised structure is at a minimum rather than a transition state or is non-optimised. The energy of the frequency analysis output was identical to that from the optimisation calculation which confirms that the optimised structure remains. The relevant section of teh output file is shown below:
Low frequencies ---   -3.4213   -0.0026   -0.0004    0.0015    3.9367    3.9367
 Low frequencies ---   46.4289   46.4292   52.1449
 Harmonic frequencies (cm**-1), IR intensities (KM/Mole), Raman scattering
 activities (A**4/AMU), depolarization ratios for plane and unpolarized
 incident light, reduced masses (AMU), force constants (mDyne/A),
 and normal coordinates:
                     1                      2                      3
                    E'                     E'                     A2"
 Frequencies --    46.4289                46.4292                52.1449
 Red. masses --    88.4613                88.4613               117.7209
 Frc consts  --     0.1124                 0.1124                 0.1886
 IR Inten    --     3.6867                 3.6867                 5.8466
  Atom  AN      X      Y      Z        X      Y      Z        X      Y      Z
     1  81     0.00   0.28   0.00    -0.28   0.00   0.00     0.00   0.00   0.55
     2  35     0.00   0.26   0.00     0.74   0.00   0.00     0.00   0.00  -0.48
     3  35     0.43  -0.49   0.00    -0.01  -0.43   0.00     0.00   0.00  -0.48
     4  35    -0.43  -0.49   0.00    -0.01   0.43   0.00     0.00   0.00  -0.48
                     4                      5                      6
                    A1'                    E'                     E'
 Frequencies --   165.2685               210.6948               210.6948
 Red. masses --    78.9183               101.4032               101.4032
 Frc consts  --     1.2700                 2.6522                 2.6522
 IR Inten    --     0.0000                25.4830                25.4797
  Atom  AN      X      Y      Z        X      Y      Z        X      Y      Z
     1  81     0.00   0.00   0.00     0.42   0.00   0.00     0.00   0.42   0.00
     2  35     0.00  -0.58   0.00     0.01   0.00   0.00     0.00  -0.74   0.00
     3  35     0.50   0.29   0.00    -0.55  -0.32   0.00    -0.32  -0.18   0.00
     4  35    -0.50   0.29   0.00    -0.55   0.32   0.00     0.32  -0.18   0.00
All the frequencies obtained are positive which confirms that the structure is at a minimum. The low frequencies for TlBr3 are -3.4213, -0.0026cm-1, -0.0004cm-1, 0.0015cm-1, 3.9367cm-1 and 3.9367cm-1. The lowest 'real' frequency is 46cm-1. This is about 10 times larger than the largest low frequency value so comparatively they are small.
Gaussview and bonds
In some structures Gaussview does not draw the bonds as expected. This is due to the limitations of Gaussview as a program to visualise calculation output data. It has an internal list of bond distances which means that if the calculated bond distance is outside these limits set by the program, Gaussview does not put them in. The bond distances used for this approximation are typically suitable for work with organic compounds, however, inorganic compounds have a much wider range of bond distance due to the increasing size of atoms allowed and the wider range of bonding types used. Although a bond is not provided in the visualisation, this does not mean that the bonds don't exist. Bonds are favourable interactions between orbitals on the constituent atoms that contain electrons.
Isomers of Mo(CO)4(PCl3)2
The cis- and trans- isomers of Mo(CO)4(PCl3)2 are compared in terms of relative energy and also in terms of their vibrational spectra.
Optimisation of cis- and trans- Mo(CO)4(PCl3)2
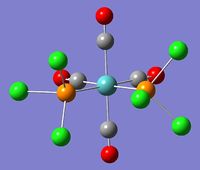
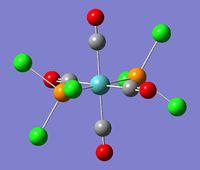
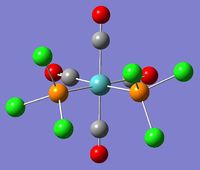
The optimisation for both the isomers was achieved in 2 steps.
Firstly a low level calculation was run using the B3LYP method and the LanL2MB basis set. In order to do this loose convergence criteria had to be used as otherwise the limits set would be more accurate than the method used and the calculation may not have converged. The limits were adapted by using the keywords "opt=loose". The results of the initial optimisation for the cis-isomer are here:DOI:10042/to-9761 and the trans-isomer are here:DOI:10042/to-9762 (see top left for cis-isomer structure and top right for trans-isomer).
The low level optimisation is expected to supply reasonable values for the bond lengths and angles but is less reliable when it comes to dihedral angles and rotation around the Mo-P bond, which implies that although a minimum may have been reached it is not necessarily the global minimum. From the low level optimisation, the cis-isomer had the slightly lower energy of -617.525a.u. compared with -617.522a.u.for the trans-isomer. The cis-isomer also had a large dipole moment of 8.47Debye whereas the trans-isomer did not have a dipole moment at all. The point group for both the isomers was C1
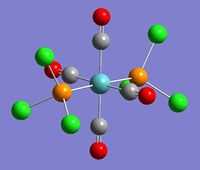
Both molecules were re-optimised using given data for the optimum structures. For the cis-isomer, one phosphine group was rotated so that a Cl was pointing up along the axial OC-Mo-CO bond and the other rotated so that a Cl was pointing down. For the trans-isomer, the phosphine groups were rotated so that they both had a Cl pointing along an Mo-CO bond and were eclipsed. This time the LanL2DZ pseudo-potential was used and the convergence criteria were narrowed using the keywords "int=ultrafine scf=conver=9".The results of the cis-reoptimisation can be found here: DOI:10042/to-9763 and the trans-reoptimisation can be found here: DOI:10042/to-9764 (see bottom left for cis-isomer structure and bottom right for trans-isomer).


After the second optimisation calculation, the cis-isomer was found to have an energy of -623.577a.u., again slightly lower than that for the trans isomer which had an energy of -623.576a.u. The cis-isomer again had a dipole moment, smaller than before, of 1.31Debye, however in contrast to the initially optimised trans-isomer after the reoptimisation it did have a dipole moment of 0.30Debye. This implies that in the reoptimisation, the molecule became less symmetrical so that the electron density of the molecule was no longer evenly distributed. This can be seen if the two trans- structures are viewed down the P-Mo-P bond (left). The point group for both the isomers remained C1.
In literature, the value given for the length of the Mo-P bond in cis- [Mo(PPh3)2(CO)4] is 2.577Å and the P-Mo-P angle is given as 104.62o.[2] In the optimised cis-structure calculated here, the Mo-P bond lengths are 2.51Å which is significantly shorter but still in a similar range. The P-Mo-P angle calculated is 94.2o. The bond angle found is closer to that found when the phosphine ligand in the complex is PPhMe2 (94.78o). This can be attributed to the steric bulk of the triphenylphosphine group. When the PPh3 ligands have been replaced by Cl as we have done here, then the phosphines are less bulky and so can be closer together. In the cis-structure overall, the cis-ligand bond angles range from 87.1o to 94.2o
A literature value given for the Mo-P bond length in trans-[Mo(P(OMe)3)2(CO)4) is 2.4256Å and the angles of cis-ligands around the Mo are reported to be in the range 86.7-93.3o.[3] Another source quoted a Mo-P bond length of 2.500Å for trans-[Mo(PPh3)2(CO)4] and angles between cis-ligands as between 87.2 and 92.1o.[4] In the optimised trans-structure obtained, the Mo-P bond lengths were calculated to be 2.44Å which falls within the range suggested by literature. The bond angles were found to be between 88.9o and 91.3o which again falls well within the range given in the literature. The calculated angles for [Mo(PCl3)2(CO)4] are closer to the ideal 90o angle of a perfectly octahedral structure than the literature values as the phoshine groups are less bulky and cause less distortion to the structure. The range is also smaller than for the cis-isomer as the phosphine groups are further apart so there is no steric clash between the two large substituents.
Frequency analysis
The frequency analysis was completed with the same method and basis set as the final optimisation, retaining the keywords "int=ultrafine scf=conver=9".
Looking at the results of the frequency analysis, neither of the isomers produced any negative frequencies which confirms that the optimised structures achieved are at a minimum. The low frequencies for the cis-isomer were -1.7903cm-1, -0.0009cm-1, -0.0007cm-1, -0.0007cm-1, 1.0022cm-1 and 1.4929cm-1. Since the lowest frequency vibration is at 10.76cm-1 then these low frequencies are actually rather large. However, the low frequency vibrations have a very small intensity and so are not very significant.
There are 45 different vibrational modes recorded for the cis-isomer of which the first with any significant intensity is no. 22 at 235cm-1, with an intensity of 12.8 this corresponds with a symmetrical Mo-P bond stretch. No. 23 at 236cm-1, with intensity 28.8, corresponds with the asymmetrical Mo-P bond stretch. The vibration at 378cm-1, no. 24 with intensity of 11.5 corresponds to an asymmetric Mo-C-O bending motion. Vibration no. 29 at 408cm-1, has an intensity of 273.9 and is a asymmetric stretch of the equatorial Mo-P and Mo-C bonds. No. 32 with intensity, 76.6 at 425cm-1 has a very similar motion. Vibration 32 with intensity 241.3, is the corresponding symmetrical stretch. At 436.8cm-1 is the no. 34 vibration which displays an Mo-C-O axial bending movement. The vibration at 597cm-1 is the symmetrical Mo-C-O bending motion. The characteristic absorptions for the cis-isomer are the two C=O stretches. The vibration with the largest intensity is the axial C=O asymmetrical stretch at 1948cm-1, while the equatorial C=O stretch is found at slightly lower wavenumbers, 1945cm-1. The vibration at1958cm-1 is the asymmetric stretch of all 4 C=O bonds while at 2023cm-1 is the peak for the symmetrical stretching motion of all 4 C=O bonds.
There are also 45 vibrational modes for the trans-isomer. However due to the increased symmetry of the molecule, there are fewer peaks observed on the spectrum. Vibrational mode 22, the symmetrical Mo-P stretch has a very small intensity as it does not result in a significant change in dipole moment. However, the asymmetric stretch, no. 23 at 252cm-1has an intensity of 37.6. As in the cis-isomer, the no. 24 corresponds to an asymmetric Mo-C-O bond bend although in the trans-isomer, the intensity is very small and at a lower frequency of 346cm-1. At 401cm-1, no. 29 is the asymmetric stretch of all 4 axial Mo-C bonds. In the cis-isomer, this vibration was due to the two axial Mo-C bond ands the two axial Mo-P bonds. For the trans-isomer, the characteristic C=O stretches are found at higher wavenumbers than in the cis-isomer. The highest intensity stretch is the asymmetric stretch of two of two trans-C=O bonds at 1950cm-1, the asymmetric stretch for the other two C=O bonds is only slightly less intense and is slightly higher in frequency at 1951cm-1. As with the cis-isomer, there are also higher frequency stretches for all four C=O bonds together, the asymmetric stretch being at 1977cm-1 and the symmetrical stretch being at 2031cm-1.
The vibrations observed in the optimised structures can be compared with experimental IR data for [Mo(PPh3)2(CO)4)from the second year synthesis lab:![]() Lab report from Experiment 4S of Year 2 Spring Term Synthesis Labs
Lab report from Experiment 4S of Year 2 Spring Term Synthesis Labs![]()
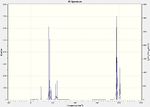
The experimentally obtained IR spectrum for the cis-isomer had two clear peaks that were attributed to C=O stretching frequencies. One was a very broad peak at 1889.6cm-1 and the other was a sharp peak at 2013.2cm-1. This broad beak was due to vibrations of similar frequencies overlapping in the spectrum, and looking at the results for the modeled cis-[Mo(PCl3)2(CO)4)these peaks seem to correspond with the four C=O stretches at 1945cm-1, 1948cm-1, 1958cm-1 and 2023cm-1. The first three of these stretches are close in frequency so appear as one peak on the spectrum(see left)whereas the fourth stretch is at significantly higher wavenumbers and so shows up as an individual peak. The calculated vibrations are at higher frequencies than the experimental peaks.
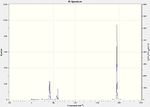
In the 'real' spectrum for the trans-isomer, there was only a single sharp C=O stretch observed at 1890cm-1. This corresponds with the C=O stretches calculated at 1950cm-1, 1951cm-1, 1977cm-1 and 2031cm-1. All the cis-isomer C=O vibrations have a significant intensity of over 500 whereas for the trans-isomer only the first two C=O vibrations have a significant intensity, hence only one peak is seen. The two vibrations that are observed are very close in frequency so appear as one peak on the spectrum calculated too (see right). This shows that the given reason in the 2nd Year lab for the two stretches in the cis- spectrum and one peak in the trans- spectrum is not due to the identical environments for CO in the trans-isomer as both isomers have all the same vibrational modes. It is instead due to the difference in symmetry meaning that fewer modes are observed in the spectrum for the trans-isomer.
Mini Project
In this mini project, investigations will be made into the bonding and stability of N2F2 molecules. The cis- and trans- isomers will be compared and they will also be compared with P2F2. Although P is in the same group as N, the bonding properties are expected to be significantly different due to the additional d-orbital contribution that is present.
Optimisation
The calculations for all optimisations was of FOPT type. The method and basis set used for all the optimisation calculations was B3LYP, 6-311G. As there are no heavy atoms in the molecules being investigated, a pseudo potential is not required and a high level basis set can be used without slowing down the calculations too much.
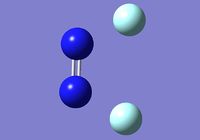
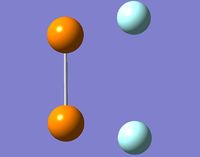
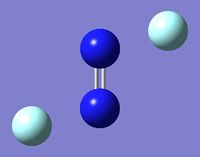
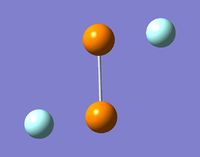
Following the optimisations, the N-F bonds in both cis- and trans- N2F2 vanished showing that the bond length are outside the usual parameters.
After optimisation, the energies of the two isomers was found to be very similar, although the cis-isomer was found to be marginally lower in energy and hence more stable. This agrees with what is found in literature[5]. As would be expected, the cis-isomer possessed a dipole moment due to the two F atoms pointing in the same direction, while the trans-isomer which has one F atom pointing in each direction, did not have a dipole moment. The N-F bond length was slightly longer in the cis-isomer which therefore correspondingly had a shorter N=N bond. The N=N bond lengths are noticeably shorter than the N-F bond lengths. Another significant difference between the two isomers is in the F-N-N bond angle. In cis-N2F2 it is much larger and closer to the ideal sp2 angle of 120o. However it is expected to be smaller than 120o due to the repulsive effect of the N lone pair. The difference between the cis- and trans- angles can be rationalised by considering that in the cis-form, the two F atoms are brought to the same side of the molecule, they therefore avoid being pushed too close together. In the trans-form, the two F atoms are on opposite sides of the molecule so don't experience this restriction.
When the P2F2 isomers were optimised, they not only lost their P-F bonds but also the P-P bond became single reather than double. This shows that they were outside normal parameters. Looking at the optimised values for P2F2 there are immediate differences from the N2F2 structure. The energies of the phosphorus compounds are
| ' | cis-N2F2 | trans-N2F2 |
| Calculation Type | FOPT | FOPT |
| Method | RB3LYP | RB3LYP |
| Basis Set | 6-311G | 6-311G |
| Energy | -309.02746254a.u. | -309.0184002a.u. |
| Gradient | 0.00012618a.u. | 0.00003686a.u. |
| Dipole Moment | 0.4594Debye | 0.00Debye |
| Point Group | C2v | C2h |
| N-F bond length | 1.4755Å | 1.46328Å |
| N-N bond length | 1.22306Å | 1.24213Å |
| F-N-N bond angle | 116.03045o | 104.54608o |
| Dihedral | 0o | 180o |
| ' | cis-P2F2 | trans-P2F2 |
| Calculation Type | FOPT | FOPT |
| Method | RB3LYP | RB3LYP |
| Basis Set | 6-311G | 6-311G |
| Energy | -882.39764845a.u. | -882.40216877a.u. |
| Gradient | 0.00020377a.u. | 0.00011696a.u. |
| Dipole Moment | 3.3796Debye | 0.00Debye |
| Point Group | C2v | C2h |
| P-F bond length | 1.74029Å | 1.75688Å |
| P-P bond length | 2.17560Å | 2.17565Å |
| F-P-P bond angle | 102.96185o | 94.38019o |
| Dihedral | 0o | 180o |
much higher than the nitrogen compounds, this is expected as the orbital overlap between the P and F atoms will not be as good since P is in the second row of the periodic table and F is in the first row. In the case of P2F2 it is the trans-isomer that is slightly lower in energy and expected to be the most stable. The cis-P2F2 has a much larger dipole moment than the corresponding nitrogen compound. This can be attributed to the fact that the phosphorus atoms are larger and more polarisable than the nitrogen atoms and therefore the electron density is more skewed leading to a greater dipole moment. The P-F bond length is larger than the N-F bond length, and in contrast to the nitrogen compound, it is slightly longer in the trans-isomer. The P-P bond is also slightly longer in the trans-isomer showing that both its P-F and P-P bonds are weaker and in contrast to the nitrogen compound it is longer than the P-F bonds. The F-P-P bond angles are much smaller in P2F2 with the cis-bond angle still being larger than the trans-.
Vibrational analysis
A vibrational analysis of the four molecules was carried out using the same method and basis set as for the optimisation. The Gaussian output files for these calculations can be found here: Cis-N2F2 (DOI:10042/to-9992 ), Trans-N2F2 (DOI:10042/to-9990 ), Cis-P2F2 (DOI:10042/to-9987 ), Trans-P2F2 (DOI:10042/to-9984 )
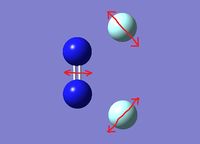
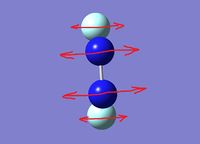
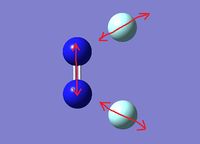
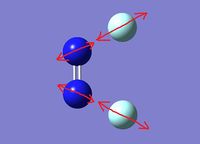
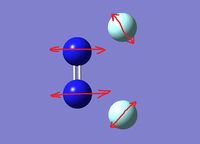
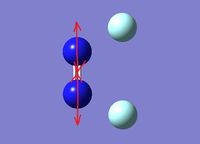
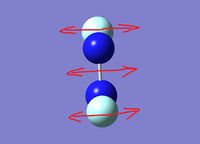
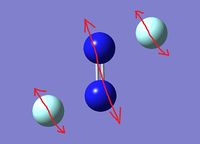
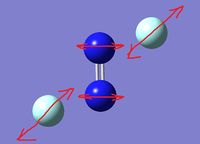
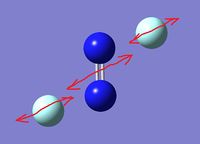
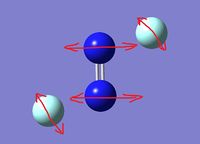
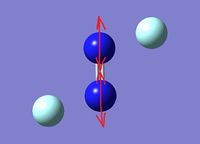
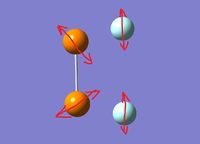
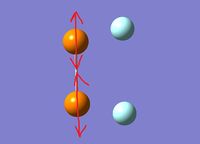
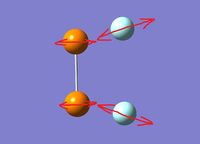
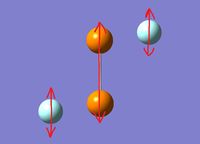
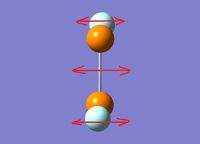
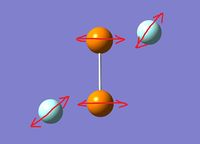
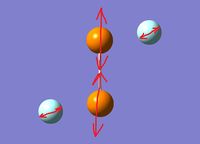
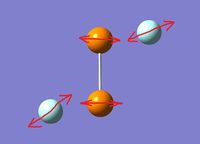
The tables below describe the vibrational motions: The spectrum for cis-N2F2 (right)shows 4 distinct peaks as well as a very low intensity peak at low frequency. The most intense peak corresponds with vibration number 3, described below which indicates that it corresponds with the largest change in dipole moment. There is a vibration listed of frequency 518cm-1 which does not appear on the spectrum as it has an intensity of 0. This is because to have an IR transition, there must be a change in dipole moment. As the movement of the atoms in vibration 2, does not cause a change in dipole moment there cannot be a transition. The peak at 1540cm-1 is the characteristic N=N stretching peak but in this case it is of very small intensity.
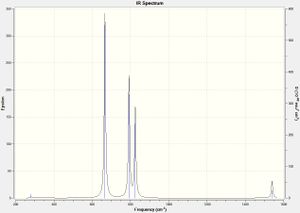
Looking at the spectrum for trans-N2F2 (right), it looks completely different. There are now only 3 peaks visible. While only one of the vibrational motions for the cis-isomer didn't result in an IR transition, 3 of the trans-isomers vibrational motions have an intensity of 0. The trans-isomer is generally more symmetrical than the cis-isomer and so it has fewer IR allowed transitions. The largest peak here is vibration 4. The expected characteristic N=N stretch at 1469 is not seen of the spectrum as it is a symmetrical motion and doesn't result in a change of dipole.
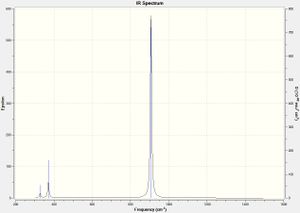
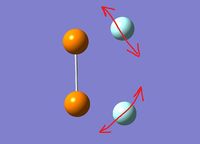
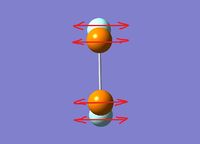
Like the spectrum for cis-N2F2, the spectrum for cis-P2F2 also shows 5 peaks, with only vibration 2 having an intensity of 0. Comparing with vibration 2 for cis-N2F2 it can be seen that it is the same motion in both molecules that results in no change of dipole occurring,. This is reasonable as they have very similar geometry. None of the other vibrational modes correspond as closely in both molecules. The characteristic absorption here is the P-P stretching frequency at 483cm-1, this is a fairly low intensity absorption here.
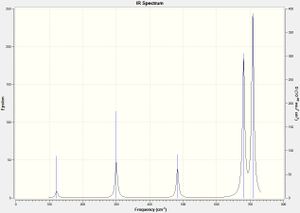
The IR spectrum for trans-P2F2 is also similar to that of the trans- nitrogen compound. It again only has 3 peaks as 3 are disallowed IR absorptions. The P-P stretch is not visible as it is disallowed.
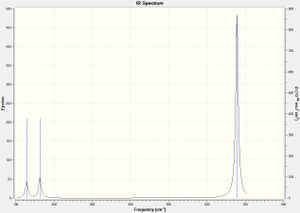
Comparing the IR spectra for all four molecules, there are some obvious similarities and differences. Both the IR spectra for cis-isomers show 5 peaks with two that are very close together. Both the trans-isomers produced spectra that have 3 peaks which are all isolated and do not overlap with any others. Generally the phosphorus compounds have lower frequency vibrations than the nitrogen compounds. This can be attributed to the increased molecular weight.
Molecular orbital analysis
The MO analysis for all the molecules was done using the same method and basis set as the previous calculations. The keywords "pop=full" were added to calculate the MOs and a full NBO analysis was also selected. Both the N2F2 isomers had 52 calculated molecular orbitals. The P2F2 isomers had 68 each.
The first 20 MOs of cis-N2F2 are shown below. The first 16 of these are occupied. Orbital 1 and 2 are the low lying 1s orbitals for F and orbitals 3 and 4 are the 1s orbitals for N. The linear combination of atomic orbitals for orbitals 5 to 20 are shown on the MO diagram below. Orbital 5 to 8 are the combination of the 2s orbitals from all the atoms, 5 is a totally bonding combination with no nodes. Orbital 6 is the antibonding equivalent with 1 node. In orbitals 5 and 6 the majority of the orbital contribution is from the F atoms. Orbital 7 is bonding between the N atoms and antibonding between N and F so there are two nodes. Orbital 8 is antibonding between all the atoms so there are 3 nodes. The majority of the orbital contribution in orbitals 7 and 8 is from the N atoms. This can be clearly seen in the shapes of the MOs generated. Orbital 9 is the bonding orbital generated from the sigma bonded fragment orbitals which is made up of the 2p orbitals of the N and F atoms. The orbital has 4 nodes and is bonding between the N and F atoms and between the two N atoms. Orbital 10 is of π symmetry with a bonding MO above and below the plane of the molecule and has one node. It is generated from p orbitals on the atoms orthogonal to the plane of the molecule. Orbital 11 also has one node and is due to the linear combination of π orbitals on the molecular fragments. The orbitals in this case are in the plane of the molecule and results in a bonding interaction around the outside and in the inside of the bent cis-structure. Orbital 12 is the antibonding combination of orbital 10. It can be clearly seen that the majority of the orbital contribution is from the F atoms. There are 3 nodes present. Likewise orbital 13 is the antibonding combination of orbital 11 and also shows the greater F contribution to the orbital. Orbital 14 is π bonding between the two N atoms and also has σ style bonding between the two F atoms. Orbital 15 is also π bonding between teh N atoms but there is no σ bonding element between the F atoms, this may explain why it is higher in energy as it has fewer favourable bonding interactions. MO 16 is the HOMO and has a small bonding interaction between the N and F atoms. It is made up of the same fragment orbitals as orbital 9. Orbital 17 is the LUMO and is bonding between the two N atoms and antibonding everywhere else. Orbitals 18 and 19 are made up of p AOs and areantibonding in all directions. Orbital 20 is the LUMO -3 and has a very large diffuse shape and is odd in form.
 |
 |
 |
 |
 |
 |
 |
 |
 |
 |
 |
 |
 |
 |
 |
 |
 |
 |
 |
 |
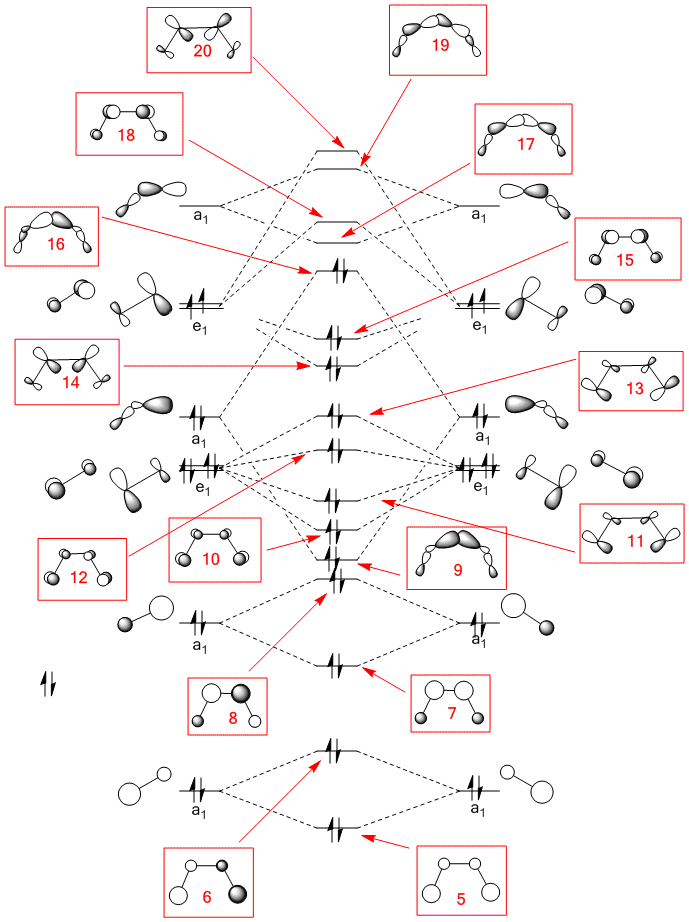
Below are also shown MOs 1-20 for the trans-N2F2 isomer. These orbitals are made from the same linear combination of atomic orbitals as above but applied to a trans- geometry. Pretty much all the orbitals seem to be in the same order in terms of energy as their counterparts for the cis- geometry apart from orbitals 10 and 11 which have swapped over.
 |
 |
 |
 |
 |
 |
 |
 |
 |
 |
 |
 |
 |
 |
 |
 |
 |
 |
 |
 |
Here also are the MOs for cis-P2F2 shown for comparison. the first 30 MOs are shown here. Orbitals 1 and 2 are very low lying orbitals which cannot be observed on the ball and bond type models used here. They are the 1s bonding and antibonding combination for the P atoms. Similarly orbitals 3 and 4 are made up of the F 1s orbitals. Orbitals 5 and 6 are the P 2s orbitals, interestingly for orbitals 3,4,5 and 6, the antibonding combination seems to be the lower in energy. However since there is not very good orbital overlap anyway, the energies are very close together and the combination of orbitals may not have an effect on the energy. Orbitals 7 to 12 show the 6 different bonding and antibonding combinations of the P 2p orbitals. Orbitals 13 and 14 show the bonding and antibonding combinations of the F 2s orbitals, while these are too low in energy for the 3s orbitals of P to interact with. In orbitals 15 and 16, the 3s orbitals of P interact with p orbitals on F to form the MOs. From MO 16 to 25 (the LUMO), the orbitals begin to look more like those for the cis-N2F2. Above the LUMO however, the orbitals starts taking very strange forms and become much more diffuse.
 |
 |
 |
 |
 |
 |
 |
 |
 |
 |
 |
 |
 |
 |
 |
 |
 |
 |
 |
 |
 |
 |
 |
 |
 |
 |
 |
 |
 |
 |
The trans-P2F2 isomer had similar orbitals to the cis-isomer but with trans-geometry guiding the overall bonding/antibonding nature as with the trans-N2F2 orbitals compared with its cis-isomer.
NBO analysis
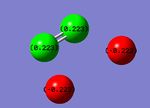

On viewing in Gaussview, the cis- and trans- isomers of N2F2 both showed the fluorine atoms as red, indicating negative charge and the nitrogen atoms as green indicating positive charge. This is as expected as F is more electronegative than N. Since the molecules are uncharged, the F atoms have an equal share of the negative charge and the N atoms have an equal share of the positive charge and overall the charge is 0. In the cis-isomer these are -0.223 and 0.223 respectively. In the trans-isomer the charges are smaller with the F and N atoms having -0.209 and 0.209 respectively.
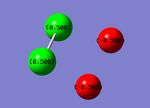
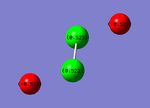
For the P2F2 isomers, the charge distribution was the same with F negatively charged and the P positively charged. Since P is more electropositive than N, the charge distribution is larger so in the cis-isomer, the F have a charge of -0.500 and P have a charge of 0.500. In the trans-isomer, the charges are larger, -0.523 and 0.523 respectively.
Looking at the output file for cis-N2F2, the NBO analysis section is headed:
******************************Gaussian NBO Version 3.1******************************
             N A T U R A L   A T O M I C   O R B I T A L   A N D
          N A T U R A L   B O N D   O R B I T A L   A N A L Y S I S
 ******************************Gaussian NBO Version 3.1******************************
Below this the Summary of natural population analysis gives the data already investigated above:
 Summary of Natural Population Analysis:

                                       Natural Population
                Natural  -----------------------------------------------
    Atom  No    Charge         Core      Valence    Rydberg      Total
 -----------------------------------------------------------------------
      N    1    0.22275      1.99955     4.75285    0.02485     6.77725
      N    2    0.22275      1.99955     4.75285    0.02485     6.77725
      F    3   -0.22275      1.99998     7.22085    0.00193     9.22275
      F    4   -0.22275      1.99998     7.22085    0.00193     9.22275
 =======================================================================
   * Total *    0.00000      7.99906    23.94739    0.05356    32.00000
The section describing the bonding in the compound gives 4 main bonding interactions:
  (Occupancy)   Bond orbital/ Coefficients/ Hybrids
 ---------------------------------------------------------------------------------
     1. (1.99952) BD ( 1) N   1 - N   2
                ( 50.00%)   0.7071* N   1 s(  0.00%)p 1.00(100.00%)
                                            0.0000  0.0000  0.0000  0.0000  1.0000
                                            0.0061  0.0006  0.0000  0.0000  0.0000
                                            0.0000  0.0000  0.0000
                ( 50.00%)   0.7071* N   2 s(  0.00%)p 1.00(100.00%)
                                            0.0000  0.0000  0.0000  0.0000  1.0000
                                            0.0061  0.0006  0.0000  0.0000  0.0000
                                            0.0000  0.0000  0.0000
     2. (1.99182) BD ( 2) N   1 - N   2
                ( 50.00%)   0.7071* N   1 s( 30.95%)p 2.23( 69.05%)
                                            0.0000 -0.5492 -0.0885 -0.0002  0.0000
                                            0.0000  0.0000  0.8186 -0.0444  0.0016
                                            0.1354  0.0123 -0.0016
                ( 50.00%)   0.7071* N   2 s( 30.95%)p 2.23( 69.05%)
                                            0.0000 -0.5492 -0.0885 -0.0002  0.0000
                                            0.0000  0.0000 -0.8186  0.0444 -0.0016
                                            0.1354  0.0123 -0.0016
     3. (1.96699) BD ( 1) N   1 - F   3
                ( 36.16%)   0.6013* N   1 s(  9.28%)p 9.78( 90.72%)
                                            0.0001 -0.3039 -0.0199  0.0009  0.0000
                                            0.0000  0.0000 -0.3492  0.0541  0.0029
                                            0.8843 -0.0162 -0.0117
                ( 63.84%)   0.7990* F   3 s(  8.98%)p10.14( 91.02%)
                                            0.0000 -0.2993  0.0131  0.0002  0.0000
                                            0.0000  0.0000  0.4178  0.0001 -0.0009
                                           -0.8577  0.0023  0.0027
     4. (1.96699) BD ( 1) N   2 - F   4
                ( 36.16%)   0.6013* N   2 s(  9.28%)p 9.78( 90.72%)
                                            0.0001 -0.3039 -0.0199  0.0009  0.0000
                                            0.0000  0.0000  0.3492 -0.0541 -0.0029
                                            0.8843 -0.0162 -0.0117
                ( 63.84%)   0.7990* F   4 s(  8.98%)p10.14( 91.02%)
                                            0.0000 -0.2993  0.0131  0.0002  0.0000
                                            0.0000  0.0000 -0.4178 -0.0001  0.0009
                                           -0.8577  0.0023  0.0027
The first bond described is between N(1) and N(2). This is made up of a 50% contribution from each N atom, which is a 100% p orbital contribution. This is describing an N=N π-bond. The second bond described is also between N(1) and N(2) and again has 50% contribution from each N atom. This time however for each N atom the contribution is made up of 30.95% s and 69.05% p. This is like an sp2 hybridised orbital but has slightly more p-orbital contribution. This is the N-N σ-bond. These show that there is a double bond between the two N atoms in the molecule. The third bond described is between N(1) and F(3). It is made up of a 36.16% contribution from N and a 63.84% contribution from F. The N contribution is 9.28% s character and 90.72% p character, the F contribution is 8.98% s character and 91.02% p character. The bonding here is therefore mostly p in character. The fourth bond described is between N(2) and F(4) and exactly the same as the third bond.
The bonding in the trans-isomer is described below:
   (Occupancy)   Bond orbital/ Coefficients/ Hybrids
 ---------------------------------------------------------------------------------
     1. (1.99956) BD ( 1) N   1 - N   2
                ( 50.00%)   0.7071* N   1 s(  0.00%)p 1.00(100.00%)
                                            0.0000  0.0000  0.0000  0.0000  0.0000
                                            0.0000  0.0000  0.0000  0.0000  0.0000
                                            0.9999  0.0136  0.0010
                ( 50.00%)   0.7071* N   2 s(  0.00%)p 1.00(100.00%)
                                            0.0000  0.0000  0.0000  0.0000  0.0000
                                            0.0000  0.0000  0.0000  0.0000  0.0000
                                            0.9999  0.0136  0.0010
     2. (1.99539) BD ( 2) N   1 - N   2
                ( 50.00%)   0.7071* N   1 s( 28.18%)p 2.55( 71.82%)
                                            0.0000  0.5219  0.0968  0.0000  0.5600
                                           -0.0113 -0.0004 -0.6348  0.0391 -0.0008
                                            0.0000  0.0000  0.0000
                ( 50.00%)   0.7071* N   2 s( 28.18%)p 2.55( 71.82%)
                                            0.0000  0.5219  0.0968  0.0000 -0.5600
                                            0.0113  0.0004  0.6348 -0.0391  0.0008
                                            0.0000  0.0000  0.0000
     3. (1.96376) BD ( 1) N   1 - F   4
                ( 35.74%)   0.5978* N   1 s(  9.10%)p 9.98( 90.90%)
                                           -0.0004  0.2987  0.0427 -0.0007  0.5766
                                            0.0110 -0.0094  0.7579 -0.0429 -0.0094
                                            0.0000  0.0000  0.0000
                ( 64.26%)   0.8016* F   4 s(  9.50%)p 9.53( 90.50%)
                                            0.0000  0.3079 -0.0121 -0.0002 -0.5234
                                            0.0043  0.0023 -0.7944 -0.0015  0.0023
                                            0.0000  0.0000  0.0000
     4. (1.96376) BD ( 1) N   2 - F   3
                ( 35.74%)   0.5978* N   2 s(  9.10%)p 9.98( 90.90%)
                                            0.0004 -0.2987 -0.0427  0.0007  0.5766
                                            0.0110 -0.0094  0.7579 -0.0429 -0.0094
                                            0.0000  0.0000  0.0000
                ( 64.26%)   0.8016* F   3 s(  9.50%)p 9.53( 90.50%)
                                            0.0000 -0.3079  0.0121  0.0002 -0.5234
                                            0.0043  0.0023 -0.7944 -0.0015  0.0023
                                            0.0000  0.0000  0.0000
The first bond, as in the cis-isomer is between N(1) and N(2) and has 50% contribution from each. Each contribution is again 100% p forming an N=N π-bond. Bond 2 again is between N(1) and N(2) and has 50% contribuion from each. This time they have a 28.18% s component and a 71.82% p component. In the trans-isomer therefore, there is a larger deviation from the expected sp2 hybridisation of the N orbitals. This explains why the N-N-F bond angle is much smaller( 104.54 compared with 116.02 in the trans-isomer than in the cis- as the hybridisation is less close to the ideal sp2 120o angle and closer to the sp3 ideal angle of 104.5o. Bonds three and four are again identical and are 35.74% N and 64.26% F. The N contribution is 9.10% s and 90.90% p while the F contribution is 9.50% s and 90.50% p.
The bonding in cis-P2F2
       (Occupancy)   Bond orbital/ Coefficients/ Hybrids
 ---------------------------------------------------------------------------------
     1. (1.99968) BD ( 1) P   1 - P   2
                ( 50.00%)   0.7071* P   1 s(  0.00%)p 1.00(100.00%)
                                            0.0000  0.0000  0.0000  0.0000  0.0000
                                            0.0000  0.0000  0.9989 -0.0462  0.0076
                                            0.0004  0.0000  0.0000  0.0000  0.0000
                                            0.0000  0.0000  0.0000  0.0000  0.0000
                                            0.0000
                ( 50.00%)   0.7071* P   2 s(  0.00%)p 1.00(100.00%)
                                            0.0000  0.0000  0.0000  0.0000  0.0000
                                            0.0000  0.0000  0.9989 -0.0462  0.0076
                                            0.0004  0.0000  0.0000  0.0000  0.0000
                                            0.0000  0.0000  0.0000  0.0000  0.0000
                                            0.0000
     2. (1.97820) BD ( 2) P   1 - P   2
                ( 50.00%)   0.7071* P   1 s(  9.06%)p10.04( 90.94%)
                                            0.0000  0.0000 -0.2960 -0.0549 -0.0018
                                            0.0001  0.0000  0.0000  0.0000  0.0000
                                            0.0000  0.0000  0.9465  0.0450 -0.0109
                                            0.0022  0.0000 -0.1042  0.0241  0.0012
                                           -0.0009
                ( 50.00%)   0.7071* P   2 s(  9.06%)p10.04( 90.94%)
                                            0.0000  0.0000 -0.2960 -0.0549 -0.0018
                                            0.0001  0.0000  0.0000  0.0000  0.0000
                                            0.0000  0.0000 -0.9465 -0.0450  0.0109
                                           -0.0022  0.0000 -0.1042  0.0241  0.0012
                                           -0.0009
     3. (1.99261) BD ( 1) P   1 - F   3
                ( 20.32%)   0.4508* P   1 s(  7.54%)p12.26( 92.46%)
                                            0.0000 -0.0001 -0.2565 -0.0979  0.0020
                                           -0.0002  0.0000  0.0000  0.0000  0.0000
                                            0.0000  0.0001 -0.1858 -0.0383 -0.0085
                                            0.0006  0.0001 -0.9398 -0.0717 -0.0105
                                            0.0054
                ( 79.68%)   0.8926* F   3 s( 13.43%)p 6.45( 86.57%)
                                            0.0000 -0.3663 -0.0088  0.0002  0.0000
                                            0.0000  0.0000  0.2172  0.0032  0.0006
                                            0.9047  0.0043 -0.0012
     4. (1.99261) BD ( 1) P   2 - F   4
                ( 20.32%)   0.4508* P   2 s(  7.54%)p12.26( 92.46%)
                                            0.0000 -0.0001 -0.2565 -0.0979  0.0020
                                           -0.0002  0.0000  0.0000  0.0000  0.0000
                                            0.0000 -0.0001  0.1858  0.0383  0.0085
                                           -0.0006  0.0001 -0.9398 -0.0717 -0.0105
                                            0.0054
                ( 79.68%)   0.8926* F   4 s( 13.43%)p 6.45( 86.57%)
                                            0.0000 -0.3663 -0.0088  0.0002  0.0000
                                            0.0000  0.0000 -0.2172 -0.0032 -0.0006
                                            0.9047  0.0043 -0.0012
Bond 1 in the ci-P2F2 isomer is similar to that for the N2F2 molecules. It is between P(1) and P(2) and has 50% contribution from each. Both contributions are 100% p in character so a π-bond is formed. Bond 2 is still between P(1) and P(2) and each supplies 50% on the contribution. However each contribution this time is made up of just 9.06% s character and 90.94% p character. The bond is therefore much more like a sigma bond between two p orbitals. The bond angle for the P-P-F here was 102.96o which is smaller and closer to the ideal p orbital angle of 90o. Bonds 3 and 4 have a smaller P contribution than the N contribution in N2F2, this is due to the overlap not being as good since P is a larger and more diffuse atom. The P contribution in both is 20.32% and the F contribution is 79.68%. The P contribution is 7.54% s and 92.46% p while the F contribution is 13.43% s and 86.57% p.
Comparing with the trans-isomer below:
  (Occupancy)   Bond orbital/ Coefficients/ Hybrids
 ---------------------------------------------------------------------------------
     1. (1.99984) BD ( 1) P   1 - P   2
                ( 50.00%)   0.7071* P   1 s(  0.00%)p 1.00(100.00%)
                                            0.0000  0.0000  0.0000  0.0000  0.0000
                                            0.0000  0.0000  0.0000  0.0000  0.0000
                                            0.0000  0.0000  0.0000  0.0000  0.0000
                                            0.0000  0.0000  0.9989 -0.0461  0.0055
                                            0.0005
                ( 50.00%)   0.7071* P   2 s(  0.00%)p 1.00(100.00%)
                                            0.0000  0.0000  0.0000  0.0000  0.0000
                                            0.0000  0.0000  0.0000  0.0000  0.0000
                                            0.0000  0.0000  0.0000  0.0000  0.0000
                                            0.0000  0.0000  0.9989 -0.0461  0.0055
                                            0.0005
     2. (1.98492) BD ( 2) P   1 - P   2
                ( 50.00%)   0.7071* P   1 s(  8.34%)p10.99( 91.66%)
                                            0.0000  0.0000  0.2831  0.0569  0.0018
                                           -0.0001  0.0000  0.5715 -0.0034 -0.0052
                                            0.0016  0.0000 -0.7664 -0.0506  0.0077
                                           -0.0015  0.0000  0.0000  0.0000  0.0000
                                            0.0000
                ( 50.00%)   0.7071* P   2 s(  8.34%)p10.99( 91.66%)
                                            0.0000  0.0000  0.2831  0.0569  0.0018
                                           -0.0001  0.0000 -0.5715  0.0034  0.0052
                                           -0.0016  0.0000  0.7664  0.0506 -0.0077
                                            0.0015  0.0000  0.0000  0.0000  0.0000
                                            0.0000
     3. (1.99358) BD ( 1) P   1 - F   3
                ( 19.71%)   0.4440* P   1 s(  6.49%)p14.41( 93.51%)
                                            0.0000  0.0000 -0.2365 -0.0947  0.0021
                                           -0.0002  0.0001 -0.7272 -0.0449 -0.0051
                                            0.0040  0.0001 -0.6321 -0.0678 -0.0130
                                            0.0030  0.0000  0.0000  0.0000  0.0000
                                            0.0000
                ( 80.29%)   0.8960* F   3 s( 13.19%)p 6.58( 86.81%)
                                            0.0000 -0.3631 -0.0098  0.0002  0.6965
                                            0.0022 -0.0011  0.6188  0.0061  0.0005
                                            0.0000  0.0000  0.0000
     4. (1.99358) BD ( 1) P   2 - F   4
                ( 19.71%)   0.4440* P   2 s(  6.49%)p14.41( 93.51%)
                                            0.0000  0.0000  0.2365  0.0947 -0.0021
                                            0.0002  0.0001 -0.7272 -0.0449 -0.0051
                                            0.0040  0.0001 -0.6321 -0.0678 -0.0130
                                            0.0030  0.0000  0.0000  0.0000  0.0000
                                            0.0000
                ( 80.29%)   0.8960* F   4 s( 13.19%)p 6.58( 86.81%)
                                            0.0000  0.3631  0.0098 -0.0002  0.6965
                                            0.0022 -0.0011  0.6188  0.0061  0.0005
                                            0.0000  0.0000  0.0000
As expected, the first bond for the trans isomer is also a 100% p π-bond. The second bond however is from 50:50 contribution of both P atoms and has 8.34% s character and 91.66% p character. This explains why the trans-isomer for P2F2 has the smallest P-P-F bond angle of only 94.38o. Bonds three and four again has less P contribution being 19.71% compared with 80.29% from the F atoms. the s character of these bonds is 6.49% while the p character is 93.51%.
References
- ↑ CRC Handbook of Chemistry and Physics, 92nd Ed., 2011-2012, 9,30, http://www.hbcpnetbase.com//articles/09_02_89.pdf
- ↑ E. C. Alyea, G. Ferguson, J. F. Gallagher, S. Song, Acta. Cryst., 1994, C50, 1084-1087
- ↑ N. R. Champness, A. M. Hopkins, G. Reid, Acta. Cryst., 1996, C52, 797-799
- ↑ G. Hogarth, T. Norman, Inorg. Chimica Acta, 1997, 254, 167-171
- ↑ K. O. Christe, D. A. Dixon, D. J. Grant, R. Haiges, F. S. Tham, A. Vij, V. Vij, T-H. Wang, W. W. Wilson, Inorg. Chem., 2010, 49, 6823-6833 DOI:10.102/ic100471s

