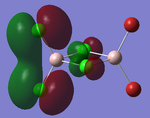
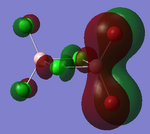
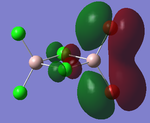
Rep:Mod:mtr09mod2
3rd Year Computational Chemistry Project - Matthew Reynolds
Module 2 - Bonding (Ab initio and density functional molecular orbital)
Molecular Orbital analysis of BH3 using Computational Chemistry
Introduction
As shown in Module 1, computational chemistry can act as a versatile tool for any chemist. It was shown to not just be able to predict Infrared and 13C Nuclear Magnetic Resonance spectra of an intermediate to within a reasonable degree of accuracy, but also provide detailed information regarding the energetic interactions within any organic molecule under analysis.
This module aims to demonstrate how computational chemistry is not just limited to organic [carbon containing] molecules, but can also be applied to inorganic and metal-based systems. It was reported recently that computational methods were responsible for the design of cheaper catalysts in the removal of ethyne from streams of ethylene gas[1]. Inorganic molecules are somewhat more interesting than their organic counterparts as phenomena such as co-ordinate bonds and multi-centre bonding is frequently observed in the cases of metal-ligand complexes and borane clusters respectively.
During this module, the Gaussian 09 program was used to optimise structures, determine vibrational modes, predict the Molecular Orbtials (MO's) and estimate the charge distribution on several molecules.
Prior to discussing the results of such optimisation calculations, an insight into how a molecule is optimised is required. Under the conditions of the Born-Oppenheimer approximation (nuclear motion is effectively static with respect to electronic motion), the Schrödinger equation is solved to determine the Total Energy of a given molecule with an internuclear distance 'x', E(x). This distance is then altered by a very small amount (x ± δx) and is subjected to the Schrödinger equation again, to determine its total energy at this new position, E(x ± δx). The program compares these two energies, with the lower of the two becoming the starting point for the next Energy calculation (iteration). This process is repeated until the internuclear separation which produces the lowest value of Energy is determined (the optimised structure). For every iteration in this procedure, the Root Mean Square (RMS) gradient of the total energy curve is determined. There are three cases which can cause the gradient to be 0, the desired energy minimum for the resting state of the molecule, the energy maxima transition state of the molecule, and if there is a point of inflection present. Taking the second derivative of this curve, however, provides further information into the nature of the zero gradient region. A positive value of the second derivative corresponds to the desired energy minimum, whilst if the second derivative is either negative or zero, then you have an unwanted energy maxima or a point of inflection.
Computational Analysis of BH3
Optimisation analysis results for BH3
A molecule of borane [trigonal planar BH3], with the B-H bonds lengthened to 1.5A, was drawn on Gaussview 5.0. This molecule was subject to optimisation under a B3LYP method, using a 3-21G basis set. A 3D image of the optimised form can be viewed by clicking the link provided:
The results of this optimisation are detailed in the referenced LOG[2] file. A summary of the results are shown below:
Optiomisation_Bh3
File Name = log_50138
File Type = .log
Calculation Type = FOPT
Calculation Method = RB3LYP
Basis Set = 3-21G
Charge = 0
Spin = Singlet
E(RB3LYP) = -26.46226338 a.u.
RMS Gradient Norm = 0.00020662 a.u.
Imaginary Freq =
Dipole Moment = 0.0000 Debye
Point Group = D3H
Job cpu time:  0 days  0 hours  0 minutes 4.3 seconds.
The optimised B-H bond length was determined to be 1.19Å. Furthermore, the optimised H-B-H bond angle was also found to be 120o. This is in agreement with the literature[3], [4]. The dipole moment of the BH3 molecule was determined to be 0 Debye, which is due to the high symmetry of the point group the molecule belongs to (D3h). This point group informs us that BH3 has 2C3 and 3C'2 rotational axes, a σh and 3σv mirror planes and 2S3 improper rotational axes.
The output data from the LOG file confirms all the parameters have converged:
     Item               Value     Threshold  Converged?
 Maximum Force            0.000413     0.000450     YES
 RMS     Force            0.000271     0.000300     YES
 Maximum Displacement     0.001643     0.001800     YES
 RMS     Displacement     0.001076     0.001200     YES
 Predicted change in Energy=-1.018634D-06
 Optimization completed.
    -- Stationary point found.
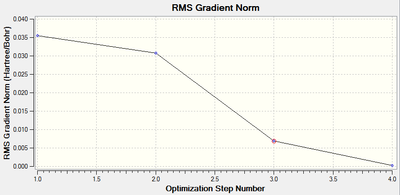
It should be noted that the root mean squared gradient for the force (the parameter that is minimised upon optimisation) has decreased below 0.001, which indicates that an energy minima has been found for the optimised structure.
Furthermore, the LOG file also details the optimised bond lengths and bond angles, as shown below. Although, due to calculation inaccuracies within the program, the quoted bond length will be given as 1.19Å, as opposed to the four decimal place figures given by the LOG file.
                          ----------------------------
                           !   Optimized Parameters   !
                           ! (Angstroms and Degrees)  !
 --------------------------                            --------------------------
 ! Name  Definition              Value          Derivative Info.                !
 --------------------------------------------------------------------------------
 ! R1    R(1,2)                  1.1935         -DE/DX =    0.0004              !
 ! R2    R(1,3)                  1.1935         -DE/DX =    0.0004              !
 ! R3    R(1,4)                  1.1935         -DE/DX =    0.0004              !
 ! A1    A(2,1,3)              120.0            -DE/DX =    0.0                 !
 ! A2    A(2,1,4)              120.0            -DE/DX =    0.0                 !
 ! A3    A(3,1,4)              120.0            -DE/DX =    0.0                 !
 ! D1    D(2,1,4,3)            180.0            -DE/DX =    0.0                 !
 --------------------------------------------------------------------------------
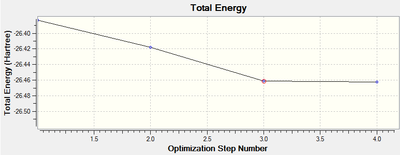
The graph detailing the 'total energy' of the structure at each iteration (of which there were four in total) along with the equivalent graph for the root mean square gradient of the force are shown below:
Frequency Analysis
It is possible to determine the degree of optimisation on a given molecule by performing a vibrational analysis on it. The frequency analysis will provide an indication of whether the optimised molecule (where the RMS gradient was ~0) was either in the ground state (a minima, where all the frequencies of vibration would be positive) or in a transition state (a maxima, where negative vibrational frequencies would be observed). The vibrational spectrum of this optimised BH3 molecule was predicted using the Gaussian SCAN system. The LOG file is provided in the references section[5], with the summary shown below. The predicted IR spectrum of the molecule is also provided.
Optiomisation_Bh3_freq
File Name = log_50137
File Type = .log
Calculation Type = FREQ
Calculation Method = RB3LYP
Basis Set = 3-21G
Charge = 0
Spin = Singlet
E(RB3LYP) = -26.46226338 a.u.
RMS Gradient Norm = 0.00020662 a.u.
Imaginary Freq =
Dipole Moment = 0.0000 Debye
Point Group = D3H
Job cpu time:  0 days  0 hours  0 minutes 13.1 seconds.
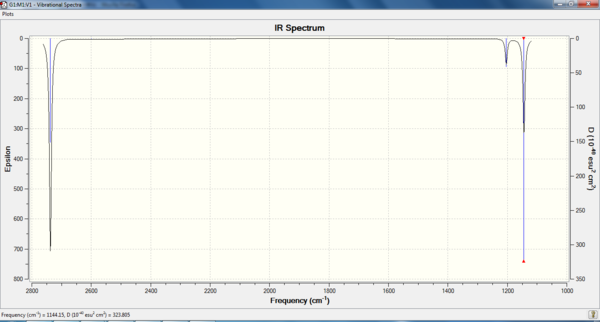
Table 1 , below, shows the vibrational analysis for this molecule:
| Vibrational Mode | Corresponding Vibrational Frequency/cm-1 [Intensity] | Literature Vibrational Frequency | Description of Mode | Image of Mode |
|---|---|---|---|---|
| A2" | 1144 [93] | 1148[6] | BH3 Umbrella Deformation: The H3 fragment is displaced above and below the Boron centre. During this vibration the B-H bond lengths all remain equal with respect to one another. There is a slight displacement of the Boron centre during this Vibrational Mode. |  |
| E' | 1204 [12] | 1197 [7] | BH3 Scissor Motion: Two of the Hydrogen atoms attached to the Boron centre swing inwards and outwards in a concerted motion. The Hydrogen atom not undergoing this motion, along with the Boron atom, are subject to a slight displacement from their equilibrium positions, along the plane of scissoring. |  |
| E' | 1204 [12] | 1197 [8] | BH2 Rocking motion: Two of the H3 hydrogens vibrate in a rocking motion around the Boron centre. (The hydrogen at the top and to the left in the diagram). The H-B-H bond angle is therefore conserved during this vibration. The remaining hydrogen undergoes a much greater displacement opposite the direction of the BH2 rocking. |  |
| A1' | 2598 [0] | Not observed | Symmetric H3 vibration. During vibration, the Hydrogen atoms all remain equally displaced from the Boron centre, this results in no change in Dipole moment, hence why the mode cannot be observed on the provided spectrum (Figure 3 ) |  |
| E' | 2737 [104] | 2602 [9] | Asymmetric BH Stretch: Two B-H bonds stretch asymmetrically with respect to one other. The other Hydrogen atom remains stationary. |  |
| E' | 2737 [104] | 2602 [10] | Asymmetric BH Stretch : Two B-H bonds stretch symmetrically with respect to each other. The remaining B-H bond counters this motion by compressing when the other B-H bonds undergo a symmetric stretch. |  |
It can be seen that only 3 stretches are observable on the predicted IR spectrum of BH3, whereas there are 6 vibrational modes that have been ascribed to BH3. This can be explained by considering that two sets of four E' Stretching modes are degenerate (1204cm-1 and 2737cm-1), and therefore appear at the same frequency on the IR spectrum. Furthermore, the A1' stretching mode does not appear on the spectrum, as no change in dipole is caused by this stretch (the prerequisite for a mode to appear on an IR spectrum is for a change in dipole moment to occur).
The lack of negative vibrational frequencies confirm that the BH3 molecule is in the ground state, and the correlation with the literature values suggest that the predicted vibrational frequencies are within a reasonable degree of accuracy.
MO Analysis for BH3
A Molecular Orbital (MO) diagram for the optimised BH3 molecule was to be produced using the Linear combination of Molecular Orbitals method, as described in the Symmetry and Spectroscopy course[11]. The equation for this shown below:
ΨΓ = N(c1Ψ1 + c2Ψ2 + ... cnΨn)
Where N = normalisation criteria, cn is the orbital coefficient for orbital n, Γ = the symmetry label of the MO and Ψ is the wavefunction relating to orbital n.
The two fragments considered in this MO diagram are the atomic orbitals of the Boron atom (Boron AO's) and the trigonal planar fragment orbital, H3. The energy levels, and their corresponding symmetry elements of the H3 fragment orbitals were determined through the application of the reduction formula.
When producing an MO diagram for this molecule, without computational analysis, it would be assumed that the 1s AO on the Boron atom would be too low in energy to interact with the H3 fragment orbitals. It would therefore be expected that this MO is found far lower in energy than any of the bonding/anti-bonding MO's. Boron is more electropositive than Hydrogen (χp = 2.04 (B) compared to χp = 2.20 (H)[12]) and is therefore situated further up the energy axis than the H3 fragment.
The hardest aspect of producing MO diagrams without computational analysis, though, is in predicting the relative energies of the MO's. In particular, the ordering of the degenerate 2e' and the single 3a1' anti-bonding orbitals is hard to predict without computational analysis.
The prior optimised BH3 structure was submitted to the SCAN server with the B3LYP method selected, using a 3-21G basis set, as before. However, this time the 'Full NBO' option was selected, under the 'Energy' method. The results of this calculation produced a series of Molecular orbitals for the molecule, of which, only the eight lowest will be analysed. The results of this calculation are provided in the referenced LOG file[13]. The relative energies [in Hartrees] and electronic populations of these orbitals are shown below:
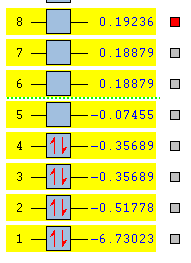
Several details of the MO's associated with BH3 can be made from this diagram.
Energy level 4 is the Highest Occupied Molecular Orbital (HOMO), whilst Energy level 5 is the Lowest Unoccupied Molecular Orbital. The electronic population amongst these levels is in agreement with the expected results (this demonstrates the HOMO is not degenerate with any other level, which would produce two Singly Occupied Molecular Orbitals (SOMO's)). Furthermore, the prediction regarding the relative energy of the Boron 1s AO (being very low compared to the bonding/antibonding MO's) appears to be correct (-6.7Ha, compared to -0.5Ha for the 2a1' MO). This orbital has been included in the MO diagram, even though it is not a Valence MO, just so a comparison between the other computed MO's can be drawn. However, the inclusion of this AO means the diagram is NOT TO SCALE.
The Gaussian calculation has determined that the 3a1' anti-bonding MO is higher in energy than the 2e' degenerate antibonding orbitals. This can be rationalised by considering the difference in overlaps between the fragment orbitals in these two types of MO. For the 3a1', there are three strongly antibonding interaction between the sAO of the Boron and the a1' FO of the H3 fragment. Taking into consideration that 's' type orbitals have greater overlap than 'p' type orbitals, this leads to a highly unfavourable energetic situation. Whereas, for the 2e' MO's there are only two weak antibonding interactions, and one strong anti-bonding interaction between the px/y AO's of the Boron and one of the 's' orbitals of the e' FO's.
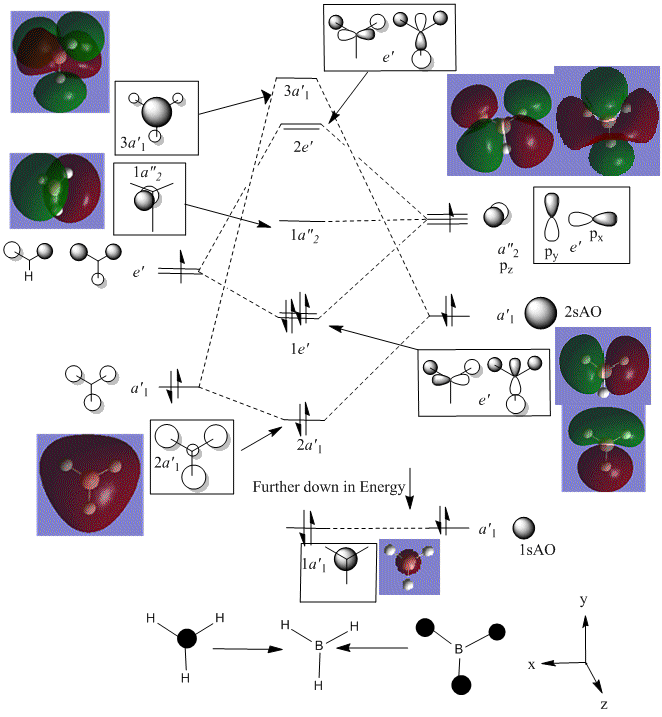
In general, the images of the MO's produced from the Gaussian calculation strongly agree with those from the LCAO prediction. For molecules of this small size, it can be stated that the Gaussian MO prediction is highly accurate and facile to perform. However, as you add more electrons to the system, the prediction will require more computational power to perform, with a greater risk of inaccuracy.
NBO Analysis
The 'Full NBO' option that was ticked to perform MO analysis also allows us to access data regarding the Natural Bond Orbitals and the Charge Distribution within the BH3 molecule. The 'Charge Distribution' option on the 'Results' section of Gaussview 5.0 allows us to view the Charge distribution within BH3 in terms of shading and absolute values. The NBO Charge Distribution for this molecule is shown below, with the more negatively charged environments shaded red and the more positively charged environments shaded green. The results are shown below:
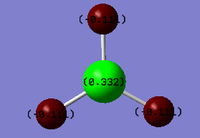
Figure 12 clearly shows that the Boron atom is more electropositive with respect to the Hydrogens. This is in agreement with the Pauling electronegativities stated earlier. Furthermore, Boron has an empty p-orbital perpendicular to the plane of the molecule. This can readily accept electrons, thereby making the Boron atom effectively positive.
The values of charge stated on the diagram can be seen more clearly in the table, taken from the LOG file, below:
Summary of Natural Population Analysis:

                                       Natural Population
                Natural  -----------------------------------------------
    Atom  No    Charge         Core      Valence    Rydberg      Total
 -----------------------------------------------------------------------
      B    1    0.33161      1.99903     2.66935    0.00000     4.66839
      H    2   -0.11054      0.00000     1.11021    0.00032     1.11054
      H    3   -0.11054      0.00000     1.11021    0.00032     1.11054
      H    4   -0.11054      0.00000     1.11021    0.00032     1.11054
 =======================================================================
   * Total *    0.00000      1.99903     6.00000    0.00097     8.00000
Finally, the 'Occupancy' section of the same LOG file provides detail into the nature of the bonding between the Boron and Hydrogen atoms.
--------------------------------------------------------
       (Occupancy)   Bond orbital/ Coefficients/ Hybrids
 ---------------------------------------------------------------------------------
     1. (1.99853) BD ( 1) B   1 - H   2
                ( 44.48%)   0.6669* B   1 s( 33.33%)p 2.00( 66.67%)
                                            0.0000  0.5774  0.0000  0.0000  0.0000
                                            0.8165  0.0000  0.0000  0.0000
                ( 55.52%)   0.7451* H   2 s(100.00%)
                                            1.0000  0.0000
     2. (1.99853) BD ( 1) B   1 - H   3
                ( 44.48%)   0.6669* B   1 s( 33.33%)p 2.00( 66.67%)
                                            0.0000  0.5774  0.0000  0.7071  0.0000
                                           -0.4082  0.0000  0.0000  0.0000
                ( 55.52%)   0.7451* H   3 s(100.00%)
                                            1.0000  0.0000
     3. (1.99853) BD ( 1) B   1 - H   4
                ( 44.48%)   0.6669* B   1 s( 33.33%)p 2.00( 66.67%)
                                            0.0000  0.5774  0.0000 -0.7071  0.0000
                                           -0.4082  0.0000  0.0000  0.0000
                ( 55.52%)   0.7451* H   4 s(100.00%)
                                            1.0000  0.0000
     4. (1.99903) CR ( 1) B   1           s(100.00%)
                                            1.0000  0.0000  0.0000  0.0000  0.0000
                                            0.0000  0.0000  0.0000  0.0000
The BD column provides data into the relative orbital contribution towards the bond between the two atoms. For all three B-H bonds, it is apparent that the Hydrogen based orbitals contribute greater than the Boron AO's. This can be rationalised using simple MO theory. The H3 fragment is lower in energy relative to the Boron AO's. Therefore, a greater contribution to the bonding MO's is expected from the energetically lower H3 fragment, as the bonding MO's would be closer in energy to the H3 Fragement orbitals. This section of the LOG file also allows us to determine the hybridisation about the Boron centre by considering the relative contribution to the B-H bonds from the 2s and 2p AO's. It can clearly be seen that, for the B-H bonds, there is a 1:2 ratio of contribution from the 2s and 2p AO's respectively. This indicates that the Boron centre is sp2 hybridised, as expected from the D3h point group. The fourth occupied AO corresponds to the occupied underlying 1sAO situated on the Boron atom.
Computational Analysis of TlBr3
Energy Optimisation
As with borane, a molecule of Thallium tribromide [trigonal planar TlBr3] was drawn on Gaussview 5.0. This molecule was subject to optimisation under a DFT/B3LYP method, however, this time a LANL2DZ basis set was used in place of the 3-21G set used for Borane. The medium level LANL2DZ set also allows the use of pseudo-potentials to be used on the heavier elements, such as Tl and Br, during optimisation. Both Thallium and Bromine exhibit relativistic effects, which cannot be accounted for through the use of the Schrödinger equation.[14] It is assumed that the majority of bonding interactions arise from the interaction of the valence electrons. The remaining, non-valence electrons (of which Thallium has 78) can then be modelled as pseudo-potentials. The 3-21G set is inadequate for the task of optimising this heavier element based molecule, whilst better basis sets are not used so as to save both time and computing power.
The symmetry of the molecule was constrained to the D3h point group, and the tolerance of the optimisation was restricted to 'Very tight'.
A 3D image of the optimised molecule can be viewed by following the associated link:
The results of the optimisation taken from the LOG file[15] are shown below:
TlBr3 Opt
File Name = log_49895
File Type = .log
Calculation Type = FOPT
Calculation Method = RB3LYP
Basis Set = LANL2DZ
Charge = 0
Spin = Singlet
E(RB3LYP) = -91.21812851 a.u.
RMS Gradient Norm = 0.00000090 a.u.
Imaginary Freq =
Dipole Moment = 0.0000 Debye
Point Group = D3H
Job cpu time:  0 days  0 hours  0 minutes 22.4 seconds.
The optimisation was clearly successful, as the RMS gradient was very low. The Tl-Br bond length was determined to be 2.65Å, with the optimum bond angle being 120o The dipole moment of the molecule was 0 Debye, as expected. The optimised bond length is reasonably similar to the bond length quoted in the literature (2.51Å)[16]
The output data from the LOG file confirms all the parameters have converged:
 Item               Value     Threshold  Converged?
 Maximum Force            0.000002     0.000450     YES
 RMS     Force            0.000001     0.000300     YES
 Maximum Displacement     0.000022     0.001800     YES
 RMS     Displacement     0.000014     0.001200     YES
 Predicted change in Energy=-6.082983D-11
 Optimization completed.
    -- Stationary point found.
The Total Energy Graph, along with the equivalent RMS Gradient graph is shown below:
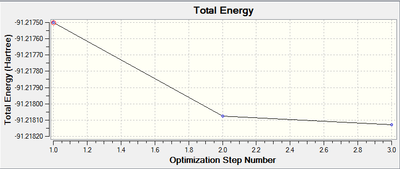
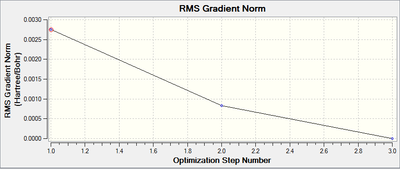
These graphs confirm that only three iterations were required to optimise the geometry.
Frequency Analysis
As with BH3, vibrational frequency analysis was performed to determine the nature of the minima found in the optimisation calculation. It is expected for a global minima that no negative values of vibrational frequency would be found (as this would correspond to a transition state).
The predicted Infrared spectrum[17] of TlBr3 is shown below:

Table 2 , below, shows the vibrational analysis for this molecule:
| Vibrational Mode | Corresponding Vibrational Frequency/cm-1 [Intensity] | Literature Vibrational Frequency see note below | Description of Mode | Image of Mode |
|---|---|---|---|---|
| A2" | 57 [6] | 68 [18] | TlBr3 Umbrella Deformation: The Br3 fragment is displaced above and below the Thallium centre. During this vibration the Tl-Br bond lengths all remain equal with respect to one another. There is a slight displacement of the Thallium centre during this vibrational Mode. | 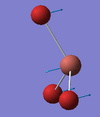 |
| E' | 50 [3] | 45 [19] | TlBr3 Scissor Motion: Two of the Bromine atoms attached to the Thallium centre swing inwards and outwards in a concerted motion. The Bromine atom not undergoing this motion, along with the Thallium atom, are subject to a slight displacement from their equilibrium positions, along the plane of scissoring. |  |
| E' | 50 [3] | 45 [20] | TlBr2 Rocking motion: Two of the Br3 atoms vibrate in a rocking motion around the Thallium centre. (The Bromine at the top and to the left in the diagram). The Br-Tl-Br bond angle is therefore conserved during this vibration. The remaining Bromine atom undergoes a much greater displacement opposite the direction of the TlBr2 rocking. |  |
| A1' | 151 [0] | 186 [21] | Symmetric Br3 vibration. During this vibration, the Bromine atoms all remain equally displaced from the Thallium centre, this results in no change in Dipole moment, hence why the mode cannot be observed on the provided spectrum (Figure 15 ) |  |
| E' | 195 [24] | 205 [22] | Asymmetric TlBr Stretch: Two Tl-Br bonds stretch asymmetrically with respect to one other. The other Bromine atom remains stationary. |  |
| E' | 195 [24] | 205 [23] | Asymmetric TlBr Stretching : Two Tl-Br bonds stretch symmetrically with respect to each other. The remaining Tl-Br bond counters this motion by compressing when the other Tl-Br bonds undergo a symmetric stretch. |  |
Please note that quoted literature values for the IR vibrational modes of TlBr3 actually relate to TlBr3-HBr in a 1:6 ratio in water. Literature values for TlBr3 could not be found. It is immediately apparent that TlBr3 and BH3 share the same vibrational modes. This is unsurprising, as both molecules are share the D3h point group.
Furthermore, several lower frequency modes were reported in the LOG file:
Low frequencies --- -0.0008 -0.0004 -0.0003 18.6824 19.5014 19.5014
The first observable vibrational mode after these is at 50cm-1 (E'). The closer to zero the values of the lower frequency stretches, the more accurate the method of frequency optimisation analysis is. Although there are three higher vibrational modes around 18cm-1, there are three vibrational modes that occur at very low negative vibrational frequencies ~(-0.0006), this indicates that the method of frequency optimisation used is reasonably accurate.
What is a bond?
Gaussview occasionally removes bonds which were previously assigned between two atoms. Gaussview uses the interatomic distance between two atoms to determine if they are bonded or not. If the interatomic distance between two atoms is too large, thereby not conforming to what Gaussview considers a chemical bond, then the physical tether is not drawn. This is a particular problem for large inorganic complexes, which contain d-orbital interactions and multi-centre bonding. It would be better for the program to consider the orbital interactions between the two atoms, however, this would require far more computing power to perform.
This phenomena brings forth an interesting question: what is a chemical bond?
For most covalent systems a chemical bond can be thought of as a superposition of electronically populated molecular orbitals, this provides chemists with an idea of where electron density may be found between atoms, effectively allowing them to draw a physical 'bond' between them. Before the advent of MO theory, a covalent bond was viewed as the sharing of two electrons between two atoms. This theory, however, did not work for species such as diborane, and could not explain phenomena such as the 18 electron rule for metal complexes. MO theory does not work for all bonding systems though, for ionic species, such as NaCl, a chemical bond is better defined as a coulombic attraction between oppositely charged ions. Finally, a metallic bond can be defined by considering the metal nuclei as a regular array of positive charges, surrounded by delocalised electrons. These estimates of bonds allow us to generally predict reactivity and properties of different compounds.
Energy minimisation and Frequency analysis of Isomers of Mo(CO)4(PCl3)2
The spectrochemical properties of Mo(CO)4L2 were explored in Experiment 4S during the 2nd Year Laboratory course (where 'L' was piperidine and Triphenylphosphine). During this experiment, the cis- and trans- forms of Mo(CO)4(PPh3)2 were synthesised and analysed by Infrared spectroscopy. The configuration of the complex was determined by consideration of the number of carbonyl stretching bands on the resultant IR spectra. This experiment aims to predict the Infrared spectra of the optimised form of both the cis- and the trans- form of Molybdenum tetra-carbonyl bis tri-chlorophosphine. The phenyl rings attached to the phosphorus from the aforementioned experiment have been substituted with chlorine atoms to reduce computational demand.[24] The vibrational frequencies relating to the stretching modes of the carbonyl ligands will then be characterised using point group theory.
Energy Optimisation
Prior to vibrational analysis, the structure of cis- and trans- Molybdenum tetra-carbonyl bis tri-chlorophosphine had to undergo optimisation. Both configurations of the complex were drawn on the Gaussview 5.0 program, and were subjected to an initial 'loose' geometric optimisation. This optimisation was done under a B3LYP method, using a low level LANL2MB [minimal basis] basis set. Loose convergence was also specified, as a limit would less likely be reached under a higher convergence criteria for this initial optimisation. The LOG files for the cis-[25] and trans-[26] loose optimisations are provided in the references.
The loosely optimised structures were then subjected to further optimisation, using a higher level LANL2DZ basis set. Prior to this, the geometry of the loosely optimised complex was required to be manually altered, to increase the computational speed of the aforementioned more advanced optimisation using the higher basis set. The idealised geometries of both structures are shown in Figure 22, below:
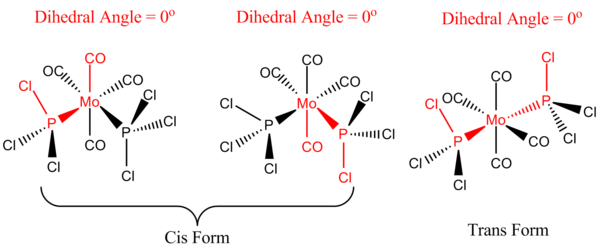
For the trans- structure, note that the idealised dihedral angle between the axial carbonyl group and one of the chlorine atoms (on both the PCl3 groups) is 0o. Fixing the Molybdenum centre relative to this Chlorine atom results in the PCl3 group rotating into the correct orientation. This is effectively an eclipsed configuration.
For the cis- structure, note that the idealised dihedral angle between one of the axial carbonyl groups (upwards facing) and the chlorine atom on one of the PCl3 groups is 0o. The dihedral angle between the other axial carbonyl group (downward facing) and one of the chlorine atoms on the other PCl3 group is also 0o. Fixing the Molybdenum centre relative to these Chlorine atoms results in the PCl3 group rotating into the correct orientation.
Once the geometries had been manually optimised, the further calculation using the higher level LANL2DZ [double zeta] basis set was performed. Electronic convergence was also increased by entering "int=ultrafine scf=conver=9" into the additional keywords section (the higher basis set requires tighter convergence criteria). The method was run on the scan server, which produced the following optimised structures of the cis- and trans- isomers.
The optimised structures are shown in the attached link: trans- Mo Complex cis- Mo Complex
The LOG files corresponding to the cis-[27] and trans-[28] isomers are shown in the references, however the Results summaries for the optimised structures are shown below.
Trans Molybdenum Optimisation
File Name = checkpoint_49932
File Type = .fch
Calculation Type = FOPT
Calculation Method = RB3LYP
Basis Set = LANL2DZ
Charge = 0
Spin = Singlet
Total Energy = -623.57603101 a.u.
RMS Gradient Norm = 0.00003216 a.u.
Imaginary Freq =
Dipole Moment = 0.3049 Debye
Point Group =
Job cpu time:  0 days  0 hours  12 minutes 32 seconds.
Cis Molybdenum Optimisation
File  Name = checkpoint_49937
File Type = .fch
Calculation Type = FOPT
Calculation  Method = RB3LYP
Basis Set = LANL2DZ
Charge = 0
Spin = Singlet
Total Energy  = -623.57707194  a.u.
RMS Gradient Norm = 0.00000787 a.u.
Imaginary Freq =
Dipole  Moment = 1.3097 Debye
Point Group =
Job cpu time:  0 days  0 hours  18 minutes 30 seconds.
The bond lengths for the optimised structures were recorded, and are shown in the table below the Results summaries for the advanced-optimisation structures. Although the point groups have not been provided by the results section of the optimisation, the cis- complex belongs to the C2v point group (therefore, it has the following symmetry elements E, one C2 axis and two σv mirror planes), whilst the trans- complex belongs to the higher symmetry D4h point group (therefore, it has: E, 2C4 & 2S4 axes (z), 2C2 axes in (xy) plane, in between the x- and y- axes, 2C2 axes along the x- and y- axes, a centre of inversion at the molybdenum, a σh mirror plane in (xy) plane, 2σv mirror planes along the Mo-CO bonds in the z axis, 2σd mirror planes in the yz and xz planes), where the 'z' axis is in line with the trans- phosphine ligands, and the 'x' and 'y' axes go along the Mo-C bonds.
As mentioned, one more optimisation can be performed on these isomers before infrared analysis. This final optimisation allows d-orbital interactions and the hypervalency of phosphorus to be taken into account. This is particularly important for Metal-Phosphine complexes, such as those being considered, as both physical and spectrochemical data will change as a result. The Gaussian input fle was modified so that a D-function with a specific decay rate was added to the phosphorus atoms.
The results of this final optimisation are detailed in the referenced LOG files [cis[29] , trans[30] ], however a summary of the results is shown below:
Trans Molybdenum Optimisation
File Name = ExtraBasisSetTrans
File Type = .fch
Calculation Type = FOPT
Calculation Method = RB3LYP
Basis Set = GEN
Charge = 0
Spin = Singlet
Total Energy = -623.69415609 a.u.
RMS Gradient Norm = 0.00000695 a.u.
Imaginary Freq =
Dipole Moment = 0.2300 Debye
Point Group =
Job cpu time:  0 days  0 hours  0 minutes  seconds.
Cis Molybdenum Optimisation
File  Name = CisExtraAnalysisOpt
File Type = .fch
Calculation Type = FOPT
Calculation  Method = RB3LYP
Basis Set = GEN
Charge = 0
Spin = Singlet
Total Energy  = -623.69291232  a.u.
RMS Gradient Norm = 0.00000508 a.u.
Imaginary Freq =
Dipole  Moment = 0.0749 Debye
Point Group =
Job cpu time:  0 days  0 hours  0 minutes  seconds.
It was noted that the energy optimisation using the LANL2DZ method determined the cis- isomer (-623.577Ha) to be the lower in total energy than the trans- isomer (-623.576Ha). This difference in total energy is approximately 2.76kJmol-1. However, upon optimising with the modified higher basis set, it was determined that the trans- isomer is actually the more stable of the two isomers by approximately 3.27kJmol-1. This a significant amount of energy and is in agreement with the literature.[31] Furthermore, the greater energetic stability of the trans- form of Mo(CO)4(PPh3)2 was confirmed experimentally during the aforementioned 2nd Year Synthesis Laboratory experiment, in which it was found that at higher temperatures, the cis- form of the complex readily isomerises to the trans- form. The mechansim of this conversion, for small phosphine groups, is thought to occur via a Bailar twist.[32] It is likely the driving force for this isomerisation is the alieviation of steraric strain between two bulky phosphine lignads as they switch from a cis- geometry to a trans- geometry.
It may be possible to alter the relative stability of the two complexes by exchanging the 'R' group on the phosphine ligand. If we seek to stabilise the cis- isomer, then two factors must be considered. First, the ligand cannot be too bulky, otherwise stearic factors will dominate and, as before, the complex will isomerise the the trans- isomer upon heating. Second, to stablise the cis- isomer, some form of intramolecular interaction between the two cis- Phosphine ligands must be present and, more importantly, favourable. The most apparent intramolecular interactions to consider are 'hydrogen bonds' and 'dipole-dipole interactions'. It was shown Hirsivaara et al. (2000) that it is possible to alter the isomeric preference of a similar tungesten complex through the formation of hydrogen bonding within the cis- complex.[33]
To cause hydrogen bond formation, a hydrogen atom must be present on one ligand (A), whilst an N, O or an F atom must be present on the other Phosphine Ligand (B), whereas dipole-dipole interactions are caused by molecules with effective dipoles, such as ester or carbonyl groups. Since both ligands must be the same, the most obvious choices of ligand to go for would be P(OH)3 (under hydrogen bond consideration) or P(OAc)3 (under dipole-dipole consideration). Neither of these groups represent a large amount of stearic bulk, nor do they contain vast amounts of electrons, therefore making them ideal candidates for energetic stability analysis of the geometric isomers upon phosphine ligand subsitution without using too much computational power.
Instead of making the cis isomer more favourable, though, you could alter the relative stabilities of the isomers by destabilising the trans- isomer. This can be done by invoking a trans- effect between the two phosphine groups trans- to one another. It would be highly unfavourable to situate two strongly electron donating groups trans- to one another. Changing the R- group for a strongly electron donating group, such as (OEt), should increasing the favourability of the cis- isomer relative to the trans-.
| Bond | Bond Length (Pre dAO Optimisation) Trans- Mo/Å | Bond Length (Post dAO Optimisation) Trans- Mo/Å | Trans- Literature Bond Length/Å see Note[34] | Bond | Bond Length (Pre dAO Optimisation) Cis- Mo/Å | Bond Length (Post dAO Optimisation) Cis- Mo/Å | Cis- Literature Bond Length/Å see Note [35] |
|---|---|---|---|---|---|---|---|
| Mo - C | 2.06 | 2.06 | 2.02 | Mo - C (trans to PCl3) | 2.01 | 2.02 | 2.02 |
| Mo - P | 2.44 | 2.42 | 2.54 | Mo - P | 2.51 | 2.48 | 2.58 |
| C = O | 1.17 | 1.17 | 1.15 | C = O (trans to PCl3) | 1.18 | 1.18 | 1.16 |
| P - Cl | 2.24 | 2.12 | Not Present in Ref. | P - Cl | 2.51 | 2.48 | Not Present in Ref. |
Note: The literature bond lengths do not correspond to cis-/trans- Mo(CO)4(PCl3)2. The bond lengths for the cis- complex correspond to cis- Mo(CO)4(PPh3)2. The quoted bond lengths for the trans- complex correspond to trans- Mo(CO)4(PCy3)2.
The bond lengths predicted from the optimisation of the complex using the medium level basis set generally agree with the bond lengths cited in the literature, despite the alteration of the phosphine ligands. What is more interesting to note, however, if the differences in bond lengths between the two methods of optimisation. The bond distances between the phosphorous atom and both the Molybdenum centre and the attached chlorine atoms seems to contract when the more advanced optimisation method is used. This was to be expected, as taking account of the d-orbital contribution to the phosphorous based bonds would lead to a contraction in bond length (cf. C-C sp3 bond distances with C=C sp2).
It was also noted that the Mo-C bond distance for the trans- isomer was smaller, in both cases of optimisation, than the equivalent cis- Mo-C bond distance. This can be attributed to a trans- effect from the Phosphine ligands within the cis- complex. The phosphine ligands donate electron density to the metal centre, which results in the carbonyl ligands trans- to the phosphine ligands (in the cis- complex) accepting a greater amount of electron density from the metal centre (with respect to the two carbonyl ligands trans- to one another), strengthening and shortening the M-C bond. The carbonyl ligand co-ordinates to the metal centre by a σ bond, with back donation from the metal into the π* anti-bonding orbital of the CO. As more electron density is donated from the metal centre to the carbonyl π* orbital (resulting from the electron donation from the Phosphine ligand), the CO bond become weaker, and as a result, longer. A comparison of CO bond lengths between the two geometries confirms the prescence of a trans- effect. The CO bond distance for the cis- complex is slightly greater than that of the trans- complex [this observation is also backed up in the literature], this indicates the CO bond is weaker in the cis- form, which can be attributed to the increased electron density in the π* antibonding orbital from the electron donating phosphine groups trans- to the carbonyl. This does not occur in the trans- isomer, as the electron accepting species (CO) is perpendicular to the electron donating species (PCl3). This reduces orbital overlap, and therefore lessens the bond weakening effect.
Frequency Analysis
Both the LANL2DZ optimised and the Further Optimised structures of each isomer were submitted to the SCAN system for vibrational frequency analysis. If the optimisation had been performed correctly, it was expected that only one peak would be observed in the carbonyl stretching region (1850-2050cm-1) for the trans- isomer (corresponding to the asymmetric stretching of the carbonyl C=O bond along both the x- and y- axes). Whereas, for the cis- isomer it was expected that four carbonyl stretches would be observed. It was also of interest to characterise and animate the vibrational modes in the low frequency region of the Infrared spectrum.
The predicted IR spectra (from the initial LANL2DZ analysis, as opposed to the d-orbital analysis) for both isomers are shown below, the LOG files are referenced within the table of observed vibrational modes:
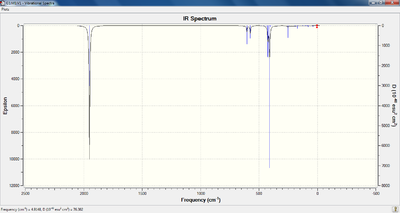
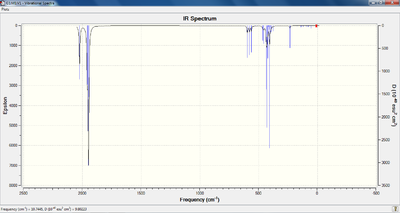
The frequency of vibration for the carbonyl stretching modes was determined for all four species, which is shown in the table below. Furthermore, an animation of the lowest frequency stretching modes has also been included. The LOG files from the SCAN server can be viewed by following the appropriate references in the top rows of the table.
Note, to conserve space, the vibrational analysis from both the LANL2DZ (Initial Analysis) and the 'd-orbital modified' LANL2DZ (Further Analysis) optimisations are included on the same table. This will allow direct comparisons to be made between the two methods.
| Vibrational Mode | Corresponding Vibrational Frequency (Initial Analysis)/cm-1 [Intensity][36] | Corresponding Vibrational Frequency (Further Analysis)/cm-1 [Intensity][37] | Literature Vibration/cm-1 [38] | Description of Mode | Image of Mode |
|---|---|---|---|---|---|
| PCl3 bend (1) | 5 [0] | 49 [0] | --- | The two PCl3 groups rotate in one direction, the Cl-P-Cl bond angle remaining constant. The Mo(CO)4 fragment rotates in the opposite direction. This is illustrated by the animation opposite. |  |
| PCl3 bend (2) | 6 [0] | 67 [0] | --- | The two PCl3 groups rotate in opposite directions to one another, with the M(CO)4 fragment remaining stationary. |  |
| Eu | 1950 [1475] | 1952 [1486] | 1886 | This vibration is the asymmetric stretching of (CO) fragment situated along the x- axis (effectively isoenergetic with the equivalent mode in the y- axis below). One of the CO ligands expands along the axis, whilst the other contracts, to produce a change in dipole moment, with all other atoms stationary. |  |
| Eu | 1951 [1467] | 1952 [1480] | 1886 | This vibration is the asymmetric stretching of (CO) fragment situated along the y- axis (effectively isoenergetic with the equivalent mode in the x- axis above). One of the CO ligands expands along the axis, whilst the other contracts, to produce a change in dipole moment, with all other atoms stationary. |  |
| B1g | 1977 [1] | 1978 [2] | 1933 | There are two symmetric stretches within this mode. The two CO fragments along the x-axis stretch, whilst the two CO fragments along the y-axis contract. This results in almost no change in dipole moment, hence the incredibly low intensity for this mode. |  |
| A1g | 2031 [4] | 2032 [4] | 2050 | This is the totally symmetric stretching mode of the 4 CO fragments. All four C=O bonds expand and contract at the same time, resulting in no change in dipole moment, therefore producing a very low intensity for this mode. |  |
| Vibrational Mode | Corresponding Vibrational Frequency (Initial Analysis)/cm-1 [Intensity] [39] | Corresponding Vibrational Frequency (Further Analysis)/cm-1 [Intensity] [40] | Literature Vibration/cm-1 [41] | Description of Mode | Image of Mode |
|---|---|---|---|---|---|
| PCl3 scissor bend (1) | 11 [0] | 58 [0] | --- | The two PCl3 groups bend towards and away from each other in a concerted manner, the P-Cl bond distances remaining constant. The(CO)4 fragment also bends, though, when the PCl3 groups move away from each other, the CO groups trans- to these are forced closer. This is illustrated by the animation opposite. |  |
| PCl3 twist (2) | 18 [0] | 67 [0] | --- | The two PCl3 groups rotate in opposite directions to one another, with the M(CO)4 fragment remaining stationary. This also causes a slight bending of the M-CO bonds. |  |
| b2' | 1945 [763] | 1947 [753] | 1869 | There is one asymmetric stretch within this mode. The two CO fragments trans to the PCl3 group stretch asymmetrically, whilst the two remaining CO fragments (along the y-axis) remain stationary, although the C=O bond itself undergoes vibration. |  |
| b2' | 1949 [1499] | 1950 [1503] | 1896 | There is one asymmetric stretch within this mode. The two CO fragments along the y-axis stretch, whilst the two remaining CO fragments (trans to the PCl3 group) remain stationary, although the C=O bond itself undergoes vibration. |  |
| a1' | 1958 [633] | 1959 [616] | 1924 | There are two symmetric stretches within this mode. When the two CO fragments along the y-axis stretch, the two remaining CO fragments (trans to the PCl3 group) contract. |  |
| a1' | 2023 [598] | 2024 [577] | 2026 | This is the totally symmetric stretching mode of the 4 CO fragments. All four C=O bonds expand and contract at the same time. |  |
Upon inspection, it can be seen that the lowest frequency vibrational modes for both isomers encompass motion about the Mo-P bond. This is unsurprising when considering the nature of the bond under the consideration of the simple harmonic oscillator equation:
ν = (1/2π)*(k/μ)0.5
Compared to all other bonds in the system, the Mo-P bond is by far the greatest in reduced mass. The equation dictates that reduced mass is inversely proportional to vibrational frequency, therefore rationalising why the Mo-P modes are found at such a low frequency.
It is interesting to note that when both isomers were optimised using the modified LANL2DZ method, both of these Mo-P vibrational modes shifted to a higher vibrational frequency. This is a direct consequence of the strengthening of the Mo-P bond through the consideration of the d-orbital interaction between the Phosphorus atom and the Molybdenum centre. (A stronger bond is represented by a higher force constant, which increases vibrational frequency in the SHO equation). The low frequency of rotation about this bond directly corresponds to a low energy of activation for this mode to occur, therefore, there should be free rotation about this bond at room temperature.
Upon analysis of the carbonyl based vibrational modes, it is clear that predicted stretching frequencies correlate well with the values given in the literature. For the trans- complex, the computed vibrational frequencies and intensities agree with the earlier prediction (that only one peak would be observable on the infrared spectrum). This is due to two of the modes (E') being degenerate, and the other two not producing a change in dipole moment, therefore not being observed on the spectrum. The modification of the method to account for d-orbital interaction does not alter the vibrational frequency of these carbonyl modes significantly. For the cis- complex, four peaks can be observed on the spectrum, although, the two peaks relating to the b2' are indistinguishable at the resolution provided, as they posses a very similar vibrational frequencies.
Mini Project: Bridging Halogens in Group 13 dimers
Introduction
Trigonal Planar Group 13 halides (MX3), [M = Al, Ga, In/ X = Cl, Br, I] have a wide range of uses, particularly as catalysts in organic reactions such as hydrohalogenation, alkene activation and the Friedel Crafts alkylation[42], to name but a few. These species all act as Lewis acids, as they can readily accept a lone pair of electrons. Due to their acidity, these complexes are also known to regularly dimerise to form species with the general formula M2X6. These species are known to have a 3-centre 2-electron bond.
The most widely known example of a molecule which contains this bonding arrangement is diborane (B2H6). This structure could not be rationalised by the contemporary VSEPR theory, and it could only be explained by consideration of the Molecular orbitals that make up its bonding system.
When considering the dimerised structures of the higher Group 13 elements, such as Aluminium, it has been found that halogen atoms, as opposed to hydrides or hydrocarbons, tend to occupy the bridging positions[43]. However, this poses an interesting question, if two different halides were present in these dimers, such as Bromine and Chlorine, which would be situated in the bridging position?
This mini project aims to explore this type of multi-centre bonding which occurs in the halides of the higher Group 13 element, Aluminium.
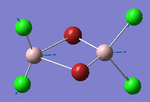
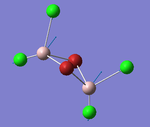
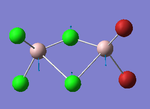
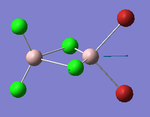
This will be done in the following manner; firstly, a valence Molecular orbital diagram for diborane will be drawn and the theoretical MO's compared with those produced by the Gaussian 09 program. A brief rationalisation of multi-centre bonding using MO theory will also be provided. This acts as a general reference for when the MO's of the higher group 13 halides are computationally predicted (despite the differences in chemical structure, the valence MO diagram for diborane will be similar to those of Al2X2Cl4). It will then be determined, via computational methods, which halogen atom (Chlorine or 'X') prefers to occupy the bridging positions for the following two species: AlBr2Cl4 and AlI2Cl4. For both of these dimers, three different configurations will be analysed, as shown below:

Analysis of the relative stabilities, bond lengths, bond angles and vibrational spectra will be provided for all six configurations under consideration. Further analysis into the internal charge distribution and relative energies of the Molecular orbitals will also be performed, to rationalise the relative stabilities of each configuration. It is predicted that the configuration which is determined to be the most stable for X = Bromine should be the same as the most stable configuration for X = Iodine.
Diborane Bonding analysis
Diborane was drawn on GaussView 5.0, this structure was subsequently optimised using the LANL2DZ basis set under a B3LYP method. The optimised structure of diborane is shown in the link provided. The results of the optimisation are shown below, which is taken directly from the LOG file.[44]
Borane Optimisation
File Name = Borane Optimisation
File Type = .fch
Calculation Type = FOPT
Calculation Method = RB3LYP
Basis Set = LANL2DZ
Charge = 0
Spin = Singlet
Total Energy = -53.26040394 a.u.
RMS Gradient Norm = 0.00013335 a.u.
Imaginary Freq =
Dipole Moment = 0.0000 Debye
Point Group =
Job cpu time:  0 days  0 hours  1 minutes 6 seconds.
As with BH3, the relative energies (in Ha) and shapes of the Molecular orbitals were predicted through the selection of the 'Full NBO' option under the Energy calculation section of Gaussian 09 software.[45]
The relative energies (in Ha) of the MO's, as predicted by the Gaussian calculation, are shown in Figure 38 below:
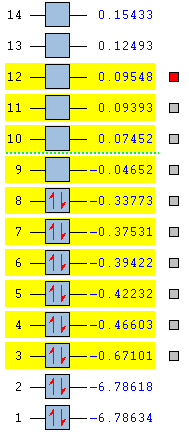
It can be seen that the HOMO is situated at energy level 8, and the LUMO at energy level 9. It can also be seen that the relative gap in energy between the HOMO and the non-bonding LUMO is very large (0.29Ha ~ 761kJmol-1) compared to the gaps between the other occupied orbitals. However, even considering this large difference in relative energy, the LUMO is still able to accept lone pairs of electrons from bases.
The ten molecular orbitals highlighted in yellow (HOMO -> HOMO-5 and LUMO -> LUMO+3) were visualised on GaussView. These molecular orbital simulations were compared to the structures predicted through the LCAO approach, as was done with BH3. The molecular orbital diagram was generated by the use of two fragment orbitals (FO's). A H2 fragment was used to represent the bridging hydrogens, whilst, two BH2 fragments were combined (also using the LCAO approach) to produce a (BH2)2 fragment.[46] The H2 fragment provides 2 electrons, whilst the (BH2)2 is a ten electron fragment, the MO's were populated from the lowest energy orbital upwards, in accordance with the Aufbau principle. No mixing between these molecular orbitals was expected, due to the large differences in energy between orbitals of the same symmetry (2ag + 3ag and 2b1u + 3b1u).
The resultant MO diagram is shown below in Figure: 39

From this diagram it is clear that the 1b3u MO is the main contributor to the 3c-2e bond. A similar arrangement is to be expected for the aforementioned Group 13 halides.
In general, the images of the MO's produced from the Gaussian calculation agree, to a reasonable extent, with those from the LCAO prediction. It can be stated that the Gaussian MO prediction is relatively accurate and facile to perform. From inspection, there also appears to be a large amount of Non-bonding character present in this molecule.
Configuration of Al2Br2Cl4
As stated in the aims, a halogen atom will always tend to occupy the bridging position over an hydrogen atom or alkyl group in Aluminium dimers of the form Al2X2R4. However, it is unknown whether a heavier halogen, such as Bromine or Iodine, prefers to be situated in the bridging position over a halogen with a lower molecular weight, such as Chlorine. This project aims to both determine and rationalise the preferred configuration of such molecules. In particular, the stability of three different configurations of the dimer, Al2Br2Cl4 will be determined through computational analysis. The three configurations of the dimer to be analysed are the trans- form (where the Bromine atoms are trans- to one another), the 'bridging' form, where the Bromine atoms act as the bridging halogens, and the cis- form, where the Bromine atoms are situated on the same Aluminium centre. Following this, a second computational experiment will be performed, this time substituting the 'heavy halogen' for Iodine, to determine whether there is a general trend amongst the heavier halogens as to which position on the dimer they prefer to occupy.
The relative stability of each configuration will be determined by comparing the values of 'total energy' estimated by the optimisation calculation. The structure with the lowest (most negative) total energy will be deemed the most stable.
Prior to this energetic analysis, the geometry of the dimers were optimised using the B3LYP method under a LANL2DZ basis set. The LOG files resulting from this optimisation are available for the cis-[47], trans-[48] and bridging[49] forms in the references. The optimised structures for each configuration can be seen in 3D by following the links below:
Optimised Structure of Bridged Al2Br2Cl4
Optimised Structure of cis- Al2Br2Cl4
Optimised Structure of trans- Al2Br2Cl4
The Results summaries for each of the three configurations are shown below:
Results summary for the trans- Bromine dimer:
Trans- Bromine Optimisation
File Name = checkpoint_50315
File Type = .fch
Calculation Type = FOPT
Calculation Method = RB3LYP
Basis Set = LANL2DZ
Charge = 0
Spin = Singlet
Total Energy = -90.47287329 a.u.
RMS Gradient Norm = 0.00006607 a.u.
Imaginary Freq =
Dipole Moment = 0.0009 Debye
Point Group =
Job cpu time:  0 days  0 hours  0 minutes 46 seconds.
Results summary for the bridging Bromine dimer:
Bridging Bromine Optimisation
File Name = checkpoint_50294
File Type = .fch
Calculation Type = FOPT
Calculation Method = RB3LYP
Basis Set = LANL2DZ
Charge = 0
Spin = Singlet
Total Energy = -90.46237265 a.u.
RMS Gradient Norm = 0.00000586 a.u.
Imaginary Freq =
Dipole Moment = 0.0000 Debye
Point Group =
Job cpu time:  0 days  0 hours  0 minutes 55 seconds.
Results summary for the cis- Bromine dimer:
Cis- Bromine Optimisation
File Name = checkpoint_50306
File Type = .fch
Calculation Type = FOPT
Calculation Method = RB3LYP
Basis Set = LANL2DZ
Charge = 0
Spin = Singlet
Total Energy = -90.47300569 a.u.
RMS Gradient Norm = 0.00003566 a.u.
Imaginary Freq =
Dipole Moment = 0.8835 Debye
Point Group =
Job cpu time:  0 days  0 hours  0 minutes 45 seconds.
From these results it can clearly be seen that the relative order of stability (for the positions of the two Bromine atoms) is as follows:
cis- [most stable] > trans- > bridging [least stable]
These results may seem rather unexpected, as it would be assumed that stearics would surely dictate that the two larger halogen atoms would prefer to adopt a configuration that maximises their separation, therefore making the trans- form the most stable, or that electronics would dictate that the two least electronegative halogen atoms (the two Bromine atoms) would prefer to be situated in the bridging positions (thereby allowing dative covalent bonding into the acceptor p- orbital of the Aluminium to occur more readily than would happen if the more electronegative Chlorine atoms were situated in the bridging positions). However, neither of these arguments were able to predict the relative stabilities of the three different configurations. To rationalise this order, we should first consider the differences in bond lengths and bond angles between the three configurations;
The bond lengths and triatomic bond angles were determined on the GaussView 5.0 software:
| Trans- Molecule | Br-Al Bond Length (terminal)/Å | Cl-Al Bond Length (terminal)/Å | Cl-Al Bond Length (bridge)/Å | Br-Al-Cl Bond Angle (terminal)/o | Cl-Al-Cl Bond Angle (bridge)/o |
|---|---|---|---|---|---|
| Al2Br2Cl4 | 2.33 | 2.18 | 2.42 | 124 | 85 |
| Bridging Molecule | Br-Al Bond Length (bridge)/Å | Cl-Al Bond Length (terminal)/Å | Cl-Al-Cl Bond Angle (terminal)/o | Br-Al-Br Bond Angle (bridge)/o |
|---|---|---|---|---|
| Al2Br2Cl4 | 2.59 | 2.18 | 123 | 89 |
| Cis- Molecule | Br-Al Bond Length (terminal)/Å | Cl-Al Bond Length (terminal)/Å | Cl-Al Bond Length (bridge)/Å | Br-Al-Br Bond Angle (terminal)/o | Cl-Al-Cl Bond Angle (terminal)/o | Cl-Al-Cl Bond Angle (bridge)/o |
|---|---|---|---|---|---|---|
| Al2Br2Cl4 | 2.34 | 2.18 | 2.41 | 125 | 123 | 85 |
Literature Values of Bond length[50]:
Al-Cl(t): 2.06
Al-Br(t): 2.21
Al-I(t): 2.53
Al-Cl(μ): 2.21
Al-Br(μ): 2.33
Al-I(μ): 2.58
Firstly, it can be seen that the position of the Bromine atom in the three different configurations have no apparent bearing on the Al-Cl (terminal) bond length, as this distance appears to remain constant at 2.18Å in all three isomers. It has been stated in the literature cited above that the standard bond length observed for Al-Br was 2.21Å. The standard bond length for Al-Cl bonds was quoted to be 2.06Å. The bond length determined for the terminal chlorine atoms seem to be in reasonable agreement with the literature, however, what is most interesting is the difference in bond lengths for the Al-Br bonds in the three configurations. For both the cis- and the trans- configurations, the terminal Br-Al bond is approximately the same length (2.33-2.34Å), however, when placed in a bridging position, the bond length increases significantly, this is likely due to the greater atomic radius of the Bromine atom with respect to the Chlorine atom. This increased bond distance also represents a decrease in orbital overlap (which is experienced far less when the Chlorine atom is bridging), which would lead to a less stable system overall. Furthermore, the internal bond angle increases by 4o when the Bromine atoms are bridging as opposed to the Chlorine atoms. This is likely a result of an unfavourable stearic effect. This could explain why the bridging isomer is not the most stable, but doesn't give too much of an indication as to why the trans- isomer is far less stable than the cis- isomer, therefore further analysis into the stability of the three configurations must be performed.
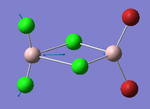
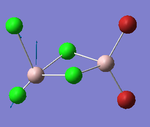
These three structures were then resubmitted to Gaussian for a frequency analysis. The full results of the frequency analysis can be viewed in the corresponding LOG files for Bromine in the cis-[51], trans-[52] and bridging[53] positions. There are three specific modes (five for cis-) of vibration of that will be analysed and discussed for each configuration. These relate to the vibrations of the Aluminium centres along the x-, y- and z- plane.
NOTE: Each vibrational mode has been given a specific label to conserve space in the frequency analysis tables. An image of each mode is shown in the Table below:
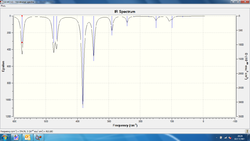
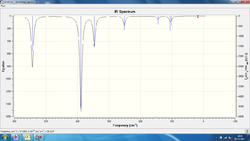
Vibrational spectra have been produced for the 3 configurations of Al2Cl4Br2 which are presented below, alongside a set of tables containing the vibrational modes recorded for each configuration:

| Vibrational mode label | Frequency of vibrational mode (trans-)/cm-1 | Intensity of vibrational mode (trans-) | Frequency of vibrational mode (bridge)/cm-1 | Intensity of vibrational mode (bridge) |
|---|---|---|---|---|
| ν(x) | 347 | 135 | 304 | 163 |
| ν(y) | 389 | 439 | 424 | 305 |
| ν(z) | 543 | 236 | 572 | 212 |
The most interesting vibrational mode to compare between these two configurations is the ν(x) mode. When considering both the ν(y) and ν(z) modes, the Bromine bridging species oscillates at a greater frequency than the trans- configuration by approximately 30-40cm-1. However, the opposite is true of the ν(x) mode of the bridging species, which oscillates at a lower frequency than the trans- configuration by approximately 30-40cm-1. This is highly strange, as the vibrating Aluminium metal centres are still connected to the same atoms, via the same bonds (hence the same value of the force constant, k), the only difference is in the plane of vibration (ν(x) consists of a forward and backward rocking motion [*if the Aluminium bonds to the terminal atoms are situated in the plane of the webpage]). It is therefore likely that this ν(x) vibrational mode encompasses the motion of more, heavier atoms for the bridging species than either ν(y) or ν(z) (as, for the frequency to vibrational frequency to decrease, the reduced mass must increase). This suggests that the vibrational motion of the bridging heavier halogen species is observed at low values of frequency. We can also compare both the bridging and the trans- configurations' vibrational data to that of the cis- isomer, as shown below:
| Vibrational mode label | Frequency of vibrational mode (cis-)/cm-1 | Intensity of vibrational mode (cis-) |
|---|---|---|
| ν(x) | 347 | 135 |
| ν(y) | 382 | 306 |
| ν(y)' | 465 | 95 |
| ν(z) | 474 | 110 |
| ν(z)' | 575 | 132 |
Prior to any analysis, the first observation that should be noted is that there are no longer only three vibrational modes present, as was the case with the trans- and the bridging Bromine species. Two 'extra' modes of vibration have been located, this is due to the splitting of two of the original modes (ν(y) and ν(z)) of vibration into separate modes (in which only one Aluminium atom undergoes vibration due to the differences in surrounding halogens which renders the metal centres inequivalent, unlike the concerted vibrational motion experienced for both the trans- and bridging species.
When comparing this data with that of the other Bromine isomers, the most striking mode is, once again, the ν(x) mode. The frequency and intensity of this mode exactly matches that of the equivalent mode in the trans- species, despite the difference in chemical environment. From this, it can be assumed that this vibrational mode is entirely independent of the non-bridging halogen atoms. This assumption will be tested later when the bromine atoms are substituted for Iodine.
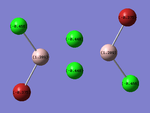
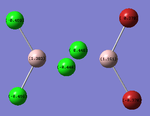
The NBO charge distribution for each configuration was then produced, in an effort to rationalise the ordering of the energetic stability associated with each configuration. The images produced have the partial charges labelled on them, which are shown in the table below. These images were produced through the selection of the 'Energy' option on the Gaussian calculation setup, along with the entry of "pop=full" into the additional keywords section. The corresponding LOG files for these calculations can be viewed by following the link provided in the references section:
Charge Distribution for each Configuration:
| trans- configuration[54] | cis- configuration[55] | bridged configuration[56] |
|---|---|---|
 |
 |
 |
The results were as expected, the relative distribution of charge strongly relates to the (Pauling) Electronegativity of each atom (χCl = 3.16 χBr = 2.96 χAl = 1.61). It should be noted that the charge distribution is in-keeping with the point group symmetry of the molecule (i.e. the charge distribution across the two bridging Chlorine atoms, or two terminal Bromine atoms is the same on each).
Configuration of Al2I2Cl4
The aim of this secondary part of the project is to establish a trend between heavier halogens and configurational preference on molecules of the type Al2X2Cl4. It was found in the previous section that the cis- configuration was the energetically most stable configuration Al2Br2Cl4 could adopt. It would be interesting to see if the energetic stabilities altered as a consequence of changing the 'heavy' halogen. As with the previous section, the stability of three different configurations of the dimer will be determined through computational analysis. The three configurations of the dimer to be analysed are the trans- form (where the Iodines are trans- to one another), the 'bridging' form, where the Iodines act as the bridging halogen, and the cis- form, where the Iodines are situated on the same aluminium centre.
Prior to this, the geometry of the dimers were optimised using the B3LYP method, under a LANL2DZ basis set. The LOG files for this optimisation are available for the cis-[57], trans-[58] and bridging[59] forms in the references. The Results summary for each of the three configurations is shown below:
The optimised structures for each configurations can be seen in 3D by following the link below:
Optimised Structure of Bridged Al2I2Cl4
Optimised Structure of cis- Al2I2Cl4
Optimised Structure of trans- Al2I2Cl4
Results summary for trans- Iodine configuration
Trans- Iodine Optimisation
File Name = checkpoint_50626
File Type = .fch
Calculation Type = FOPT
Calculation Method = RB3LYP
Basis Set = LANL2DZ
Charge = 0
Spin = Singlet
Total Energy =  -86.90266386 a.u.
RMS Gradient Norm = 0.00001642 a.u.
Imaginary Freq =
Dipole Moment = 0.0005 Debye
Point Group =
Job cpu time:  0 days  0 hours  1 minutes 38 seconds.
Results summary for cis- Iodine configuration
Bridging Iodine Optimisation
File Name = checkpoint_50358
File Type = .fch
Calculation Type = FOPT
Calculation Method = RB3LYP
Basis Set = LANL2DZ
Charge = 0
Spin = Singlet
Total Energy = -86.88443196 a.u.
RMS Gradient Norm = 0.00002059 a.u.
Imaginary Freq =
Dipole Moment = 0.0000 Debye
Point Group =
Job cpu time:  0 days  0 hours  1 minutes 0 seconds.
Results summary for bridging Iodine configuration
Cis- Iodine Optimisation
File Name = checkpoint_50625
File Type = .fch
Calculation Type = FOPT
Calculation Method = RB3LYP
Basis Set = LANL2DZ
Charge = 0
Spin = Singlet
Total Energy =  -86.90280829 a.u.
RMS Gradient Norm =  0.00003540 a.u.
Imaginary Freq =
Dipole Moment =  1.9340 Debye
Point Group =
Job cpu time:  0 days  0 hours  1 minutes 15 seconds.
From these results it can clearly be seen that the relative order of stability (for the positions of the two Iodine atoms) is as follows:
cis- [most stable] > trans- > bridging [least stable]
This order of stability is in agreement with those produced for the Bromine analogue of the same molecule. It is highly likely, therefore, that if a calculation was to be done using Astatine as the 'heavy halogen', it would be found that adoption of the cis- configuration would be the most likely to be found.
As with Al2Br2Cl4 the bond lengths and bond angles within the molecule will be determined using GaussView 5.0. A general comparison between the structures will be provided. It is expected that the Al-I bond length will be greater than the equivalent Al-Br bond lengths (due to atomic radii increasing down the Group 17), furthermore, if the observed increase in size of the Br-Al-Br triatomic angle (where both Br atoms are bridging) was due to a stearic clash between the large Bromine atoms, then it is expected that the equivalent bond angle in the bridging I-Al-I isomer will be even greater than 89o.
| Trans- Molecule | I-Al Bond Length (terminal)/Å | Cl-Al Bond Length (terminal)/Å | Cl-Al Bond Length (bridge)/Å | I-Al-Cl Bond Angle (terminal)/o | Cl-Al-Cl Bond Angle (bridge)/o |
|---|---|---|---|---|---|
| Al2I2Cl4 | 2.52 | 2.19 | 2.43 | 124 | 85 |
| Bridging Molecule | I-Al Bond Length (bridge)/Å | Cl-Al Bond Length (terminal)/Å | Cl-Al-Cl Bond Angle (terminal)/o | I-Al-I Bond Angle (bridge)/o |
|---|---|---|---|---|
| Al2I2Cl4 | 2.78 | 2.19 | 121 | 93 |
| Cis- Molecule | I-Al Bond Length (terminal)/Å | Cl-Al Bond Length (terminal)/Å | Cl-Al Bond Length (bridge)/Å | I-Al-I Bond Angle (terminal)/o | Cl-Al-Cl Bond Angle (terminal)/o | Cl-Al-Cl Bond Angle (bridge)/o |
|---|---|---|---|---|---|---|
| Al2I2Cl4 | 2.53 | 2.18 | 2.46 | 126 | 123 | 84 |
As expected, the Bridging I-Al-I bond angle was increased to 93o, which confirms the notion that stearic hinderance was the primary cause of the increased internal bond angle in the Br-Al-Br bridging isomer. It should be noted that, as with the Bromine analogue, the Al-Cl terminal bond distance was fairly consistent at 2.19Å between the three isomers. Also, for both the cis- and the trans- configurations, the terminal I-Al bond is approximately the same length (2.52-2.53Å), however, when placed in a bridging position, the bond length increases significantly, as was the case with Al2Br2Cl4.
A frequency analysis was then performed on the optimised structures. The full results can be viewed in the corresponding LOG files for Iodine in the cis-[60], trans-[61] and bridging[62] positions. As with before, there are three (five for cis-) specific modes of vibration of that will be analysed and discussed for each configuration. These relate to the vibrations of the Aluminium centres along the x-, y- and z- plane. The same vibrational mode labels used for the Bromine dimer will be used again for the Iodine dimer.
The following vibrational modes were recorded for each configuration:
| Vibrational mode label | Frequency of vibrational mode (trans-)/cm-1 | Intensity of vibrational mode (trans-) | Frequency of vibrational mode (bridge)/cm-1 | Intensity of vibrational mode (bridge) |
|---|---|---|---|---|
| ν(x) | 340 | 119 | 281 | 177 |
| ν(y) | 364 | 500 | 418 | 292 |
| ν(z) | 526 | 231 | 557 | 195 |
A general comparison of the IR data between the Bromine and Iodine based trans- and bridging species allows us to see that the stretching frequencies of the Iodine based isomers generally occur at lower wavenumbers than their corresponding Bromine analogues. This is due to the greater reduced mass associated with the diatomic bonds to an Iodine atom than to a Bromine atom. As with the bromine based isomers, the most interesting vibrational mode to look at between these two configurations is the ν(x) mode. Both the ν(y) and ν(z) modes the Bromine bridging species oscillate at a greater frequency than in the corresponding trans- configuration. However, the opposite is true of the ν(x) mode of the bridging species, which oscillates at a lower frequency than the trans- configuration. This suggests that the vibrational motion of the heavier halogen is significant for the Iodine bridging species in the lower frequency region of the spectra.
| Vibrational mode label | Frequency of vibrational mode (cis-)/cm-1 | Intensity of vibrational mode (cis-) |
|---|---|---|
| ν(x) | 343 | 120 |
| ν(y) | 352 | 274 |
| ν(y)' | 465 | 135 |
| ν(z) | 420 | 124 |
| ν(z)' | 570 | 124 |
It is also interesting to compare the frequency of vibration of the ν(x) mode between the cis- and trans- isomers of Al2I2Cl4. It was mentioned during the frequency analysis section for the Bromine based isomers that the frequency and intensity of the ν(x) mode in the cis- isomer 'exactly matches that of the equivalent mode in the trans- species, despite the difference in chemical environment.' For the Iodine species, this is not exactly true. The cis- isomer oscillates at a slightly higher frequency than the trans- isomer. Although, the the wavenumbers are fairly similar (within 3cm-1).
In actuality, you can also compare this vibrational mode (for the cis- and trans- isomers) across species. Only a small difference in vibrational frequency is observed between the four structural isomers (~7cm-1).
NBO Charge distribution The NBO charge distributions for each of the configurations has also been analysed, with the results shown below, the partial charges on the atoms are shown on the diagrams:
Charge Distribution for each Configuration:
| trans- configuration[63] | cis- configuration[64] | bridged configuration[65] |
|---|---|---|
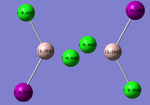 |
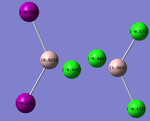 |
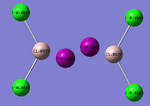 |
The results were as expected, the relative distribution of charge strongly relates to the (Pauling) Electronegativity of each atom (χCl = 3.16 χI = 2.66 χAl = 1.61). The values of the relative charges altered depending on the environment in which the halogen was found, for example terminal Iodine was found to have a more negative charge than bridging Iodine.
Molecular Orbital Rationalisation
So far, this project has provided no evidence as to why the cis- form of the Group 13 halogen dimers is the more stable of the three configurational isomers analysed. However, this seemingly anomalous stability can be rationalised by observing the bonding Molecular Orbitals of the dimers. If two halogens are situated on the terminal positions, they can interact in a bonding or antibonding manner. The strength of this interaction depends mainly upon the orbital overlap between the two halogens. This overlap is better when the orbitals are closer in energy, for example, Iodine-Iodine orbital overlap produces a stronger bonding interaction than an Iodine-Chlorine orbital overlap would.
When the cis- isomers are formed, halogens of the same type are found on the adjacent to one another in the terminal positions. This leads to an energetically favourable overlap, therefore reducing the energy of the molecule.
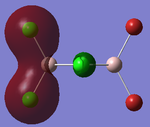
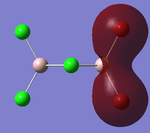
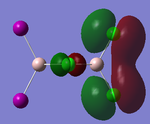
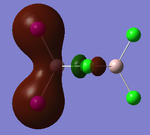
Visualisations of the MO's that produce this strong bonding-type overlap for both cis- dimers under consideration have been provided in the tables below.
PLEASE NOTE: the appropriate LOG files that produced these MO's have already been referenced in the appropriate NBO section
| Molecular Orbital 5 | Molecular Orbital 17 | Molecular Orbital 18 | Molecular Orbital 21 | Molecular Orbital 22 |
|---|---|---|---|---|
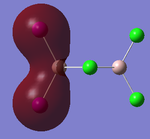 |
 |
 |
 |
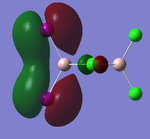 |
These diagrams show the large bonding interactions between the terminal halogen molecules. Had the trans- form been visualised, the overlap between the terminal halogens would have been greatly reduced. It is evident that this strong orbital overlap is the main reason as to why the cis- form of the dimer is considered the most energetically favourable.
Mini project Conclusion
The stated aims of the mini project have been achieved in the time allocated. It was found that the cis- isomer of dimers of the form M2X2Cl4, where X = Br or I, was more stable than either the trans- or the bridging isomer. The initial part of the project allowed visualisation of the Molecular Orbital picture of 2-centre 3-electron bonding in molecules such as borane.
Measurement of bond lengths and bond angles led us to the conclusion that stearic hinderance might disfavour the formation of the bridge type dimers. However, neither Frequency analysis, nor NBO charge distributions could properly rationalise why the cis- isomer was the most stable.
It was only with the visualisation of the deeply bonding MO's belonging to the cis- isomer could the relative stability of the dimers be properly rationlised.
Conclusion
This module has demonstrated how computational chemistry can be of great use to the field Inorganic Chemistry. A wide range of techniques and analytical tools have been shown throughout the module. More specifically, computational methods have allowed us the determine the geometrically optimised energies of both BH3 and TlBr3. The latter also provided a good example of how computational methods take account of relativistic effects and multi-electron systems. It was also shown that computational chemistry allow us to determine the hybridisation of the central atoms, such as Boron and the charge distribution within molecules.
Furthermore, the methods used enabled us to visualise the Molecular Orbitals of BH3 and B2H6, which could then be compared to our 'best guess' LCAO approach to producing a Molecular Orbital diagram. This provides us with a benchmark of energy levels against which we can use to construct MO diagrams of more complicated systems.
Furthermore, we can predict the vibrational spectra of particularly complex Inorganic molecules, such as the metal complex, Mo(CO)4PCl3. From this, we can characterise absorptions in the regions of the vibrational spectra that we are interested in, such as the carbonyl stretching region analysed in the Isomers question.
References
- ↑ J. Nørskov et al., Chemistry World, 2008 link: http://www.rsc.org/chemistryworld/News/2008/June/05060802.asp
- ↑ http://hdl.handle.net/10042/to-10552
- ↑ M. Schuurman, et. al., J. Comp . Chem., 26, 2005, pp.1106-1112
- ↑ R. DeKock et. al., Chemical Structure and Bonding, 1989, p.162
- ↑ http://hdl.handle.net/10042/to-10553
- ↑ M. Jacox, Vibrational and Electronic Energy Levels of Polyatomic Transient Molecules, J. Phys. Chem. Ref. Data, 1994, Monograph 3
- ↑ M. Jacox, Vibrational and Electronic Energy Levels of Polyatomic Transient Molecules, J. Phys. Chem. Ref. Data, 1994, Monograph 3
- ↑ M. Jacox, Vibrational and Electronic Energy Levels of Polyatomic Transient Molecules, J. Phys. Chem. Ref. Data, 1994, Monograph 3
- ↑ M. Jacox, Vibrational and Electronic Energy Levels of Polyatomic Transient Molecules, J. Phys. Chem. Ref. Data, 1994, Monograph 3
- ↑ M. Jacox, Vibrational and Electronic Energy Levels of Polyatomic Transient Molecules, J. Phys. Chem. Ref. Data, 1994, Monograph 3
- ↑ P. Hunt, Symmetry and Spectroscopy, Lecture 4, 2010, pp.1-10
- ↑ P. Atkins, Inorganic Chemistry 4th Ed., 2006, p. 31
- ↑ http://hdl.handle.net/10042/to-10581
- ↑ P. Hunt, 3rd Year Computational Lab, online wiki, 2011
- ↑ http://hdl.handle.net/10042/to-10577
- ↑ J. Glaser et al., Acta Chemica Scandanavica A, 36, 1982, pp.125-135
- ↑ http://hdl.handle.net/10042/to-10579
- ↑ J. Davies, et al., J. Chem. Soc A, 1968, pp.2050-2054
- ↑ J. Davies, et al., J. Chem. Soc A, 1968, pp.2050-2054
- ↑ J. Davies, et al., J. Chem. Soc A, 1968, pp.2050-2054
- ↑ J. Davies, et al., J. Chem. Soc A, 1968, pp.2050-2054
- ↑ J. Davies, et al., J. Chem. Soc A, 1968, pp.2050-2054
- ↑ J. Davies, et al., J. Chem. Soc A, 1968, pp.2050-2054
- ↑ P. Hunt, 3rd Year Computational Lab, Online wiki, 2011
- ↑ http://hdl.handle.net/10042/to-10571
- ↑ http://hdl.handle.net/10042/to-10574
- ↑ http://hdl.handle.net/10042/to-10566
- ↑ http://hdl.handle.net/10042/to-10568
- ↑ http://hdl.handle.net/10042/to-10556
- ↑ http://hdl.handle.net/10042/to-10559
- ↑ D. Darensbourg, Inorg Chem., 18, 1979, pp.14-17
- ↑ D. Darensbourg, Inorg Chem., 18, 1979, pp.14-17
- ↑ L. Hirsivaara, et al., Inorg. Chem. Comm., 3, 2000, pp. 508-510
- ↑ E. Aleya et al., Acta. Cryst., C52, 1996, pp.765-767
- ↑ F. A. Cotton et al., Inorg. Chem., 21, 1982, pp.294-299
- ↑ http://hdl.handle.net/10042/to-10564
- ↑ http://hdl.handle.net/10042/to-10530
- ↑ D. Darensbourg, Inorg Chem., 18, 1979, pp.14-17
- ↑ http://hdl.handle.net/10042/to-10562
- ↑ http://hdl.handle.net/10042/to-10554
- ↑ M. Ardon et al., J. Chem. Educ., 79, 2002, pp.1249-1251
- ↑ M. Shilina, et al., Journal of Molecular Catalysis A, 1999, 146, pp. 335-341
- ↑ P. Lickiss, 2nd Year Main Group Chemistry, 2011, pp.14-17
- ↑ http://hdl.handle.net/10042/to-10678
- ↑ http://hdl.handle.net/10042/to-10679
- ↑ P. Hunt, Molecular Orbitals in Inorganic Chemistry, Lecture 5, 2010, pp.1-10
- ↑ http://hdl.handle.net/10042/to-10654
- ↑ http://hdl.handle.net/10042/to-10650
- ↑ http://hdl.handle.net/10042/to-10646
- ↑ K. Wade, J. Chem. Educ., 49, 1972, pp. 502-505
- ↑ http://hdl.handle.net/10042/to-10653
- ↑ http://hdl.handle.net/10042/to-10649
- ↑ http://hdl.handle.net/10042/to-10657
- ↑ http://hdl.handle.net/10042/to-10648
- ↑ http://hdl.handle.net/10042/to-10652
- ↑ http://hdl.handle.net/10042/to-10656
- ↑ http://hdl.handle.net/10042/to-10709
- ↑ http://hdl.handle.net/10042/to-10710
- ↑ http://hdl.handle.net/10042/to-10647
- ↑ http://hdl.handle.net/10042/to-10711
- ↑ http://hdl.handle.net/10042/to-10717
- ↑ http://hdl.handle.net/10042/to-10706
- ↑ http://hdl.handle.net/10042/to-10718
- ↑ http://hdl.handle.net/10042/to-10712
- ↑ http://hdl.handle.net/10042/to-10707


