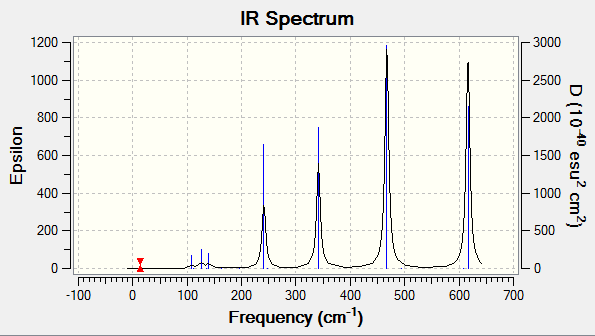
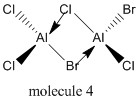
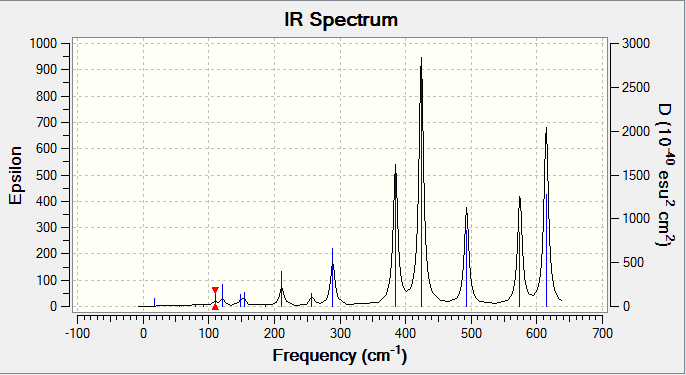
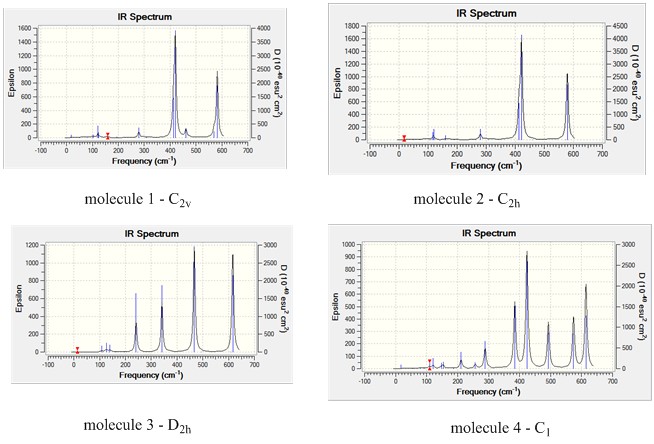
Rep:Mod:msm11
Name : Mohammad Syahmi Mohammad Suferi.
CID no. : 00695466
Week 1 - Laying the foundations
Working with BH3
First optimisation
The structure of BH3 was drawn using the Gaussview program and later optimised using the low level basis set 3-21G. The log file of the first optimisation of BH3and the summary of the optimisation of the molecule are attached and the 'Item' table showing the calculation was successful is shown below.
   Item               Value     Threshold  Converged?
 Maximum Force            0.000413     0.000450     YES
 RMS     Force            0.000271     0.000300     YES
 Maximum Displacement     0.001610     0.001800     YES
 RMS     Displacement     0.001054     0.001200     YES
 Predicted change in Energy=-1.071764D-06
 Optimization completed.
    -- Stationary point found.
                           ----------------------------
                           !   Optimized Parameters   !
                           ! (Angstroms and Degrees)  !
 --------------------------                            --------------------------
 ! Name  Definition              Value          Derivative Info.                !
 --------------------------------------------------------------------------------
 ! R1    R(1,2)                  1.1935         -DE/DX =    0.0004              !
 ! R2    R(1,3)                  1.1935         -DE/DX =    0.0004              !
 ! R3    R(1,4)                  1.1935         -DE/DX =    0.0004              !
 ! A1    A(2,1,3)              120.0            -DE/DX =    0.0                 !
 ! A2    A(2,1,4)              120.0            -DE/DX =    0.0                 !
 ! A3    A(3,1,4)              120.0            -DE/DX =    0.0                 !
 ! D1    D(2,1,4,3)            180.0            -DE/DX =    0.0                 !
 --------------------------------------------------------------------------------
 GradGradGradGradGradGradGradGradGradGradGradGradGradGradGradGradGradGrad
Second optimisation
The second optimisation was then carried out on the optimised BH3 molecule using a higher level basis set 6-31G(d,p). Additional keywords of int=ultrafine scf=conver=9 was added to increase the accuracy of the calculation. The log file with the summary are attached, with the 'Item' table shown below. The optimised molecule has a new H-B bond length of 1.19 angstroms and H-B-H angle of 120.0o. The total energy of the second optimised molecule is -26.61532364 a.u. and compared to the first optimisation, the energy has decreased from -26.46226338 a.u..
         Item               Value     Threshold  Converged?
 Maximum Force            0.000003     0.000015     YES
 RMS     Force            0.000002     0.000010     YES
 Maximum Displacement     0.000013     0.000060     YES
 RMS     Displacement     0.000008     0.000040     YES
 Predicted change in Energy=-6.153662D-11
 Optimization completed.
    -- Stationary point found.
                           ----------------------------
                           !   Optimized Parameters   !
                           ! (Angstroms and Degrees)  !
 --------------------------                            --------------------------
 ! Name  Definition              Value          Derivative Info.                !
 --------------------------------------------------------------------------------
 ! R1    R(1,2)                  1.1923         -DE/DX =    0.0                 !
 ! R2    R(1,3)                  1.1923         -DE/DX =    0.0                 !
 ! R3    R(1,4)                  1.1923         -DE/DX =    0.0                 !
 ! A1    A(2,1,3)              120.0            -DE/DX =    0.0                 !
 ! A2    A(2,1,4)              120.0            -DE/DX =    0.0                 !
 ! A3    A(3,1,4)              120.0            -DE/DX =    0.0                 !
 ! D1    D(2,1,4,3)            180.0            -DE/DX =    0.0                 !
 --------------------------------------------------------------------------------
 GradGradGradGradGradGradGradGradGradGradGradGradGradGradGradGradGradGrad
Working with GaBr3
The molecule GaBr3 was created using the program Gaussview, but the optimisation was carried out on the HPC cluster in which the summary of the calculation is linked. The optimisation was carried out using the basis set LanL2DZ. The 'Item' table is shown below:
         Item               Value     Threshold  Converged?
 Maximum Force            0.000000     0.000450     YES
 RMS     Force            0.000000     0.000300     YES
 Maximum Displacement     0.000003     0.001800     YES
 RMS     Displacement     0.000002     0.001200     YES
 Predicted change in Energy=-1.282695D-12
 Optimization completed.
    -- Stationary point found.
                           ----------------------------
                           !   Optimized Parameters   !
                           ! (Angstroms and Degrees)  !
 --------------------------                            --------------------------
 ! Name  Definition              Value          Derivative Info.                !
 --------------------------------------------------------------------------------
 ! R1    R(1,2)                  2.3502         -DE/DX =    0.0                 !
 ! R2    R(1,3)                  2.3502         -DE/DX =    0.0                 !
 ! R3    R(1,4)                  2.3502         -DE/DX =    0.0                 !
 ! A1    A(2,1,3)              120.0            -DE/DX =    0.0                 !
 ! A2    A(2,1,4)              120.0            -DE/DX =    0.0                 !
 ! A3    A(3,1,4)              120.0            -DE/DX =    0.0                 !
 ! D1    D(2,1,4,3)            180.0            -DE/DX =    0.0                 !
 --------------------------------------------------------------------------------
 GradGradGradGradGradGradGradGradGradGradGradGradGradGradGradGradGradGrad
The optimised structure of GaBr3 has a Ga-Br bond length of 2.35 angstroms and Br-Ga-Br angle of 120.0o. The bond length of the Ga-Br bond was found to be 2.35 angstroms[1]. The values are the same and this shows that the optimisation of the structure of the molecule was successful.
Working with BBr3
Using the optimised log file of BH3 as the base for our calculations, the molecule BBr3 was created and further optimisation was carried out on the molecule. The optimisation of the molecule was carried out by using the 6-31G(d,p) basis set for boron and the LanL2DZ basis set for the bromine atoms. The uses of mixed basis set was possible by using the GEN option and editing the input file and assigning the appropriate basis set to each atom. The input file of the calculation is as as follows:
# opt b3lyp/gen geom=connectivity pseudo=read gfinput

bh3 second optimisation

0 1
 B                  0.00000000    0.00000000    0.00000000
 Br                 0.00000000    2.02000000    0.00000000
 Br                -1.74937084   -1.01000082    0.00000000
 Br                 1.74937084   -1.01000082    0.00000000

 1 2 1.0 3 1.0 4 1.0
 2
 3
 4

B 0
6-31G(d,p)
****
Br 0
LanL2DZ
****

Br 0
LanL2DZ
The calculation was carried out on an HPC cluster and the summary of the calculations is attached. The 'Item' table showing the optimisation converged is shown below. The optimised molecule has a B-Br bond length of 1.93 angstroms and Br-B-Br angle of 120.0o
         Item               Value     Threshold  Converged?
 Maximum Force            0.000008     0.000450     YES
 RMS     Force            0.000005     0.000300     YES
 Maximum Displacement     0.000036     0.001800     YES
 RMS     Displacement     0.000023     0.001200     YES
 Predicted change in Energy=-4.026784D-10
 Optimization completed.
    -- Stationary point found.
                           ----------------------------
                           !   Optimized Parameters   !
                           ! (Angstroms and Degrees)  !
 --------------------------                            --------------------------
 ! Name  Definition              Value          Derivative Info.                !
 --------------------------------------------------------------------------------
 ! R1    R(1,2)                  1.934          -DE/DX =    0.0                 !
 ! R2    R(1,3)                  1.934          -DE/DX =    0.0                 !
 ! R3    R(1,4)                  1.934          -DE/DX =    0.0                 !
 ! A1    A(2,1,3)              120.0            -DE/DX =    0.0                 !
 ! A2    A(2,1,4)              120.0            -DE/DX =    0.0                 !
 ! A3    A(3,1,4)              120.0            -DE/DX =    0.0                 !
 ! D1    D(2,1,4,3)            180.0            -DE/DX =    0.0                 !
 --------------------------------------------------------------------------------
 GradGradGradGradGradGradGradGradGradGradGradGradGradGradGradGradGradGrad
Comparison of results
| Molecule | Bond Lengths / angstroms |
|---|---|
| BH3 | 1.19 |
| BBr3 | 1.93 |
| GaBr3 | 2.35 |
BH3 has a bond length of 1.19 angstroms while BBr3 has a bond length of 1.93 angstroms. Although bromine is more electronegative in comparison with hydrogen, changing the ligands from hydrogen to bromine results in the lengthening of the bond length. This is due to bromine being bigger in size than hydrogen and B-Br bond is made by using the more diffused orbitals of bromine and the resultant bond is weaker compared to B-H bond which is shorter and stronger.
Comparing the bond lengths in BBr3 with GaBr3 shows that Ga-Br bond is longer than B-Br bond. The difference between these two molecules is the central atom. Although they are in the same group of the periodic table, gallium in the lower rows compared to boron and therefore is bigger in size and having valence electrons occupying the more diffused orbitals compared to boron. In the formation of Ga-Br bond, the diffused orbitals are used and this results in the overlaps between the orbitals to be weaker compared to the overlapping orbitals that can be found in the B-Br bond. This results in a weaker bond and therefore the lengthening of the Ga-Br bond.
What is a bond?
Simply put, a bond is when two atoms interacting with each other to create an attractive force towards each other. Generally, this is achieved by having the atomic orbitals of the two atoms to overlap with each other in the same phase. The overlapping of the orbitals lowers the energy of the resulting molecular orbital and therefore the whole molecule as a whole. This leads to the formation of a bond favourable and therefore making the two atoms attracted to each other.
Since the formation of a bond is the overlap between two orbitals, the program GaussView sees it that there should be a certain distance in which a covalent bond can only happen. If the distance between the two atoms are greater than this value, a bond is not drawn.
Frequency analysis
BH3
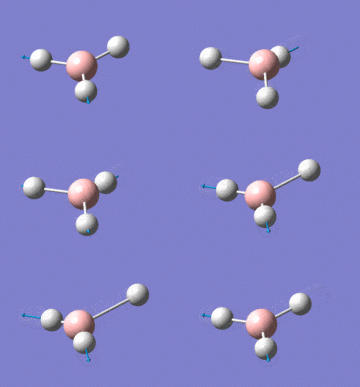
Frequency analysis was carried out on the optimised BH3 molecule in which the log file and the summary of the calculations are attached. It should be noted that the energy of the molecule doesn't change when the frequency analysis is carried out on the molecule.
Low frequencies --- -6.9470 -6.9094 -0.0273 0.0005 0.7219 6.7701
Low frequencies --- 1163.0029 1213.1581 1213.1583
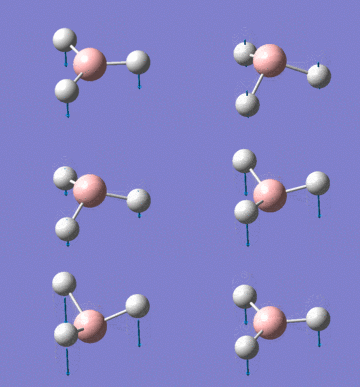
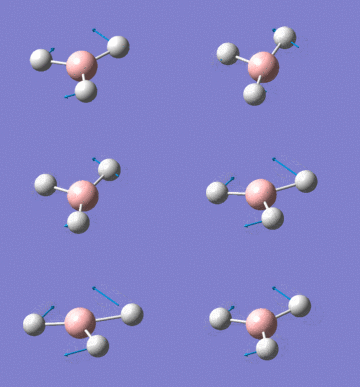
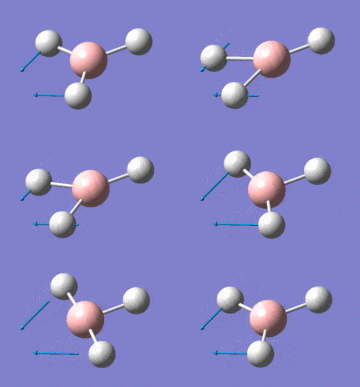
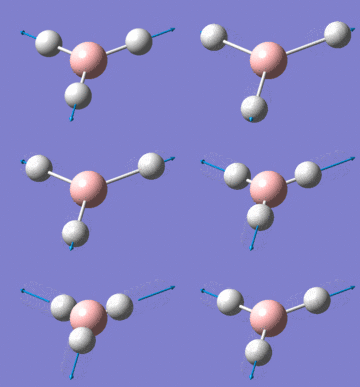
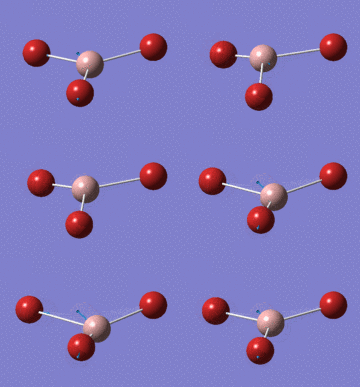
Using the equation 3N-6, it can be quickly determined that there are 6 vibrations for the molecule. From the IR spectrum of BH3, only three peaks can be seen from the graph. This is due to the vibrations at 1213 cm-1 and 2716 cm-1 being degenerate and the vibration at 2582cm-1 not observable due to the intensity being 0.
GaBr3
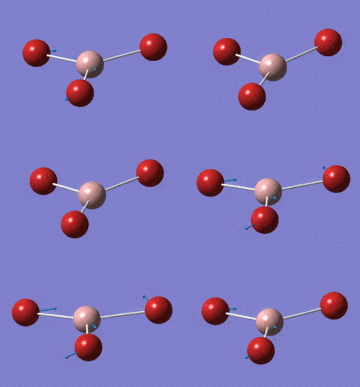
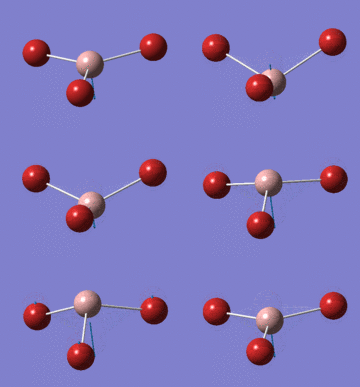
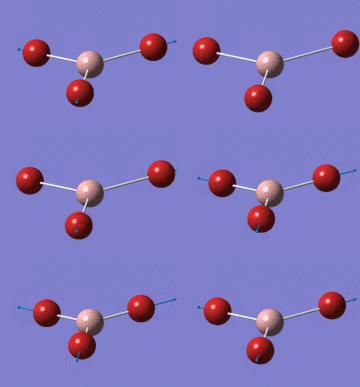
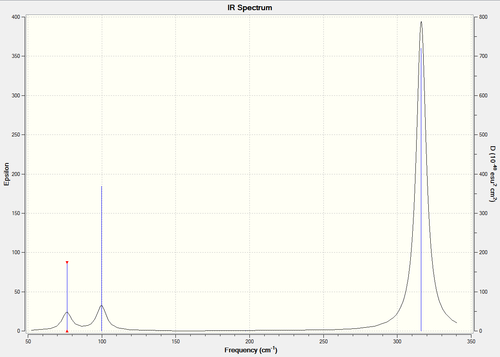
Frequency analysis of the optimised GaBr3 was carried out on the HPC cluster. The log file and the summary of the calculations can be found attached.
Low frequencies --- -0.5252 -0.5247 -0.0024 -0.0010 0.0235 1.2010
Low frequencies --- 76.3744 76.3753 99.6982
IR frequencies of GaBr3
Comparison of results between BH3 and GaBr3
| No | BH3 vibration frequencies | symmetry of D3h | GaBr3 vibration frequencies | symmetry of D3h | |
|---|---|---|---|---|---|
| 1 | 1163 | A2" | 76 | E' | |
| 2 | 1213 | E' | 76 | E' | |
| 3 | 1213 | E' | 100 | A2" | |
| 4 | 2582 | A1' | 197 | A1' | |
| 5 | 2716 | E' | 316 | E' | |
| 6 | 2716 | E' | 316 | E' |
Three peaks can be seen for the two spectra. This is due to the molecules having the same structure and therefore having the same point group. Both of the molecules have 2 degenerate stretches. But, the peaks in GaBr3 have lower values compared to the spectrum in BH3. This shows that Ga-Br bond is weaker compared to the B-H bond. This is due to both gallium and bromine are in the lower rows compared to boron and hydrogen and therefore having to use more diffused orbitals for the overlapping interactions and subsequently having weaker interactions. Being in the lower rows also make the molecule heavier than BH3. Since frequency is indirectly proportional to reduced mass of a molecule, the increase in reduced mass of the molecule reduces the overall frequencies of the vibrations.
It should also be noted that there has been a reordering between A2" and E' of the BH3 compared to the GaBr3. The symmetrical bending vibration has the lowest energy in BH3 while being higher in energy than the degenerate bending modes in GaBr3. This is due to bromine being more electronegative than gallium. This effect is multiplied due to gallium being big and that the electrons are easily polarised.
The frequency analysis was carried out by using the same calculation methods and basis set used in the optimisation of the structure of the molecule. This is because by using a different method or basis set, the structure of the molecule is changed and this subsequently the way the atoms interact with each other. Changing the interactions between the atoms changes how they vibrate and therefore changing the frequency values, intensity or even the symmetry of the point group since they may not be in the same point group.
Frequency analysis have the advantage since the IR spectrum can be predicted without carrying an actual experiment. This is useful for a lot of reasons. The first being that this can allows for an experiment to be done without exposure to harmful substances (e.g. toxic substances). The second reason is that the predicted IR spectrum can be compared with an actual data of an experiment. This could prove useful when the product of an experiment was not known. The ability to predict the IR spectrum is also useful because in catching the peaks that we would have missed if the peaks that are out of range than the range we normally work in.
Low frequencies indicate how much the centre of the mass of the molecule moves during the vibrations (translational and rotational). The closer the values to 0 is better meaning that there isn't a lot of movement to the centre of the mass and the frequency is due only to the vibrations of the bonds. This leads to a better prediction of the frequency values and intensities.
Molecular orbitals of BH3
Using the optimised structure of BH3, the calculation for the energy of the molecular orbitals was carried out with full NBO. The population analysis of BH3 was carried out using the additional keywords pop=full. The calculation was carried out on HPC cluster.
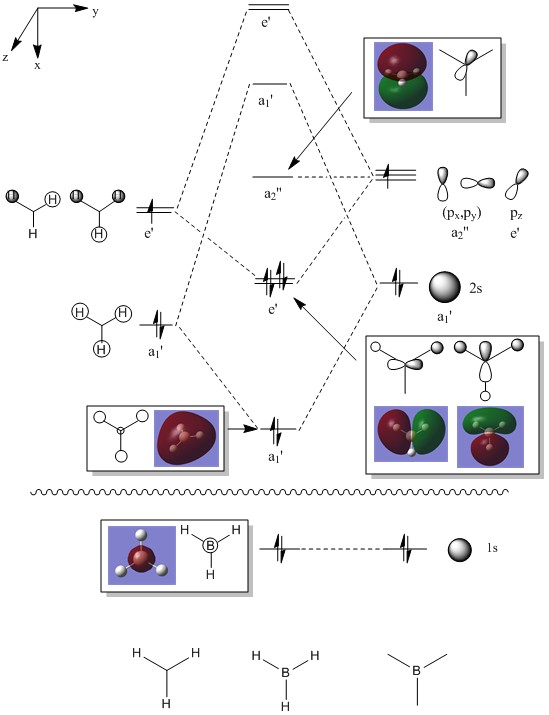
By putting the molecular orbitals from the calculations and the molecular orbitals deduced using LCAO side-by-side, it can be seen that they are quite similar. This shows that the calculations are reliable and can be used on bigger molecules to predict its molecular orbitals.
NBO analysis with NH3
Optimisation of the molecule
A full NBO analysis was carried out from the start on the molecule NH3. The molecule was drawn and optimised using high level basis set 6-31G(d,p) together with the additional keywords int=ultrafine scf=conver=9 nosymm. Optimisation using a low level basis set was not carried out on this molecule prior to this as it was unnecessary due to the size of the molecule being small. The log file and the summary of the calculations can be found attached.
        Item               Value     Threshold  Converged?
 Maximum Force            0.000018     0.000450     YES
 RMS     Force            0.000010     0.000300     YES
 Maximum Displacement     0.000098     0.001800     YES
 RMS     Displacement     0.000058     0.001200     YES
 Predicted change in Energy=-1.680118D-09
 Optimization completed.
    -- Stationary point found.
                           ----------------------------
                           !   Optimized Parameters   !
                           ! (Angstroms and Degrees)  !
 --------------------------                            --------------------------
 ! Name  Definition              Value          Derivative Info.                !
 --------------------------------------------------------------------------------
 ! R1    R(1,2)                  1.018          -DE/DX =    0.0                 !
 ! R2    R(1,3)                  1.018          -DE/DX =    0.0                 !
 ! R3    R(1,4)                  1.018          -DE/DX =    0.0                 !
 ! A1    A(2,1,3)              105.7405         -DE/DX =    0.0                 !
 ! A2    A(2,1,4)              105.7486         -DE/DX =    0.0                 !
 ! A3    A(3,1,4)              105.7486         -DE/DX =    0.0                 !
 ! D1    D(2,1,4,3)            111.8625         -DE/DX =    0.0                 !
 --------------------------------------------------------------------------------
 GradGradGradGradGradGradGradGradGradGradGradGradGradGradGradGradGradGrad
Frequency analysis
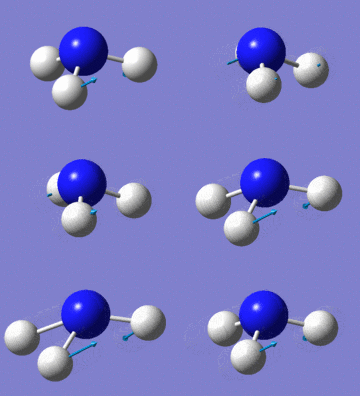
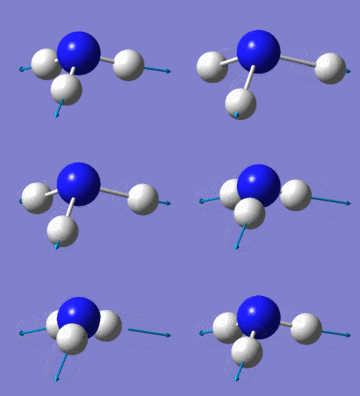
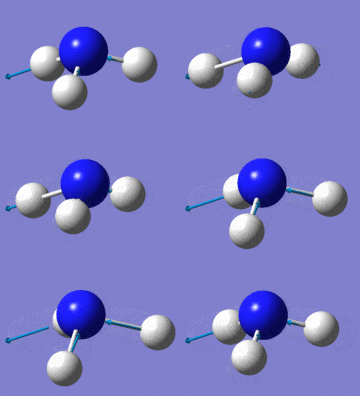
Frequency analysis was carried out on the optimised molecule and the log file together with the summary can be found attached.
Low frequencies --- -6.9302 0.0009 0.0010 0.0014 9.2771 12.8692
Low frequencies --- 1089.3160 1693.9104 1693.9551
Population analysis
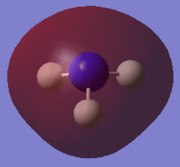
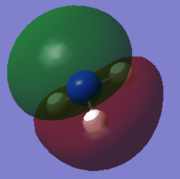
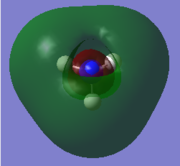
Using the optimised structure of NH3, the calculations for the energy of the molecular orbitals of the molecule was carried out using full NBO. Additional keywords int=ultrafine scf=conver=9 pop=full was also being used here. The checkpoint file and the summary of the calculations can be found attached.
| MO pictures of NH3 molecule from the lowest energy MO to the LUMO | |
|---|---|
 |
 |
 |
 |
 |
 |
Natural bond order analysis
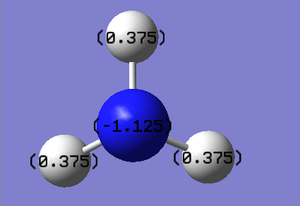
The log file from the population analysis calculation of the molecule NH3 can be opened to view the charge distribution in the molecule.
Natural bond order (NBO) analysis is the analysis of charge distribution in a molecule. The analyses are carried out to compute the distribution of charge density in the bonds formed between the atoms in molecules.
In NH3, the negative charge are accumulated in the nitrogen atoms while the positively charge are shared among the hydrogen atoms. This is due to the nitrogen atoms being more electronegative compared to the hydrogen atoms pulling the bonding electrons towards the nitrogen centre.
Association energies: Ammonia-Borane
Creating and optimising Ammonia-Borane
Ammonia-borane was drawn and the structure of the molecule was then optimised using the high level basis set 6-31G(d,p) together with the additional keywords int=ultrafine scf=conver=9. The Log file and the summary of the optimisation carried out can be found attached.
         Item               Value     Threshold  Converged?
 Maximum Force            0.000233     0.000450     YES
 RMS     Force            0.000083     0.000300     YES
 Maximum Displacement     0.000981     0.001800     YES
 RMS     Displacement     0.000370     0.001200     YES
 Predicted change in Energy=-4.049051D-07
 Optimization completed.
    -- Stationary point found.
Frequency analysis
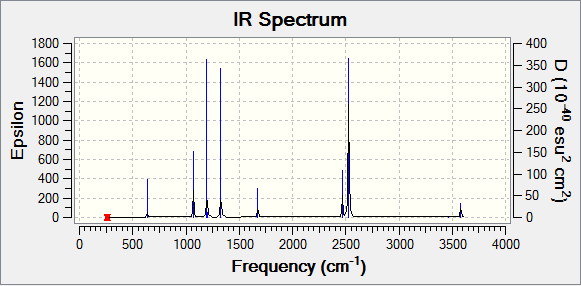
Frequency analysis was then carried out on the structure. The log file and the summary are attached.
Low frequencies --- -0.0278 -0.0159 -0.0027 9.9777 9.9857 38.0969
Low frequencies --- 265.4104 634.4271 639.1925
| No | frequency | intensity | symmetry C3v point group | No | frequency | intensity | symmetry C3v point group | |
|---|---|---|---|---|---|---|---|---|
| 1 | 265 | 0 | A | 10 | 1328 | 114 | A | |
| 2 | 634 | 14 | A | 11 | 1676 | 28 | E | |
| 3 | 639 | 4 | E | 12 | 1676 | 28 | E | |
| 4 | 639 | 4 | E | 13 | 2469 | 67 | A | |
| 5 | 1070 | 41 | E | 14 | 2528 | 232 | E | |
| 6 | 1070 | 41 | E | 15 | 2528 | 232 | E | |
| 7 | 1197 | 109 | A | 16 | 3465 | 3 | A | |
| 8 | 1204 | 3 | E | 17 | 3582 | 28 | E | |
| 9 | 1204 | 3 | E | 18 | 3582 | 28 | E |
Association energies of Ammonia-Borane
E(NH3) = -56.55776872 a.u.
E(BH3) = -26.61532364 a.u.
E(NH3BH3) = -83.22468857 a.u.
ΔE = E(NH3BH3)-[E(NH3)+E(BH3)]
ΔE = -83.22468857 a.u.-[-56.55776872 a.u.+-26.61532364 a.u.]
ΔE = -83.22468857 a.u.-[-83.17309236 a.u.]
ΔE = -0.05159621 a.u.
ΔE = -135.47 kJ mol-1
The negative number for the association energy shows that the it is favourable for ammonia to react with borane as it lowers the energy of the system.
Week 2 - Lewis Acid and Bases
The molecule Al2Cl4Br2
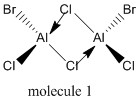
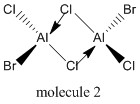
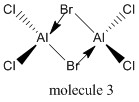
Four isomers are identified for the molecule Al2Cl4Br2 if they are to be made from the monomer AlCl2Br. They are each drawn in the program Gaussview and optimised.
Molecule 1
Molecule 1, the cis-dibromo isomer has a point group of C2v.
1st optimisation
The molecule was drawn and optimised using a low level basis set 3-21G. The log file and summary can be found attached.
         Item               Value     Threshold  Converged?
 Maximum Force            0.000039     0.000450     YES
 RMS     Force            0.000017     0.000300     YES
 Maximum Displacement     0.001702     0.001800     YES
 RMS     Displacement     0.000542     0.001200     YES
 Predicted change in Energy=-6.283013D-08
 Optimization completed.
    -- Stationary point found.
2nd optimisation
The optimised molecule is then optimised using the full basis set 6-31G(d,p) for aluminium and chlorine and the basis set LANL2DZ for the bromine. This was achieved using the GEN option and altering the input file as shown below. This makes the calculations to be computed on the molecule using separate basis sets on the atoms in the molecule.
# freq b3lyp/gen geom=connectivity gfinput pseudo=read

msm11 - al2cl4br2 molecule 2nd optimisation

0 1
 Al                -1.62269100    0.46011700   -0.00007900
 Al                 1.62269100    0.46011600    0.00006500
 Cl                -0.00006200    0.45013400    1.62737100
 Cl                 0.00006400    0.45008200   -1.62738500
 Cl                -2.61830100    2.30216700   -0.00012800
 Br                 2.76358500   -1.50772200    0.00013200
 Br                -2.76360100   -1.50770900   -0.00008600
 Cl                 2.61833100    2.30214900    0.00005700

 1 3 1.0 4 1.0 5 1.0 7 1.0
 2 3 1.0 4 1.0 6 1.0 8 1.0
 3
 4
 5
 6
 7
 8

Al 0
6-31G(d,p)
****
Cl 0
6-31G(d,p)
****
Br 0
LanL2DZ
****

Br 0
LanL2DZ
The log file and the summary of the calculations can be found attached.
The molecule has a Al-Br bond length of 2.27 angstrom. The terminal Al-Cl bond length is 2.09 angstroms while the bridging AL-Cl bond length is 2.30 angstroms. The Al-Cl-Al angle is 89.8o.
         Item               Value     Threshold  Converged?
 Maximum Force            0.000039     0.000450     YES
 RMS     Force            0.000016     0.000300     YES
 Maximum Displacement     0.001348     0.001800     YES
 RMS     Displacement     0.000418     0.001200     YES
 Predicted change in Energy=-2.499279D-08
 Optimization completed.
    -- Stationary point found.
Frequency analysis
Frequency analysis was carried out on the optimised molecule. The point group of the molecule was restricted to C2v. The log file and the summary of the calculations are attached.
Low frequencies --- -3.8270 -2.2370 -0.0026 -0.0019 0.0006 1.3839
Low frequencies --- 17.2004 50.9448 78.5394
| No | frequency | intensity | symmetry C2v point group | No | frequency | intensity | symmetry C2v point group | |
|---|---|---|---|---|---|---|---|---|
| 1 | 17 | 0 | A | 10 | 194 | 2 | A | |
| 2 | 51 | 0 | A | 11 | 264 | 0 | A | |
| 3 | 79 | 0 | A | 12 | 279 | 25 | A | |
| 4 | 99 | 0 | A | 13 | 309 | 2 | A | |
| 5 | 103 | 3 | A | 14 | 413 | 149 | A | |
| 6 | 121 | 13 | A | 15 | 420 | 411 | A | |
| 7 | 123 | 6 | A | 16 | 461 | 35 | A | |
| 8 | 157 | 0 | A | 17 | 570 | 32 | A | |
| 9 | 158 | 5 | A | 18 | 582 | 278 | A |
Molecule 2
Molecule 2, the trans-isomer has a point group of C2h.
Optimisation of the structure
Molecule 2 was built upon the 3-21G optimised structure of molecule 1. Hence, the optimisation for the molecule was carried out using only the high level basis set 6-31G(d,p) for aluminium and chlorine and LanL2DZ for the bromine. The log file and the summary of the calculations can be found attached.
         Item               Value     Threshold  Converged?
 Maximum Force            0.000011     0.000450     YES
 RMS     Force            0.000006     0.000300     YES
 Maximum Displacement     0.000572     0.001800     YES
 RMS     Displacement     0.000175     0.001200     YES
 Predicted change in Energy=-3.837277D-09
 Optimization completed.
    -- Stationary point found.
Frequency analysis
The point group of the molecule was constrained to C2h and frequency analysis was carried on the optimised molecule in which the log file and the summary can found attached.
Low frequencies ---   -4.3946   -2.3808   -0.7391    0.0020    0.0021    0.0023
Low frequencies ---   17.6366   48.9601   72.9439
| No | frequency | intensity | symmetry C2h point group | No | frequency | intensity | symmetry C2h point group | |
|---|---|---|---|---|---|---|---|---|
| 1 | 18 | 0 | Bu | 10 | 192 | 0 | Ag | |
| 2 | 49 | 0 | Au | 11 | 264 | 0 | Bg | |
| 3 | 73 | 0 | Ag | 12 | 280 | 29 | Bu | |
| 4 | 105 | 0 | Ag | 13 | 308 | 0 | Ag | |
| 5 | 110 | 0 | Bg | 14 | 413 | 149 | Au | |
| 6 | 117 | 9 | Au | 15 | 421 | 439 | Bu | |
| 7 | 120 | 13 | Bu | 16 | 459 | 0 | Ag | |
| 8 | 157 | 0 | Bg | 17 | 570 | 0 | Ag | |
| 9 | 160 | 6 | Bu | 18 | 579 | 316 | Bu |
Molecule 3
Molecule 3, the isomer with two bridging bromine atoms has a point group of D2h.
Optimisation of the structure
Using the optimised structure of molecule 1 as the base structure, molecule 3 was created before the molecule was optimised using the GEN option. The basis set 6-31G(d,p) was used on the aluminium and chlorine atoms while the basis set LAnL2DZ was used for the bromine atoms. The log file and the summary of the calculations can be found here.
         Item               Value     Threshold  Converged?
 Maximum Force            0.000014     0.000450     YES
 RMS     Force            0.000008     0.000300     YES
 Maximum Displacement     0.000779     0.001800     YES
 RMS     Displacement     0.000262     0.001200     YES
 Predicted change in Energy=-8.421580D-09
 Optimization completed.
    -- Stationary point found.
Frequency analysis
The point group of the molecule was constrained to C2v before the frequency analysis calculation was carried out on the molecule. The log file and the summary of the calculations can be found attached.
Low frequencies --- -5.1549 -4.9460 -3.3779 0.0021 0.0023 0.0024
Low frequencies --- 14.8476 63.3179 86.1117
| No | frequency | intensity | symmetry C2v point group | No | frequency | intensity | symmetry C2v point group | |
|---|---|---|---|---|---|---|---|---|
| 1 | 15 | 0 | B2u | 10 | 163 | 0 | Ag | |
| 2 | 63 | 0 | Au | 11 | 197 | 00 | B2g | |
| 3 | 86 | 0 | B3g | 12 | 241 | 100 | B3u | |
| 4 | 87 | 0 | Ag | 13 | 247 | 0 | Ag | |
| 5 | 108 | 5 | B1u | 14 | 341 | 161 | B1u | |
| 6 | 111 | 0 | B1g | 15 | 467 | 346 | B3u | |
| 7 | 126 | 8 | B3u | 16 | 494 | 0 | Ag | |
| 8 | 135 | 0 | B2g | 17 | 608 | 0 | B1g | |
| 9 | 138 | 7 | B2u | 18 | 616 | 332 | B2u |
Molecule 4
The molecule has a point group of C1
Optimisation of the structure
Molecule 4 was created using the optimised structure of molecule 1 as its base structure. Optimisation of the structure of the molecule was then carried out using the basis set of 6-31G(d,p) for the aluminium and chlorine atoms and the basis set LanL2DZ for the bromine atoms. This was achieved by using the GEN option and changing the input file so the calculations was carried out using the intended basis sets. The log file and the summary of the calculations can be found attached.
         Item               Value     Threshold  Converged?
 Maximum Force            0.000049     0.000450     YES
 RMS     Force            0.000022     0.000300     YES
 Maximum Displacement     0.000900     0.001800     YES
 RMS     Displacement     0.000336     0.001200     YES
 Predicted change in Energy=-7.252745D-08
 Optimization completed.
    -- Stationary point found.
Frequency analysis
The molecule was not restricted to any point group due to the structure of the molecule having no symmetry. Frequency analysis was carried out on the molecule and the log file and the summary of the calculations can be found attached.
Low frequencies --- -2.5044 0.0017 0.0019 0.0021 1.4635 3.1273
Low frequencies --- 17.1746 55.9651 80.0668
| No | frequency | intensity | symmetry C2v point group | No | frequency | intensity | symmetry C2v point group | |
|---|---|---|---|---|---|---|---|---|
| 1 | 17 | 0 | A | 10 | 186 | 0 | A | |
| 2 | 56 | 0 | A | 11 | 211 | 21 | A | |
| 3 | 80 | 0 | A | 12 | 257 | 10 | A | |
| 4 | 92 | 0 | A | 13 | 289 | 48 | A | |
| 5 | 107 | 0 | A | 14 | 385 | 153 | A | |
| 6 | 110 | 5 | A | 15 | 424 | 275 | A | |
| 7 | 123 | 6 | A | 16 | 193 | 107 | A | |
| 8 | 149 | 5 | A | 17 | 574 | 122 | A | |
| 9 | 154 | 6 | A | 18 | 614 | 197 | A |
Analysis and discussions
| Molecule | Calculated energy / a.u. | Difference of energy compared to the lowest energy / kJ mol-1 |
|---|---|---|
| 1 | -2352.41626677 | 26.15 |
| 2 | -2352.41629861 | 26.23 |
| 3 | -2352.40630796 | - |
| 4 | -2352.41109933 | 12.58 |
The table above is drawn to compare the energies between the molecules. It is shown that molecule 3 having the lowest energy, molecule 4 having a bit higher in energy and molecule 1 and 2 having the highest in energy compared to the other 2 molecules. The difference between the 4 structures is the composition of the atoms that acts as the Lewis base (the bridging atoms).
The molecule with the lowest energy state, molecule 3, has two bridging bromine atoms. Molecule 4 has one bridging bromine, while there are none in molecules 1 and 2. The monomers that make up the molecules are the same and the atom acting as Lewis acid is the same (aluminium). So, the difference in the energies is due to the difference in ability between chlorine and bromine atoms to act as Lewis base. In molecule 3, there are two bromine atoms acting as the Lewis bases resulting in the molecule having a lower energy compared to the other isomers. This is due to chlorine being more electronegative than bromine. The electronegativity in chlorine makes the chlorine to hold on to the electrons more than the bromine would. This reduces its ability to donate electrons, which results in the reduction of its Lewis basicity. This makes bromine a better Lewis base compared to chlorine. This results in molecule 3 having lower energy and molecule 4 having the energy halfway between molecule 3 and molecules 1 and 2.
Dissociation energies of molecule 3 into 2 AlCl2Br molecules
Optimisation of the structure of the molecule AlCl2Br
The structure of the molecule AlCl2Br is drawn and the structure is then optimised using the low level basis set 3-21G. The log file and summary of the calculations are attached.
               Value     Threshold  Converged?
 Maximum Force            0.000006     0.000450     YES
 RMS     Force            0.000004     0.000300     YES
 Maximum Displacement     0.000036     0.001800     YES
 RMS     Displacement     0.000025     0.001200     YES
 Predicted change in Energy=-3.947812D-10
 Optimization completed.
    -- Stationary point found.
Subsequent optimisation was then carried out on the structure of the molecule using a higher level basis set 6-21G on aluminium and chlorine atoms and LanL2DZ on the bromine atoms. This was achieved by choosing the GEN option, adding in additional keywords gfinput pseudo=read and altering the input file so that the calculations will use the chosen basis sets for the atoms. The log file and the summary of the calculations are attached.
         Item               Value     Threshold  Converged?
 Maximum Force            0.000005     0.000450     YES
 RMS     Force            0.000002     0.000300     YES
 Maximum Displacement     0.000022     0.001800     YES
 RMS     Displacement     0.000012     0.001200     YES
 Predicted change in Energy=-1.397812D-10
 Optimization completed.
    -- Stationary point found.
Calculations for the dissociation energy
Using the optimised structure of the AlCl2Br, it was found that the energy of the molecule to be -1176.19013697 a.u.. Of the four isomers of the dimer, molecule 3 has the lowest energy of -2352.40630796 a.u.. From these values, the dissociation energy for the molecule Al2Cl4Br2 can be found.
E(AlCl2Br) = -1176.19013697 a.u.
E(Al2Cl4Br2) = -2352.40630796 a.u.
ΔE = 2 [E(AlCl2Br)]- E (Al2Cl4Br2)
ΔE = 2(-1176.19013697 a.u.) - (-2352.40630796 a.u.)
ΔE = -2352.380274 a.u.-[-2352.40630796 a.u.]
ΔE = +0.02603396 a.u.
ΔE = +68.35 kJ mol-1
The positive value shows that the dissociation energy of the molecule Al2Cl4Br2 into its monomer is not favourable. This means that the dimer is more stable than the monomers and that the monomers are more willing to dimerise than being isolated. This is due to the fact that the aluminium centre is a good Lewis acid, because of the three electronegative atoms attached to it. Another reason is due to bromine being a good Lewis base as described in the previous section. This is due to bromine having lone pairs and donating one of the lone pairs will reduce the energy of the whole system.
IR spectra
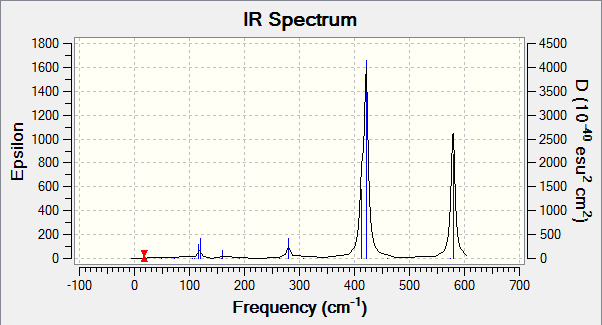
The diagram shows that molecule 4 has a lot more bands that can be seen although all 4 of the molecules have the same number of the vibrations (18). For example, molecule 2 has 2 strong and sharp peaks compared to molecule 4 which has a more peaks of the same level of intensity.
For a vibration to be observable in an IR spectrum, the vibration needs to have a higher enough intensity for the peak to show in the IR spectrum. The intensity of the peaks is due to the structure of the molecules. Highly symmetrical molecules have a lot less observable bands due to the vibrations being IR inactive. For example, molecule 2 has a point group of C2h, the structure is highly symmetrical and a change of dipole moment during vibrations in one way might get cancelled by dipole moment acting in an opposite direction. This makes the intensity of the vibration to be 0 (IR inactive). This results in the IR spectrum to have only 2 observable peaks.
Compared to molecule 4, the molecule has a point group of C1. This molecule is lacking in symmetry and during vibrations, any change in dipole moment is not cancelled and this results in the vibrations being observable in the IR spectrum (IR active).
The results of the IR spectrum is not as expected for molecule 3. Compared to other molecules, molecule 3 is the most symmetrical molecule compared to the other molecules. But it has more peaks than molecules 1 and 2.
Vibration modes
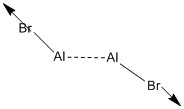
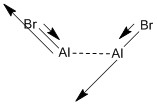
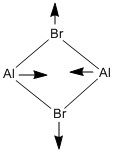
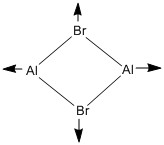
Both molecule 1 and 2 have the same Al-Br terminal bonds. Comparing the two molecules, the mode of stretching is the same for the same mode of vibration. The only exception would be vibration modes numbered 17 and 18. There has been a reordering in the mode of stretching between the two molecules. This is because in this mode of vibration, it is only the aluminium atoms that are moving as shown in the picture. When the bromine changes its position from cis to trans, this changes the timing of the stretching and compressing of the Al-Br bond leading to the inverted order of symmetric and antisymmetric stretching.
Between the two molecules, the frequency of the vibrations are equivalent owing to the similarity of the structure of the molecules. The only observable difference would be during the inversion of the mode of stretching is that the symmetric stretching has a higher frequency than the antisymmetric by an order of about 5cm-1, but this value is still too small to make use of (in differentiating between cis and trans isomers).
Molecule 1 has 2 terminal Al-Br bonds while molecule 3 has 2 bridging Al-Br bonds. By comparing the stretching in bridging and terminal bonds, it was found that the bridging Al-Br bonds stretches in lower frequencies compared to the terminal bonds. Generally for any given bond, stretching occurs at higher frequencies compared to the bending vibrations. The lower stretching frequency values means that the Al-Br bond is weaker in the 3-centre 4-electrons bond compared to the terminal Al-Br bonds. The higher frequency values where the Al-Br bond is bending is due to other vibrations (stretching of Al-Cl bond).
This is supported by comparing the bond lengths between the terminal and the bridging Al-Br bonds. The bond length of the bridging Al-Br is longer (2.49 angstroms) compared to the terminal Al-Br bond (2.27 angstroms). This shows the weakening of the Al-Br bond.
From these tables, it can also be observed that by pairing up the stretches, the antisymmetric stretches have lower frequencies than their complementary symmetric stretches.
Molecular orbitals of molecule 3
Molecule 3 is the most stable isomer compared to the other isomers of Al2Cl4Br2, hence population analysis was carried out on this molecule. Using the optimised structure of the molecule, the calculations for the energy of the molecule was carried out on full NBO together with the keywords pop=full. The checkpoint file is attached.
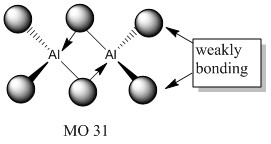
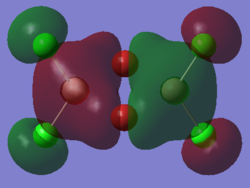
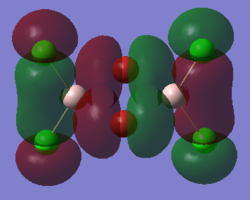
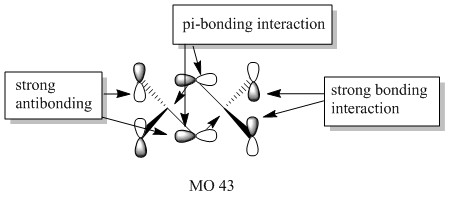
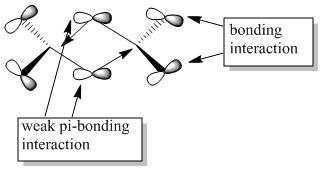
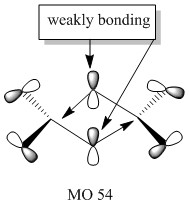
5 of the MOs are chosen to describe the bonding in the molecule. The MOs are shown from highly bonding to highly antibonding.
Conclusion
Week 1
In conclusion, computational chemistry is a powerful tool. Optimised structure of a molecule can be predicted including the bond lengths and the bond angle. Further computation can lead to the prediction of the vibrations of the molecules and therefore the IR spectrum that can be concluded. Using the optimised structure of the molecule and placing atomic orbitals on the atoms, molecular orbitals can be also predicted with accuracy which can prove to be very useful.
In this experiment, the structure BH3, GaBr3, BBr3 and NH3BH3 was drawn and the structure was optimised. The calculated Ga-Br bond length is the same as the experimental value of the Ga-Br bond length. Molecular orbitals of BH3 was computed and compared with the molecular orbitals from LCAO. The orbitals are the same which further shows that computational chemistry is a reliable and powerful tool.
Week 2
In this experiment, the isomers of the molecule Al2Cl4Br2 are drawn and the structures were then optimised. The key differences between the isomers can be predicted. Using the calculations, molecule 3 has the lowest energy compared to the other molecules. In this isomer, there are 2 bromine atoms acting as the bridging atoms. This shows that bromine atom is a better Lewis base than chlorine atom. This is due to the chlorine atom being more electronegative and pulling the electrons towards itself more than bromine would. This reduces the basicity of the chlorine atom. There is no difference in the acceptor central atom since these isomers are made from the same monomer.
Frequency analysis of the isomers also show that the bridging Al-Br bond is weaker than the terminal Al-Br bond. This is concluded from the lower Al-Br bond stretching frequency values of molecule 3 than the Al-Br bond stretching frequency values. This is supported by the longer bridging Al-Br bond than the terminal Al-Br bond. The lengthening of the bridging Al-Br bond shows that the bond is weaker.
Population analysis of molecule 3 shows that the non-core molecular orbitals is the interaction between the halogen atoms. The atomic orbital of the aluminium lies deep in energy and the orbital mismatch in energy and they don't interact. The all bonding interactions between the halogen atoms is low in energy and the fact that they are all bonding pushes the atoms towards the centre of the molecule. In this scenario, bonding interaction between the molecular orbital and the atomic orbital of the aluminium is possible although it is most likely that they are weak interactions.
References
- ↑ L. Maruzen Company, Kagaku Benran, 1984, II, 649-661.

